Pipes Supporting Statement B Final 10-18-17
Pipes Supporting Statement B Final 10-18-17.docx
Collection and Compilation of Water Pipeline Field Performance Data
OMB: 1006-0031
Supporting Statement B
Bureau of Reclamation
Collection and Compilation of Water Pipeline Field Performance Data
OMB Control Number 1006-XXXX
Collections of Information Employing Statistical Methods
The agency should be prepared to justify its decision not to use statistical methods in any case where such methods might reduce burden or improve accuracy of results. When the question “Does this ICR contain surveys, censuses, or employ statistical methods?” is checked "Yes," the following documentation should be included in Supporting Statement B to the extent that it applies to the methods proposed:
1. Describe (including a numerical estimate) the potential respondent universe and any sampling or other respondent selection method to be used. Data on the number of entities (e.g., establishments, State and local government units, households, or persons) in the universe covered by the collection and in the corresponding sample are to be provided in tabular form for the universe as a whole and for each of the strata in the proposed sample. Indicate expected response rates for the collection as a whole. If the collection had been conducted previously, include the actual response rate achieved during the last collection.
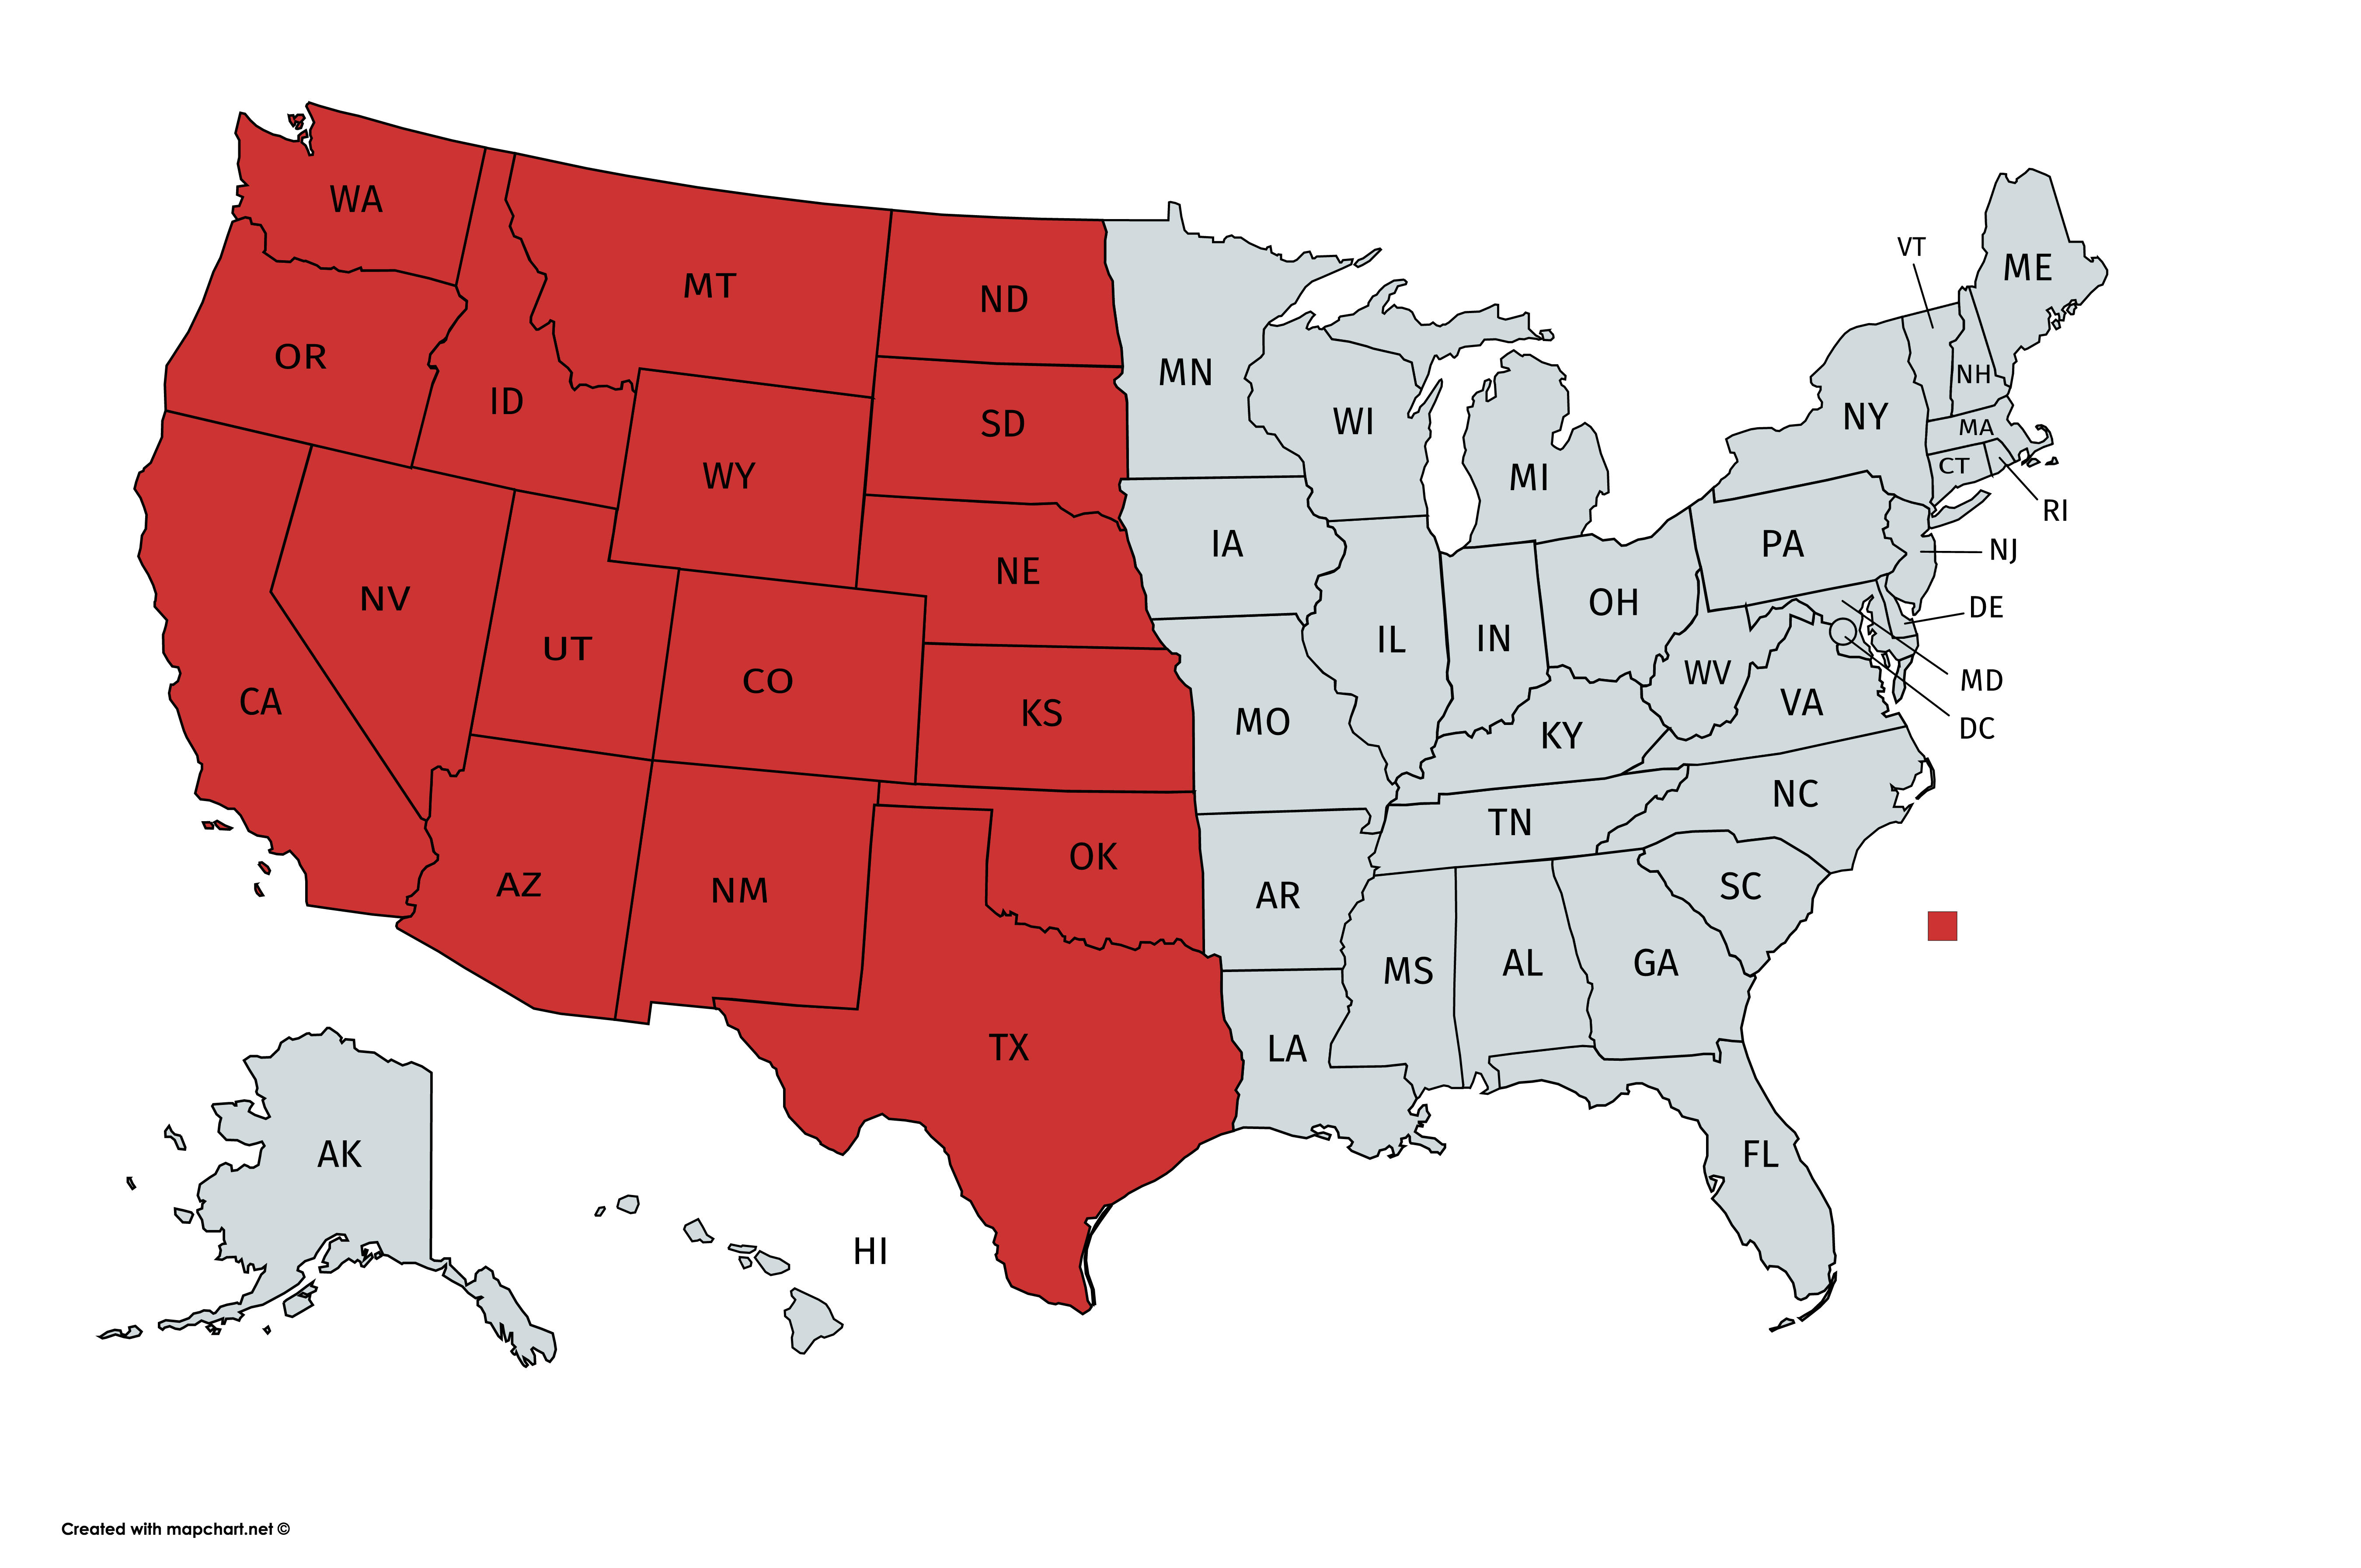
Our analysis will use two separate cohort samples: Eastern and Western Cohorts. Please refer to Figure 1-1. The same data collection strategies will be administered for both cohort samples, stratification, confidence interval and other statistical analysis techniques. The Laboratory for Interdisciplinary Statistical Analysis at the Virginia Polytechnic Institute and State University (Virginia Tech) will work closely with Virginia Tech’s research team (research team) to provide expert statistical analysis.

Figure 1-1: Two Cohort Samples (17 Western and 33 Eastern States)
Generally respondents to this survey will be personnel working for either Federal water facilities or water utilities. These respondents are considered to be the target population for information collection purposes.
According to the survey data, an average of approximately 264 people are served per mile of water main in urban and rural areas of North America. Most Americans – just under 300 million people – receive their drinking water from one of the nation’s 51,356 community water systems. Of these, just 9,213 systems, or 16.8%, serve more than 92% of the total population, or approximately 275.8 million people. Smaller systems that serve the remaining 8.2% of the population frequently lack both economies of scale and financial, managerial, and technical capacity, which can lead to problems of meeting Safe Drinking Water Act standards.
Figure 1-2: Water Systems and Population Served

As noted above, we are interested in collecting data and information from all states related to pipe performance from utilities. Our sample sizes across two-cohorts will be sufficient to allow us to have good representation of performance data. We will send graduate students to key water utilities in each cohort for collection of the required pipe performance data to make the samples representative of population. In each defined cohort we will collect data from largest utilities representing the greatest portion of that region’s population. We will conduct a census survey of all (100%) 426 very large utilities indicated in Figure 1-2 plus 74 of the biggest large utilities based on population served. Smaller utility data will be collected in a parallel qualitative study to determine if they have the data needed for this study.
A data collection effort similar to the one proposed here was conducted in 1994. Questionnaires were mailed out to 839 non-Federal water system managers, asking for information on the types of pipe material, historical performance, failures, soil type, among other things. A total of 276 (of which 162 were used) questionnaires were returned resulting in an overall response rate of 33%.
2. Describe the procedures for the collection of information including:
2a. Statistical methodology for stratification and sample selection
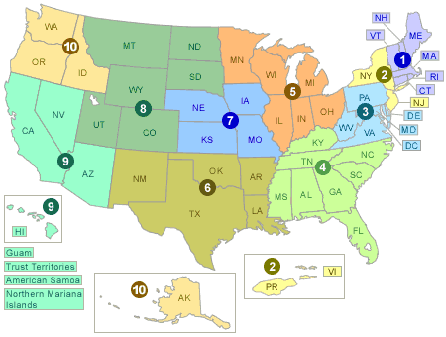
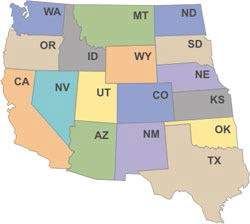
The data will be collected from various water utilities geographically distributed across the U.S. in 10 U.S. Environmental Protection Agency (EPA) regions including the 17 Western States with Bureau of Reclamation (Reclamation) facilities (shown in Figure 2-2). The data will be stratified into two groups before data collection begins: the 17 Western States and the rest of the U.S. This will ensure the data and sample is a true representation of different pipe materials, soils, failures, temperatures, loading conditions, and other factors. As noted above, the same data collection strategies will be administered for both cohort samples, stratification, confidence interval and other statistical analysis techniques.


Figure 2-1: EPA Water Utility Regions and 17 Western States with Reclamation Facilities
In most cases there will be a need to employ a statistical methodology to identify the actual sample size when a survey is determined to be necessary. For the purpose of this information collection, a statistical methodology has been applied to determine the sample size based on a number of parameters. Previous research conducted by the research team has been successful in engaging more than 150 water utilities across the United States. A comprehensive list containing contacts from approximately 300 water utilities was established during that previous research. This contact list continues to be enhanced with the help of agencies and organizations that are part of the Sustainable Water Infrastructure Management Center, such as the Water Environmental Research Foundation, American Water Works Association, State and Local organizations, and various service and technology providers. Because of ongoing efforts with these organizations, the contact list is expected to contain a minimum of 500 water utilities. In addition to these 500 water utilities, Reclamation has approximately 100 Federal- (Reclamation) affiliated facilities that the research team is planning to contact to request data. “Federal facilities” are facilities that were constructed by Reclamation but are now owned and/or operated and maintained by water districts.
The research team will send the survey to 250 utilities in each cohort and will also send it to the 100 Federal facilities (see Column A in Table 2-1). This will ensure the sample to be a true representative of the population in each cohort. The expected response rate for uploading data will be 33% for water utilities, and 50% for Federal facilities based on previous survey results (see Column B in Table 2-1). The expected total response rate will be 36% for this data collection.
Figure 2-2: Number of Utilities and Facilities
Type |
[A] |
[B] |
Number of |
Expected Data |
|
Water Utilities/ |
Upload Respondents |
|
Federal Facilities |
(33% of 1-A & 50% of 2-A) |
|
1-Water Utility |
500 |
165 |
2-Federal Facility |
100 |
50 |
Total |
600 |
215 |
As noted above, the research team is interested in collecting data and information related to pipe performance from various geographically-distributed water utilities from across the United States. Graduate students will be sent to key water utilities in each EPA region to collect the required pipe performance data in an effort to make the samples representative of the population. No specialized estimation procedure is needed because this study is expected to meet the minimum threshold of utilities.
Qualitative Study of Utilities with less than 100,000 people served
This qualitative study of ~100 smaller utilities (100k or fewer people served) will help the research team collect and analyze data separately from larger utilities. It is believed that these smaller utilities will not have the required data to perform rigorous statistical analysis. The research team will develop a contact list of ~5,000 smaller utilities and will randomly select 100 utilities from this list to survey. We will stratify the samples before randomly selecting in order to ensure balance in each stratified group.
2b. Estimation procedure
Power analysis of the minimum number of miles of water pipe based on pipe material in each of the two-cohort samples will be performed to determine degree of confidence. Virginia Tech will establish a 90-95% confidence level as criteria for the decision to pursue Phase II research work to collect missing data from Phase I and analyze all data collected. If Virginia Tech is unable to achieve a 90-95% confidence interval during the Phase I data collection, this project will terminate and will not proceed to data analysis in Phase II. Graduate students will be sent to key water utilities in each cohort for collection of the required pipe performance data to make the samples representative of the population to achieve the established 90-95% confidence level.
2c. Degree of accuracy needed for the purpose described in the justification.
This survey will have a sampling error between ± 5 and 10 percentage points with an overall anticipated response rate of approximately 36%.
2d. Unusual problems requiring specialized sampling procedures.
There are no unusual problems requiring specialized sampling procedures.
2e. Any use of periodic (less frequent than annual) data collection cycles to reduce burden.
The surveys will be sent one time via a link in an email and will not be conducted annually. Reclamation is funding this project as a one-time collection of data and data analysis. Virginia Tech will develop the database and will be responsible for maintenance and periodical updates after the partnership with Reclamation has ended.
3. Describe methods to maximize response rates and to deal with issues of non-response. The accuracy and reliability of information collected must be shown to be adequate for intended uses. For collections based on sampling, a special justification must be provided for any collection that will not yield "reliable" data that can be generalized to the universe studied.
Participation in this survey will be voluntary. Federal personnel who are directly engaged in the experience for which information is being solicited are enthusiastic about the opportunity to render opinions affecting future O&M decisions. Non-Federal respondents will also be engaged because there is value to the water industry in understanding the performance of water infrastructure materials. Virginia Tech has had success in previous attempts at gathering these type of data when the survey and data upload process are user-friendly, which was a key focus of this survey instrument development. Response rates will be maximized through involvement of the participating utility and Federal facility personnel in various stages of the research. Prior to data collection, an advance letter will be sent explaining the purpose of the study to potential respondents (Attachment 1). A half hour web-based introductory meeting with each of the identified potential participants will be held. These introductory meetings will help potential participants to understand the overall objectives of the research, understand the data requirements, data confidentiality and security protocols and, to see the benefits of the collaboration for this research. Respondents will be asked to upload their available pipe data. The instructions for doing this will also be sent via email (Attachment 2), and uploading the available data by the participating utilities should take no more than 150 minutes. Non-responders to the data upload instructions will be sent a follow-up email asking them to reconsider participation and share their data (Attachment 3). The final report will describe the non-response bias as the number of data collection requests that were not completed. We will compare respondent and non-respondent characteristics for statistically significant differences, report these results, and use them to reevaluate data collection effort.
4. Describe any tests of procedures or methods to be undertaken. Testing is encouraged as an effective means of refining collections of information to minimize burden and improve utility. Tests must be approved if they call for answers to identical questions from 10 or more respondents. A proposed test or set of tests may be submitted for approval separately or in combination with the main collection of information.
The data collection methodology has been conducted in previous research by Virginia Tech with high response rates, which led to refinement and simplification of the survey including the focus on pipe performance data mentioned above, reducing the number of choice questions each respondent faces, and other wording changes. These were one-on-one pretests where respondents were interviewed following the testing of the survey. The research team will provide 30-minute WebEx meetings with all utilities to demonstrate the data collection and upload protocols.
5. Provide the names and telephone numbers of individuals consulted on statistical aspects of the design and the name of the agency unit, contractor(s), grantee(s), or other person(s) who will actually collect and/or analyze the information for the agency.
Dr. Sunil Sinha, (Phone: 540-231-9420 and Email: ssinha@vt.edu) will lead the research effort to design the survey protocol, data collection instrument, and statistical design analysis in consultation with the Laboratory for Interdisciplinary Statistical Analysis at Virginia Tech. The Sustainable Water Infrastructure Management data committee formed by various water utilities, service and technology providers delivered insight into current data formats and the anticipated level of effort for completing the survey. Virginia Tech will collect the survey data/information, develop the databases, and then analyze the pipe data to determine the performance of various types of water pipes.
| File Type | application/vnd.openxmlformats-officedocument.wordprocessingml.document |
| File Title | Supporting Statement |
| Author | Sunil Sinha |
| File Modified | 0000-00-00 |
| File Created | 2021-01-25 |
© 2026 OMB.report | Privacy Policy