Analysis of Unit Nonresponse and Undercoverage Bias in the NSCAW II Wave 1
Analysis of Unit Nonresponse and Undercoverage Bias in the NSCAW II Wave 1.docx
National Survey of Child and Adolescent Well-Being Second Cohort (NSCAW II)
Analysis of Unit Nonresponse and Undercoverage Bias in the NSCAW II Wave 1
OMB: 0970-0202
Analysis of Unit Nonresponse and Undercoverage Bias in the NSCAW II Wave 1
An investigation has been conducted in order to provide information on the extent of the bias arising from unit nonresponsethe failure to obtain an interview from a NSCAW II sample member. An estimate of the nonresponse bias is the difference between the sample estimate (based only on respondents) and a version of the sample estimate based upon respondents and nonrespondents. In the NSCAW II, a limited amount of frame information is available for sample children who did not respond to the survey. Thus, it is possible to compare nonrespondents and respondents for some characteristics in order to investigate the potential nonresponse bias in the NSCAW II results. There is also bias in NSCAW II due to frame undercoverage; in particular, unsubstantiated cases were not included on the sampling frame in a few large states, and an adjustment was made to account for this.
In the remainder of this section, we briefly summarize the results of an investigation of the bias in the NSCAW II results due to nonresponse using the data on nonrespondents available from the frame. Unlike NSCAW I, caseworker data was not collected for nonresponding sample members at NSCAW II and therefore caseworker data was not used in this analysis. We also estimated the bias in the results by comparing respondents to the population represented by NCANDS data, to determine if the adjustments were successful in reducing bias due to frame undercoverage.
Three measures were used to examine the impact and magnitude of the nonresponse bias – the bias, the relative bias, and Cohen’s effect size. These measure were examined for a variety of characteristics to see if bias was reduced as a result of the nonresponse adjustments that were made to the weights. Cohen’s effect sizes were also used to examine the magnitude of the nonresponse bias for these same characteristics.
This investigation was conducted in two steps. First, estimates for characteristics available on the sample frame (sampling strata, sampling domain, region, urbanicity, receipt of services, substantiated or unsubstantiated outcome of the case, foster care, child’s age, child’s gender, child’s race, and child’s hispanic origin) were compared for respondents and nonrespondents, using the base weight and the nonresponse adjusted weight to see if the nonresponse adjustment was successful in reducing the bias due to nonresponse for the sample.
Next, estimates for characteristics available for the inferential population of NSCAW II that were obtained from the NCANDS data were compared to weighted NSCAW II estimates using the final coverage adjusted weight to see if the coverage adjustment was successful in reducing the bias due to frame undercoverage. Characteristics used were sampling strata size, urbanicity, and substantiated or unsubstantiated outcome of the case; fewer characteristics were available than for the sample because not all states report all variables to NCANDS.
7.3.2.1 Estimated Bias and Relative Bias
Using the data available from the frame for sample
members at Wave 1, we estimated the bias due to using only the data
for those with a key respondent interview. Let
 denote the true average of the characteristic C based upon
the entire target population; i.e.,
is the average value of C that we would estimate if we
conducted a complete census of the target population. Thus,
is the target parameter that we intend to estimate with
denote the true average of the characteristic C based upon
the entire target population; i.e.,
is the average value of C that we would estimate if we
conducted a complete census of the target population. Thus,
is the target parameter that we intend to estimate with
 .
Then bias in
as an estimate of
is simply the difference between the two, viz.,
.
Then bias in
as an estimate of
is simply the difference between the two, viz.,
 (1)
(1)
The bias can be estimated
as follows. Let
 denote the estimate of the average value of C for the unit
nonrespondents in the sample; i.e.,
is a computed as
but over the nonrespondents in the sample rather than the
respondents. For example, we may have information on the
characteristic C that is measured in the child interview from
the sampling frame. If that is true, then
can be computed. From this, we can form an estimate of
using the following formula:
denote the estimate of the average value of C for the unit
nonrespondents in the sample; i.e.,
is a computed as
but over the nonrespondents in the sample rather than the
respondents. For example, we may have information on the
characteristic C that is measured in the child interview from
the sampling frame. If that is true, then
can be computed. From this, we can form an estimate of
using the following formula:
 (2)
(2)
where
 is the unit nonresponse rate for the interview corresponding to the
characteristic C. Thus, an estimator of the bias in
is obtained by substituting
is the unit nonresponse rate for the interview corresponding to the
characteristic C. Thus, an estimator of the bias in
is obtained by substituting in (2) for
in (1). This results in the following estimator
in (2) for
in (1). This results in the following estimator
 (3)
(3)
or, equivalently,
 (4)
(4)
That is, the estimator of the nonresponse bias for C is equal to the nonresponse rate for the interview that collects C times the difference in the average of C for respondents and nonrespondents.
We estimated these means and their standard errors
using the weights and accounting for the survey design, as described
in Section 7.1. We estimated
using the unadjusted base weight. We estimated the mean for
respondents,
,
in two ways: (1) using the unadjusted base weight, and (2) using the
nonresponse adjusted weight or the final analysis weight. This
allowed us to see if the bias was reduced by applying the nonresponse
and post-stratification adjustments to the weights.
We first tested the null hypothesis that the bias
is 0 with α=0.05, i.e., HO: Bias=0. We used a t-statistic for
the test, and Taylor series linearization to estimate the standard
errors. Variables with fewer than 20 cases in the denominators of
the proportions or means were excluded from the analyses. We examined
the variables with significant bias. The biases, while statistically
significant due to the large NSCAW sample size, were generally small
and not practically significant. For this reason, we also tested a
hypothesis of practical significance. We tested that the relative
bias is small, specifically, we tested the null hypothesis HO:
|Relative Bias|<5 percent, where the relative bias is
calculated as 100*Bias/
.
Exhibit 7-1 shows whether the null hypothesis was rejected at α =0.05, using the base weight. Exhibit 7-2 shows whether the null hypothesis was rejected at α =0.05, using the nonresponse adjusted weight. Variables showing practically significant bias due to nonresponse (compared to the sampling frame) in the NSCAW II sample were sampling domain (foster care less than one year old and no foster care receiving services and less than one year old), children in foster care, child’s age (3 months to 1 year old, and 12 years old to 17.5 years old), and Hispanicity (missing information). After the nonresponse adjustment, none of the variables show practically significant bias compared to the sampling frame.
7.3.2.2 Cohen’s Effect Size
Cohen’s effect size (Cohen, 1988, Section 7.2) was also used as a measure of the magnitude of the bias. For a variable with K categories, Cohen’s effect size (CES) for the variable is computed
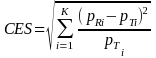
where
 is the estimated proportion of respondents that are in category i,
and
is the estimated proportion of respondents that are in category i,
and
 is the estimated proportion of all sample members that are in
category i.
is the estimated proportion of all sample members that are in
category i.
The effect sizes were computed and examined for the characteristics using the distributions computed with the base weight and the nonresponse adjusted analysis weight. In this analysis, the analysis weights are considered to do an adequate job of reducing the bias due to nonresponse if they reduce the number of significant or large biases in the data.
Following Cohen’s recommendation, the magnitude of the effect for a variable was classified as:
Small, if CES < 0.2
Medium, if 0.2 <= CES <= 0.8, and
Large, if CES > 0.8.
This “rule of thumb” was used to identify survey items for which the biasing effects of nonresponse would be considered medium or large using a well-known standard for such judgments like the CES. However, a shortcoming of this approach is that a bias may be classified as medium or large while the practical implications of the bias may still be small or even trivial. For example, a large bias by the CES scheme may be considered to be practically insignificant if its effect analysis and decision making is unimportant. Likewise, a bias may be classified as small by the CES scheme while its practical implications are quite important for analysis and decision making. In such cases, it may be more relevant to consider the relative bias. We have somewhat arbitrarily used 5 percent or more as the level at which the relative bias may be considered as practically significant.
The results of this analysis are also shown in Exhibit 7-1 and Exhibit 7-2. Using both the base weight and the nonresponse-adjusted weight, all of the characteristics have “small” values of the CES when compared to the sampling frame.
Exhibit 7-3 compares the values for the target population of NSCAW II as obtained from the 2006 and 2007 NCANDS data with the estimates obtained using the NSCAW II base weights, nonresponse adjusted weights, and the final coverage adjusted analysis weights. As described earlier in this chapter, the NSCAW II weights were adjusted to NCANDS totals (adjusted for the observed NSCAW II eligibility) in order to compensate for cases missing from the sampling frame, especially unsubstantiated cases in a few large states. Fewer variables are used in Exhibit 7-3 compared to Exhibit 7-1 and Exhibit 7-2 because many of the states do not report to NCANDS by all of the variables. Exhibit 7-3 shows that the relative bias (compared to the NCANDS distributions) is reduced by the coverage adjustment. Using the base weight and the nonresponse adjusted weight, the bias is statistically significant for the substantiated and unsubstantiated categories, and the absolute relative bias is statistically greater than 5% for the substantiated category when using the base weight. None of the categories have statistically significant bias or absolute relative bias greater than 5% when using the final coverage-adjusted weight. All of the values of Cohen’s effect size are considered small.
The unit nonresponse analysis suggests that the nonresponse and coverage adjustments applied to the analysis weights reduce potential nonresponse bias.
| File Type | application/vnd.openxmlformats-officedocument.wordprocessingml.document |
| Author | Department of Health and Human Services |
| File Modified | 0000-00-00 |
| File Created | 2021-02-01 |
© 2026 OMB.report | Privacy Policy