Form EIA-28 Financial Reporting System
Financial Reporting System
Form EIA-28 v2009.xls
Financial Reporting System
OMB: 1905-0149
⚠️ Notice: This form may be outdated. More recent filings and information on OMB 1905-0149 can be found here:
Document [xlsx]
Download: xlsx | pdf
5100 (1)
5110 (2)
5111 (3)
5112-1 (4)
5112-2 (5)
5112-3 (6)
5120-1 (7)
5120-2 (8)
5120-3 (9)
5120-4 (10)
5120-5 (11)
5131 (12)
5150 (13)
5210-1 (14)
5210-2 (15)
5211-1 (16)
5211-2 (17)
5211-3 (18)
5211-4 (19)
5212-1 (20)
5212-2 (21)
5241-1 (22)
5241-2 (23)
5241-3 (24)
5242 (25)
5245 (26)
5246-1 (27)
5246-2 (28)
5250 (29)
5710-1 (30)
5711-1 (31)
5712-1 (32)
5741-1 (33)
5741-2 (34)
5810-1 (35)
5811-1 (36)
5812-1 (37)
5841-1 (38)
5841-2 (39)


![]()


Overview
Index5100 (1)
5110 (2)
5111 (3)
5112-1 (4)
5112-2 (5)
5112-3 (6)
5120-1 (7)
5120-2 (8)
5120-3 (9)
5120-4 (10)
5120-5 (11)
5131 (12)
5150 (13)
5210-1 (14)
5210-2 (15)
5211-1 (16)
5211-2 (17)
5211-3 (18)
5211-4 (19)
5212-1 (20)
5212-2 (21)
5241-1 (22)
5241-2 (23)
5241-3 (24)
5242 (25)
5245 (26)
5246-1 (27)
5246-2 (28)
5250 (29)
5710-1 (30)
5711-1 (31)
5712-1 (32)
5741-1 (33)
5741-2 (34)
5810-1 (35)
5811-1 (36)
5812-1 (37)
5841-1 (38)
5841-2 (39)
Sheet 1: Index
Sheet 2: 5100 (1)
| EIA-28 Financial Reporting System Sch 5100 -- Page 1 of 1 |
||||||||||||||||||||

|
||||||||||||||||||||

|
||||||||||||||||||||
|
||||||||||||||||||||

|
||||||||||||||||||||
|
||||||||||||||||||||
| - | - | |||||||||||||||||||
| - | - | |||||||||||||||||||
|
||||||||||||||||||||
Sheet 3: 5110 (2)
| EIA-28 Financial Reporting System Sch 5110 -- Page 1 of 1 |
Reporting Company | ||||||||||||||||||||||||||
| Consolidating Statement of Income | |||||||||||||||||||||||||||
| ($000,000) | |||||||||||||||||||||||||||

|
|||||||||||||||||||||||||||
| FRS Line # |
Consolidated |
Eliminations | Nontraceable | Petroleum (sch 5210) |
Other Energy |
Downstream Natural Gas (sch 5710) | Electric Power (sch 5810) | Nonenergy | Foot note |
||||||||||||||||||
| A | B | C | D | E | F | G | H | ||||||||||||||||||||
| Operating Revenues | 01.00 | , , | , , | , , | , , | , , | , , | , , | , , | ||||||||||||||||||
| Operating Expenses: | |||||||||||||||||||||||||||
| General Operating Expenses | 02.00 | , , | , , | , , | , , | , , | , , | , , | , , | ||||||||||||||||||
| DD&A (5120/E) | 03.00 | , , | , , | , , | , , | , , | , , | , , | , , | ||||||||||||||||||
| General & Administrative | 04.00 | , , | , , | , , | , , | , , | , , | , , | , , | ||||||||||||||||||
| Total Operating Expenses | 05.00 | , , | , , | , , | , , | , , | , , | , , | , , | ||||||||||||||||||
| Operating Income | 06.00 | , , | , , | , , | , , | , , | , , | , , | , , | ||||||||||||||||||
| Other Revenue & (Expense): | |||||||||||||||||||||||||||
| Earnings of Unconsolidated Affiliates | 07.00 | , , | , , | , , | , , | , , | , , | , , | , , | ||||||||||||||||||
| Other Dividend & Interest Income | 08.00 | , , | ////////////////// | , , | ////////////////// | ////////////////// | ////////////////// | ////////////////// | ////////////////// | ||||||||||||||||||
| Gain/(Loss) on Disposition of PP&E | 09.00 | , , | , , | , , | , , | , , | , , | , , | , , | ||||||||||||||||||
| Interest Expense & Financial Charges | 10.00 | , , | ////////////////// | , , | ////////////////// | ////////////////// | ////////////////// | ////////////////// | ////////////////// | ||||||||||||||||||
| Minority Interest in Income | 11.00 | , , | ////////////////// | , , | ////////////////// | ////////////////// | ////////////////// | ////////////////// | ////////////////// | ||||||||||||||||||
| Foreign Currency Transaction Gains (Losses) | 12.00 | , , | ////////////////// | , , | ////////////////// | ////////////////// | ////////////////// | ////////////////// | ////////////////// | ||||||||||||||||||
| Other Revenue & (Expense) | 13.00 | , , | ////////////////// | , , | ////////////////// | ////////////////// | ////////////////// | ////////////////// | ////////////////// | ||||||||||||||||||
| Total (Lines 7.00-13.00) | 14.00 | , , | , , | , , | , , | , , | , , | , , | , , | ||||||||||||||||||
| Pre-tax Income (Lines 6 & 14) | 15.00 | , , | , , | , , | , , | , , | , , | , , | , , | ||||||||||||||||||
| Income Tax Expense (5112/19/A) | 16.00 | , , | , , | , , | , , | , , | , , | , , | , , | ||||||||||||||||||
| Income before Lines 18.00 & 19.00 | 17.00 | , , | , , | , , | , , | , , | , , | , , | , , | ||||||||||||||||||
| Discontinued Operations | 18.00 | , , | , , | , , | , , | , , | , , | , , | , , | ||||||||||||||||||
| Extraordinary Items and | |||||||||||||||||||||||||||
| Cumulative Effect of Accounting Changes | 19.00 | , , | , , | , , | , , | , , | , , | , , | , , | ||||||||||||||||||
| Net Income | 20.00 | , , | , , | , , | , , | , , | , , | , , | , , | ||||||||||||||||||
| 5110 | |||||||||||||||||||||||||||
Sheet 4: 5111 (3)
| EIA-28 Financial Reporting System Sch 5111 -- Page 1 of 1 |
Reporting Company | ||||||||||||||||||||
| Research & Development Funding and Expenditures | |||||||||||||||||||||
| ($000,000) | |||||||||||||||||||||
| FRS Line # |
Total | Foot note |
|||||||||||||||||||
| A | |||||||||||||||||||||
| Source of R&D Funds: | |||||||||||||||||||||
| Federal Government | 01.00 | , , | |||||||||||||||||||
| Internal Company | 02.00 | , , | |||||||||||||||||||
| Other Sources | 03.00 | , , | |||||||||||||||||||
| Total Sources | 04.00 | , , | |||||||||||||||||||
| Breakdown of R&D Expenditures: | |||||||||||||||||||||
| Oil & Gas Recovery | 05.00 | , , | |||||||||||||||||||
| Gas to Liquids | 06.00 | , , | |||||||||||||||||||
| Other Petroleum | 07.00 | , , | |||||||||||||||||||
| Coal Gasification/Liquefaction | 08.00 | , , | |||||||||||||||||||
| Other Coal | 09.00 | , , | |||||||||||||||||||
| Downstream Natural Gas | 10.00 | , , | |||||||||||||||||||
| Wind Generation | 11.00 | , , | |||||||||||||||||||
| Solar Generation | 12.00 | , , | |||||||||||||||||||
| Distributed Generation | 13.00 | , , | |||||||||||||||||||
| Fuel Cells | 14.00 | , , | |||||||||||||||||||
| Other Nonconventional Energy | 15.00 | , , | |||||||||||||||||||
| Non-energy | 16.00 | , , | |||||||||||||||||||
| Unassigned | 17.00 | , , | |||||||||||||||||||
| Total | 18.00 | , , | |||||||||||||||||||
Sheet 5: 5112-1 (4)
| EIA-28 Financial Reporting System Sch 5112 -- Page 1 of 3 |
|
|||||||||||||||||

|
||||||||||||||||||
| FRS Line # |
Total | Foot note |
||||||||||||||||
| A | ||||||||||||||||||
| Income Taxes (as per Financial Statements): | ||||||||||||||||||
| Current Paid or Accrued: | ||||||||||||||||||
| U.S. Federal, before Investment Tax Credit and Alternative Minimum Tax (AMT) | 01.00 | , , | ||||||||||||||||
| U.S. Federal Investment Tax Credit | 02.00 | , , | ||||||||||||||||
| Effect of AMT | 03.00 | , , | ||||||||||||||||
| U.S. State & Local Income Taxes | 04.00 | , , | ||||||||||||||||
| Foreign Income Taxes: | ||||||||||||||||||
| Canada | 05.00 | , , | ||||||||||||||||
| Europe | 06.00 | , , | ||||||||||||||||
| Former Soviet Union (FSU) | 06.50 | , , | ||||||||||||||||
| Africa | 07.00 | , , | ||||||||||||||||
| Middle East | 08.00 | , , | ||||||||||||||||
| Other Eastern Hemisphere | 09.00 | , , | ||||||||||||||||
| Other Western Hemisphere | 10.00 | , , | ||||||||||||||||
| Total Foreign | 11.00 | , , | ||||||||||||||||
| Total Current | 12.00 | , , | ||||||||||||||||
| Deferred: | ||||||||||||||||||
| U.S. Federal, before Investment Tax Credit & AMT | 13.00 | , , | ||||||||||||||||
| U.S. Federal Investment Tax Credit | 14.00 | , , | ||||||||||||||||
| Effect of AMT | 15.00 | , , | ||||||||||||||||
| U.S. State & Local Income Taxes | 16.00 | , , | ||||||||||||||||
| Foreign | 17.00 | , , | ||||||||||||||||
| Total Deferred | 18.00 | , , | ||||||||||||||||
| Income Tax Expenses (5110/16/A) | 19.00 | , , | ||||||||||||||||
| Reconciliation of Accrued USFederal Income Tax Expense to Statutory Rate: | ||||||||||||||||||
| Consolidated Pretax Income/(Loss) | 20.00 | , , | ||||||||||||||||
| Less: Foreign Source Income Not Subject to U.S. Tax | 21.00 | , , | ||||||||||||||||
| Equals: Income Subject to U.S. Tax | 22.00 | , , | ||||||||||||||||
| Less: U.S. State & Local Income Taxes | 23.00 | , , | ||||||||||||||||
| Less: Applicable Foreign Income Taxes Deducted | 24.00 | , , | ||||||||||||||||
| Equals: Pretax Income Subject to U.S. Tax | 25.00 | , , | ||||||||||||||||
Sheet 6: 5112-2 (5)
| EIA-28 Financial Reporting System Sch 5112 -- Page 2 of 3 |
|
||||||||||||||||

|
|||||||||||||||||
| FRS Line # |
Total | Foot note |
|||||||||||||||
| A | |||||||||||||||||
| Enter Here the Computed "Expected" | |||||||||||||||||
| Tax Provision Based on Line 25.00 | 26.00 | , , | |||||||||||||||
| Increase/(Decrease) in Taxes Due to : | |||||||||||||||||
| Foreign Tax Credits Recognized | 27.00 | , , | |||||||||||||||
| U.S. Federal Investment Tax Credit Recognized | 28.00 | , , | |||||||||||||||
| Statutory Depletion | 29.00 | , , | |||||||||||||||
| Effect of AMT | 30.00 | , , | |||||||||||||||
| Other | 31.00 | , , | |||||||||||||||
| Actual U.S. Federal Tax Provision/(Refund) | 32.00 | , , | |||||||||||||||
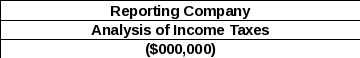
Sheet 7: 5112-3 (6)

|
||||||||||||||||||||
| EIA-28 Financial Reporting System Sch 5112 -- Page 3 of 3 |
||||||||||||||||||||

|
||||||||||||||||||||
| Domestic | ||||||||||||||||||||
| FRS Line # |
Total Domestic |
Petroleum | Other Energy |
Downstream Natural Gas | Electric Power | Nonenergy | Foot note |
|||||||||||||
| A | B | C | D | E | F | |||||||||||||||
| Domestic Taxes Other than Income Taxes: | ||||||||||||||||||||
| Production: | ||||||||||||||||||||
| U.S. Windfall Profits | 33.00 | , , | , , | ////////////////// | ////////////////// | ////////////////// | ////////////////// | |||||||||||||
| Severance Taxes | 34.00 | , , | , , | , , | ////////////////// | ////////////////// | , , | |||||||||||||
| Other Direct Production | 35.00 | , , | , , | , , | ////////////////// | ////////////////// | , , | |||||||||||||
| Total Production | 36.00 | , , | , , | , , | ////////////////// | ////////////////// | , , | |||||||||||||
| Property | 36.50 | , , | , , | , , | , , | , , | , , | |||||||||||||
| Superfund | 37.00 | , , | , , | ////////////////// | , , | , , | , , | |||||||||||||
| Import Duties | 38.00 | , , | ||||||||||||||||||
| Sales and Use | 39.00 | , , | ||||||||||||||||||
| Payroll | 40.00 | , , | ||||||||||||||||||
| Other | 41.00 | , , | ||||||||||||||||||
| Subtotal (33-41) | 42.00 | , , | ||||||||||||||||||
| Collected on Behalf of Governments (Excise) | 43.00 | , , | ||||||||||||||||||
| Total (42 & 43) | 44.00 | , , | ||||||||||||||||||
Sheet 8: 5120-1 (7)
| EIA-28 Financial Reporting System Sch 5120 -- Page 1 of 5 |
|||||||||||||||||

|
|||||||||||||||||
| FRS Line # |
Consolidated | Foot note |
|||||||||||||||
| Current Assets: | A | ||||||||||||||||
| Cash & Marketable Securities | 01.00 | , , | |||||||||||||||
| Trade Accounts & Notes Receivable | 02.00 | , , | |||||||||||||||
| Inventories: | |||||||||||||||||
| Raw Materials & Products | 03.00 | , , | |||||||||||||||
| Materials & Supplies | 04.00 | , , | |||||||||||||||
| Other Current Assets | 05.00 | , , | |||||||||||||||
| Total (Lines 1.00 thru 5.00) | 06.00 | , , | |||||||||||||||
| Non-Current Assets: | |||||||||||||||||
| Property, Plant & Equipment: | |||||||||||||||||
| Gross (5120/99/A) | 07.00 | , , | |||||||||||||||
| Accumulated DD&A (5120/99/B) | 08.00 | , , | |||||||||||||||
| Net (5120/99/C) | 09.00 | , , | |||||||||||||||
| Investments & Advances to Unconsolidated Affiliates (5120/99/G) | 10.00 | , , | |||||||||||||||
| Other Non-Current Assets | 11.00 | , , | |||||||||||||||
| Total (Lines 9.00, 10.00, 11.00) | 12.00 | , , | |||||||||||||||
| Total Assets (Lines 6.00 plus 12.00) | 13.00 | , , | |||||||||||||||
| Current Liabilities: | |||||||||||||||||
| Trade Accounts & Notes Payable | 14.00 | , , | |||||||||||||||
| Other Current Liabilities | 15.00 | , , | |||||||||||||||
| Long-Term Debt | 16.00 | , , | |||||||||||||||
| Deferred Income Tax Credits | 17.00 | , , | |||||||||||||||
| Other Deferred Credits | 18.00 | , , | |||||||||||||||
| Other Long-Term Items | 19.00 | , , | |||||||||||||||
| Minority Interest in Consolidated Affiliates | 20.00 | , , | |||||||||||||||
| Total of Lines 14.00 through 20.00 | 21.00 | , , | |||||||||||||||
| Stockholders' Equity: | |||||||||||||||||
| Retained Earnings | 22.00 | , , | |||||||||||||||
| Other Equity | 23.00 | , , | |||||||||||||||
| Total Stockholders' Equity | 24.00 | , , | |||||||||||||||
| Total of Lines 21.00 and 24.00 | 25.00 | , , | |||||||||||||||
| Memo: | |||||||||||||||||
| Foreign Currency Translation Adjustment Cumulative at Year End | 26.00 | , , | |||||||||||||||
| Foreign Currency Translation Adjustment for the Current Year | 27.00 | , , | |||||||||||||||
Sheet 9: 5120-2 (8)
| EIA-28 Financial Reporting System Sch 5120 -- Page 2 of 5 |
Reporting Company | |||||||||||||||||||||||||
| Selected Consolidating Financial Data | ||||||||||||||||||||||||||
| ($000,000) | ||||||||||||||||||||||||||

|
||||||||||||||||||||||||||
| Property, Plant and Equipment | Investments & Advances to Unconsolidated Affiliates |
|||||||||||||||||||||||||
| Year End Balance | Activity During Year | |||||||||||||||||||||||||
| FRS Line # |
Gross | Accum- ulated DD&A |
Net | Additions | DD&A | Book Value of Disposals |
Other | Year End Balance |
Year's Additions |
Other | Foot note |
|||||||||||||||
| A | B | C | D | E | F | G | H(G) | I(H) | J | |||||||||||||||||
| Non-Energy Industries: | ||||||||||||||||||||||||||
| Foreign Chemical | 28.00 | |||||||||||||||||||||||||
| Domestic Chemical | 29.00 | |||||||||||||||||||||||||
| Foreign Other Non-Energy | 30.00 | |||||||||||||||||||||||||
| Domestic Other Non-Energy | 31.00 | |||||||||||||||||||||||||
| Total Non-Energy | 32.00 | |||||||||||||||||||||||||
| Other Energy: | ||||||||||||||||||||||||||
| Foreign Nonconventional Oil | 33.00 | |||||||||||||||||||||||||
| Domestic Nonconventional Oil | 34.00 | |||||||||||||||||||||||||
| Other Foreign | 36.00 | |||||||||||||||||||||||||
| Other Domestic | 37.00 | |||||||||||||||||||||||||
| Total Other Energy | 38.10 | |||||||||||||||||||||||||
Sheet 10: 5120-3 (9)
| EIA-28 Financial Reporting System Sch 5120 -- Page 3 of 5 |
Reporting Company | |||||||||||||||||||||||||
| Selected Consolidating Financial Data | ||||||||||||||||||||||||||
| ($000,000) | ||||||||||||||||||||||||||

|
||||||||||||||||||||||||||
| Property, Plant and Equipment | Investments & Advances to Unconsolidated Affiliates |
|||||||||||||||||||||||||
| Year End Balance | Activity During Year | |||||||||||||||||||||||||
| FRS Line # |
Gross | Accum- ulated DD&A |
Net | Additions | DD&A | Book Value of Disposals |
Other | Year End Balance |
Year's Additions |
Other | Foot note |
|||||||||||||||
| A | B | C | D | E | F | G | H(G) | I(H) | J | |||||||||||||||||
| Petroleum: | ||||||||||||||||||||||||||
| Domestic Petroleum: | ||||||||||||||||||||||||||
| Production Segment | 39.00 | |||||||||||||||||||||||||
| Refining/Marketing Segment: | ||||||||||||||||||||||||||
| Refining | 40.00 | |||||||||||||||||||||||||
| Marketing | 41.00 | |||||||||||||||||||||||||
| Transportation: | ||||||||||||||||||||||||||
| Pipeline | 42.00 | |||||||||||||||||||||||||
| Marine | 43.00 | |||||||||||||||||||||||||
| Other | 44.00 | |||||||||||||||||||||||||
| Total Refining/Marketing | 45.00 | |||||||||||||||||||||||||
| Rate Regulated Pipeline Segment: | ||||||||||||||||||||||||||
| Refined Products | 46.00 | |||||||||||||||||||||||||
| Natural Gas* | 47.00 | ////////////// | ////////////// | ////////////// | ////////////// | ////////////// | ////////////// | ////////////// | ////////////// | ////////////// | ////////////// | |||||||||||||||
| Crude & Liquids | 48.00 | |||||||||||||||||||||||||
| Total Rate Regulated | 49.00 | |||||||||||||||||||||||||
| Total Domestic Petroleum | 50.00 | |||||||||||||||||||||||||
| Foreign Petroleum: | ||||||||||||||||||||||||||
| Production Segment | 51.00 | |||||||||||||||||||||||||
| Refining/ Marketing Segment | 52.00 | |||||||||||||||||||||||||
| International Marine Segment | 53.00 | |||||||||||||||||||||||||
| Total Foreign Petroleum | 54.00 | |||||||||||||||||||||||||
| Total Petroleum (50 + 54) | 55.00 | |||||||||||||||||||||||||
| * Beginning in 2003, reported on lines 61-64. | ||||||||||||||||||||||||||
Sheet 11: 5120-4 (10)
| EIA-28 Financial Reporting System Sch 5120 -- Page 4 of 5 |
Reporting Company | |||||||||||||||||||||||||
| Selected Consolidating Balance Sheet Data | ||||||||||||||||||||||||||
| ($000,000) | ||||||||||||||||||||||||||

|
||||||||||||||||||||||||||
| Property, Plant and Equipment | Investments & Advances to Unconsolidated Affiliates |
|||||||||||||||||||||||||
| Year End Balance | Activity During Year | |||||||||||||||||||||||||
| Downstream Natural Gas: | FRS Line # |
Gross | Accum- ulated DD&A |
Net | Additions | DD&A | Book Value of Disposals |
Other | Year End Balance |
Year's Additions |
Other | Foot note |
||||||||||||||
| Domestic: | A | B | C | D | E | F | G | H(G) | I(H) | J | ||||||||||||||||
| Processing: | ||||||||||||||||||||||||||
| NGL Production | 56.00 | |||||||||||||||||||||||||
| Other Processing | 57.00 | |||||||||||||||||||||||||
| Total Processing | 59.00 | |||||||||||||||||||||||||
| Marketing/Trading | 60.00 | |||||||||||||||||||||||||
| Transmission/Distribution: | ||||||||||||||||||||||||||
| Transmission | 64.00 | |||||||||||||||||||||||||
| Distribution | 68.00 | |||||||||||||||||||||||||
| Total Transmission/Distribution | 68.10 | |||||||||||||||||||||||||
| Other: | ||||||||||||||||||||||||||
| LNG Liquefaction | 68.20 | |||||||||||||||||||||||||
| LNG Regasification | 68.30 | |||||||||||||||||||||||||
| Other | 68.40 | |||||||||||||||||||||||||
| Total Other Downstream | 68.50 | |||||||||||||||||||||||||
| Total Domestic Downstream | 69.00 | |||||||||||||||||||||||||
| Total Foreign Downstream | 83.00 | |||||||||||||||||||||||||
| Total Downstream Natural Gas | 84.00 | |||||||||||||||||||||||||
Sheet 12: 5120-5 (11)
| EIA-28 Financial Reporting System Sch 5120 -- Page 5 of 5 |
Reporting Company | |||||||||||||||||||||||||
| Selected Consolidating Balance Sheet Data | ||||||||||||||||||||||||||
| ($000,000) | ||||||||||||||||||||||||||
| Property, Plant and Equipment | Investments & Advances to Unconsolidated Affiliates |
|||||||||||||||||||||||||
| Year End Balance | Activity During Year | |||||||||||||||||||||||||
| FRS Line # |
Gross | Accum- ulated DD&A |
Net | Additions | DD&A | Book Value of Disposals |
Other | Year End Balance |
Year's Additions |
Other | Foot note |
|||||||||||||||
| Electric Power: | A | B | C | D | E | F | G | H(G) | I(H) | J | ||||||||||||||||
| Domestic: | ||||||||||||||||||||||||||
| Generation | 87.00 | |||||||||||||||||||||||||
| Marketing/Trading | 88.00 | |||||||||||||||||||||||||
| Transmission/Distribution | 89.00 | |||||||||||||||||||||||||
| Total Domestic | 91.00 | |||||||||||||||||||||||||
| Total Foreign | 96.00 | |||||||||||||||||||||||||
| Total Electric Power | 97.00 | |||||||||||||||||||||||||
| Non-Traceable | 98.00 | |||||||||||||||||||||||||
| Consolidated | 99.00 | |||||||||||||||||||||||||
Sheet 13: 5131 (12)
| EIA-28 Financial Reporting System Sch 5131 -- Page 1 of 1 |

|
|||||||||||||||||

|
||||||||||||||||||
| FRS Line # |
Consolidated | Foot note |
||||||||||||||||
| Cash Flows from Operations: | A | |||||||||||||||||
| Net Income (5110/20/A) | 01.00 | , , | ||||||||||||||||
| Minority Interest in Income | 02.00 | , , | ||||||||||||||||
| Noncash Items: | ||||||||||||||||||
| DD&A (5120/99/E) | 03.00 | , , | ||||||||||||||||
| Dry Hole Expense this Year | 04.00 | , , | ||||||||||||||||
| Deferred Income Taxes (5112/18/A) | 05.00 | , , | ||||||||||||||||
| Recognized Undistributed (Earnings)/Losses of Unconsolidated Affiliates | 06.00 | , , | ||||||||||||||||
| (Gain)/Loss on Disposition of PP&E (5110/09/A) | 07.00 | , , | ||||||||||||||||
| Changes in Operating Assets & Liabilities, and Other | ||||||||||||||||||
| Noncash Items, Excluding Net Change in Short-Term Debt | 08.00 | , , | ||||||||||||||||
| Discontinued Operations, Extraordinary Items, & Effects of Accounting Changes | 09.00 | , , | ||||||||||||||||
| Other Cash Items, Net | 10.00 | , , | ||||||||||||||||
| Cash Flow from Operations | 11.00 | , , | ||||||||||||||||
| Cash Flows from Investing Activities: Additions to PP&E: |
||||||||||||||||||
| Due to Mergers and Acquisitions | 12.00 | , , | ||||||||||||||||
| Other Additions to PP&E | 13.00 | , , | ||||||||||||||||
| Total Additions to PP&E (5120/99/D) | 14.00 | , , | ||||||||||||||||
| Additions to Investments & Advances (5120/99/H) | 15.00 | , , | ||||||||||||||||
| Proceeds from Disposals of PP&E | 16.00 | , , | ||||||||||||||||
| Other Investment Activities, Net | 17.00 | , , | ||||||||||||||||
| Cash Flow from Investing Activities | 18.00 | , , | ||||||||||||||||
| Cash Flows from Financing Activities: | ||||||||||||||||||
| Proceeds from Long-Term Debt | 19.00 | , , | ||||||||||||||||
| Proceeds from Equity Security Offerings | 20.00 | , , | ||||||||||||||||
| Reductions in Long-Term Debt | 21.00 | , , | ||||||||||||||||
| Purchase of Treasury Stock | 22.00 | , , | ||||||||||||||||
| Dividends to Shareholders | 23.00 | , , | ||||||||||||||||
| Other Financing Activities, Including Net Change in Short-Term Debt | 24.00 | , , | ||||||||||||||||
| Cash Flow from Financing Activities | 25.00 | , , | ||||||||||||||||
| Effect of Exchange Rates Changes on Cash | 26.00 | , , | ||||||||||||||||
| Net Increase/(Decrease) in Cash and Cash Equivalents (Lines 11 + 18 + 25 + 26) | 27.00 | , , | ||||||||||||||||
| Memo: | ||||||||||||||||||
| Aggregate of Funds Provided by Disposals of Assets in Single Transactions | ||||||||||||||||||
| Valued in Excess of $50 Million (Exhibit B) | 28.00 | , , | ||||||||||||||||
| Aggregate of Funds Applied to Purchase of Existing Assets in Single Transactions | ||||||||||||||||||
| Valued in Excess of $50 Million (Exhibit B) | 29.00 | , , | ||||||||||||||||
Sheet 14: 5150 (13)
| EIA-28 Financial Reporting System Sch 5150 -- Page 1 of 1 |
Reporting Company | ||||||||||||||||||||
| Eliminations in Consolidation | |||||||||||||||||||||
| ($000,000) | |||||||||||||||||||||

|
|||||||||||||||||||||
| Inter-Lines of Business Sales by: | |||||||||||||||||||||
| FRS Line # |
Total | Non- Traceable |
Petroleum | Other Energy |
Downstream Natural Gas | Electric Power | Nonenergy | Foot note |
|||||||||||||
| A | B | C | D | E | F | G | |||||||||||||||
| Schedule 5110 Inter-Lines of Business Transactions: |
|||||||||||||||||||||
| Inter-Lines of Business Purchases by: | |||||||||||||||||||||
| Non-Traceable | 01.00 | , , | ////////////////// | , , | , , | , , | , , | , , | |||||||||||||
| Petroleum | 02.00 | , , | , , | ////////////////// | , , | , , | , , | , , | |||||||||||||
| Other Energy | 03.00 | , , | , , | , , | ////////////////// | , , | , , | , , | |||||||||||||
| Downstream Natural Gas | 04.00 | , , | , , | , , | , , | ////////////////// | , , | , , | |||||||||||||
| Electric Power | 05.00 | , , | , , | , , | , , | , , | ////////////////// | , , | |||||||||||||
| Non-Energy | 06.00 | , , | , , | , , | , , | , , | , , | ////////////////// | |||||||||||||
| Total (5110/B) | 07.00 | , , | , , | , , | , , | , , | , , | , , | |||||||||||||
Sheet 15: 5210-1 (14)
| EIA-28 Financial Reporting System Sch 5210 -- Page 1 of 2 |
Domestic and Foreign Petroleum Segments | ||||||||||||||||||||
| Consolidating Statement of Income | |||||||||||||||||||||
| ($000,000) | |||||||||||||||||||||

|
|||||||||||||||||||||
| Consolidated | Domestic Petroleum | Consolidated | |||||||||||||||||||
| FRS Line # |
Petroleum (5110) |
Eliminations | Consolidated Domestic |
Eliminations | Production | Refining/ Marketing |
Pipelines | Foreign Petroleum |
Foot note |
||||||||||||
| A | B | C | D | E | F | G | H | ||||||||||||||
| Operating Revenues: | |||||||||||||||||||||
| Raw Material Sales | 01.00 | , , | , , | , , | , , | , , | , , | , , | , , | ||||||||||||
| Refined Products Sales | 02.00 | , , | , , | , , | , , | , , | , , | , , | , , | ||||||||||||
| Transportation Revenues | 03.00 | , , | , , | , , | , , | , , | , , | , , | , , | ||||||||||||
| Hedging/Derivatives | 03.50 | , , | , , | , , | , , | , , | , , | , , | , , | ||||||||||||
| Management and Processing Fees | 04.00 | , , | , , | , , | , , | , , | , , | , , | , , | ||||||||||||
| Other | 05.00 | , , | , , | , , | , , | , , | , , | , , | , , | ||||||||||||
| Total Operating Revenues | 06.00 | , , | , , | , , | , , | , , | , , | , , | , , | ||||||||||||
| Operating Expenses: | |||||||||||||||||||||
| General Operating Expenses | 07.00 | , , | , , | , , | , , | , , | , , | , , | , , | ||||||||||||
| DD&A (5120/E) | 08.00 | , , | , , | , , | , , | , , | , , | , , | , , | ||||||||||||
| General & Administrative | 09.00 | , , | , , | , , | , , | , , | , , | , , | , , | ||||||||||||
| Total Operating Expenses | 10.00 | , , | , , | , , | , , | , , | , , | , , | , , | ||||||||||||
| Operating Income | 11.00 | , , | , , | , , | , , | , , | , , | , , | , , | ||||||||||||
| Other Revenue & (Expense): | |||||||||||||||||||||
| Earning of Unconsolidated Affiliates | 12.00 | , , | , , | , , | , , | , , | , , | , , | , , | ||||||||||||
| Gain/(Loss) on Disposition of PP&E | 13.00 | , , | , , | , , | , , | , , | , , | , , | , , | ||||||||||||
| Sub-Total | 14.00 | , , | , , | , , | , , | , , | , , | , , | , , | ||||||||||||
| Pre-tax Income (Lines 11 & 14) | 15.00 | , , | , , | , , | , , | , , | , , | , , | , , | ||||||||||||
| Income Tax Expense | 16.00 | , , | , , | , , | , , | , , | , , | , , | , , | ||||||||||||
| Income before Lines 1800 & 1900 | 17.00 | , , | , , | , , | , , | , , | , , | , , | , , | ||||||||||||
| Discontinued Operations | 18.00 | , , | , , | , , | , , | , , | , , | , , | , , | ||||||||||||
| Extraordinary Items and | |||||||||||||||||||||
| Cumulative Effect of Accounting Changes | 19.00 | , , | , , | , , | , , | , , | , , | , , | , , | ||||||||||||
| Contribution to Net Income | 20.00 | , , | , , | , , | , , | , , | , , | , , | , , | ||||||||||||
Sheet 16: 5210-2 (15)
| EIA-28 Financial Reporting System Sch 5210 -- Page 2 of 2 |
Domestic and Foreign Petroleum Segments | ||||||||||||||||||||
| Consolidating Statement of Income | |||||||||||||||||||||
| ($000,000) | |||||||||||||||||||||

|
|||||||||||||||||||||
| Foreign Petroleum | |||||||||||||||||||||
| FRS Line # |
Consolidated | Eliminations | Production | Refining/ Marketing |
International Marine |
Foot note |
|||||||||||||||
| H | I | J | K | L | |||||||||||||||||
| Operating Revenues: | |||||||||||||||||||||
| Raw Material Sales | 01.00 | , , | , , | , , | , , | , , | |||||||||||||||
| Refined Products Sales | 02.00 | , , | , , | , , | , , | , , | |||||||||||||||
| Transportation Revenues | 03.00 | , , | , , | , , | , , | , , | |||||||||||||||
| Hedging/Derivatives | 03.50 | , , | , , | , , | , , | , , | |||||||||||||||
| Management and Processing Fees | 04.00 | , , | , , | , , | , , | , , | |||||||||||||||
| Other | 05.00 | , , | , , | , , | , , | , , | |||||||||||||||
| Total Operating Revenues | 06.00 | , , | , , | , , | , , | , , | |||||||||||||||
| Operating Expenses: | |||||||||||||||||||||
| General Operating Expenses | 07.00 | , , | , , | , , | , , | , , | |||||||||||||||
| DD&A (5120/E) | 08.00 | , , | , , | , , | , , | , , | |||||||||||||||
| General & Administrative | 09.00 | , , | , , | , , | , , | , , | |||||||||||||||
| Total Operating Expenses | 10.00 | , , | , , | , , | , , | , , | |||||||||||||||
| Operating Income | 11.00 | , , | , , | , , | , , | , , | |||||||||||||||
| Other Revenue & (Expense): | |||||||||||||||||||||
| Earning of Unconsolidated Affiliates | 12.00 | , , | , , | , , | , , | , , | |||||||||||||||
| Gain/(Loss) on Disposition of PP&E | 13.00 | , , | , , | , , | , , | , , | |||||||||||||||
| Sub-Total | 14.00 | , , | , , | , , | , , | , , | |||||||||||||||
| Pre-tax Income (Lines 11 & 14) | 15.00 | , , | , , | , , | , , | , , | |||||||||||||||
| Income Tax Expense | 16.00 | , , | , , | , , | , , | , , | |||||||||||||||
| Income before Lines 1800 & 1900 | 17.00 | , , | , , | , , | , , | , , | |||||||||||||||
| Discontinued Operations | 18.00 | , , | , , | , , | , , | , , | |||||||||||||||
| Extraordinary Items and | |||||||||||||||||||||
| Cumulative Effect of Accounting Changes | 19.00 | , , | , , | , , | , , | , , | |||||||||||||||
| Contribution to Net Income | 20.00 | , , | , , | , , | , , | , , | |||||||||||||||
Sheet 17: 5211-1 (16)
| EIA-28 Financial Reporting System Sch 5211 -- Page 1 of 4 |
||||||||||||||||||||
| FRS Line # |
Total Domestic |
Total Foreign |
Foot note |
|||||||||||||||||
| B | E | |||||||||||||||||||
| Raw Material Supply: | ||||||||||||||||||||
| Raw Material Purchases (5212/04/B) | 01.00 | , , | , , | |||||||||||||||||
| Other Raw Material Supply Expense | 02.00 | , , | , , | |||||||||||||||||
| Total Raw Material Supply Expense | 03.00 | , , | , , | |||||||||||||||||
| Less: Cost of Raw Materials Input to Refining | 04.00 | , , | , , | |||||||||||||||||
| Net Raw Material Supply (03 minus 04) | 05.00 | , , | , , | |||||||||||||||||
| Refining: | ||||||||||||||||||||
| Raw Materials Input to Refining (04) | 06.00 | , , | , , | |||||||||||||||||
| Less: Raw Material Used as Refinery Fuel | 07.00 | , , | , , | |||||||||||||||||
| Refinery Process Energy Expense | 08.00 | , , | , , | |||||||||||||||||
| Other Refining Operating Expenses | 09.00 | , , | , , | |||||||||||||||||
| Refined Product Purchases (5212/08/B) | 10.00 | , , | , , | |||||||||||||||||
| Other Refined Product Supply Expenses | 11.00 | , , | , , | |||||||||||||||||
| Total (06-11) | 12.00 | , , | , , | |||||||||||||||||
| Marketing: | ||||||||||||||||||||
| Cost of Other Products Sold | 13.00 | , , | , , | |||||||||||||||||
| Other Marketing Expenses | 14.00 | , , | , , | |||||||||||||||||
| Total (13 + 14) | 15.00 | , , | , , | |||||||||||||||||
| Expense of Transport Services for Others | 16.00 | , , | , , | |||||||||||||||||
| Total (15 + 16) | 17.00 | , , | , , | |||||||||||||||||
| Total Domestic Refining/Marketing Segment | ||||||||||||||||||||
General Operating Expenses (05, 12 & 17) (521007F) |
18.00 | , , | , , | |||||||||||||||||
Sheet 18: 5211-2 (17)
| EIA-28 Financial Reporting System Sch 5211 -- Page 2 of 4 |
Domestic and Foreign Petroleum Segments | |||||||||||||||||||||
| Production Segment | ||||||||||||||||||||||
| Expenditure and Operating Expense Detail | ||||||||||||||||||||||
| ($000,000) | ||||||||||||||||||||||

|
||||||||||||||||||||||
| FRS | Domestic | Total | Foot | |||||||||||||||||||
| Line # | Worldwide | Total | Onshore | Offshore | Foreign | note | ||||||||||||||||
| A | B | C | D | E | ||||||||||||||||||
| Property Acquisition Costs: | ||||||||||||||||||||||
| Unproved Acreage | 19.00 | , , | , , | , , | , , | , , | ||||||||||||||||
| Proved Acreage | 20.00 | , , | , , | , , | , , | , , | ||||||||||||||||
| Total Acquisition Costs | 21.00 | , , | , , | , , | , , | , , | ||||||||||||||||
| Exploration Costs: | ||||||||||||||||||||||
| Drilling & Equipping of Wells: | ||||||||||||||||||||||
| Completed Well Costs | 24.50 | ///////////////// | , , | , , | , , | ///////////////// | ||||||||||||||||
| Work-in-Progress Adjustment | 25.00 | ///////////////// | , , | , , | , , | ///////////////// | ||||||||||||||||
| This Year's Expenditures | 26.00 | , , | , , | , , | , , | , , | ||||||||||||||||
| Geological & Geophysical | 27.00 | , , | , , | , , | , , | , , | ||||||||||||||||
| Other, Including Direct Overhead | 28.00 | , , | , , | , , | , , | , , | ||||||||||||||||
| Total Exploration (26, 27 & 28) | 29.00 | , , | , , | , , | , , | , , | ||||||||||||||||
| Development Costs: | ||||||||||||||||||||||
| Drilling & Equipping of Wells: | ||||||||||||||||||||||
| Completed Well Costs | 32.50 | ///////////////// | , , | , , | , , | ///////////////// | ||||||||||||||||
| Work-in-Progress Adjustment | 33.00 | ///////////////// | , , | , , | , , | ///////////////// | ||||||||||||||||
| This Year's Expenditures | 34.00 | , , | , , | , , | , , | , , | ||||||||||||||||
| Other, Including Direct Overhead | 36.00 | , , | , , | , , | , , | , , | ||||||||||||||||
| Total Development (34, 35 & 36) | 37.00 | , , | , , | , , | , , | , , | ||||||||||||||||
| Subtotal (21, 29, & 37) | 38.00 | , , | , , | , , | , , | , , | ||||||||||||||||
Sheet 19: 5211-3 (18)
| EIA-28 Financial Reporting System Sch 5211 -- Page 3 of 4 |
Domestic and Foreign Petroleum Segments | ||||||||||||||||||||
| Production Segment | |||||||||||||||||||||
| Expenditure and Operating Expense Detail | |||||||||||||||||||||
| ($000,000) | |||||||||||||||||||||

|
|||||||||||||||||||||
| FRS | Domestic | Total | Foot | ||||||||||||||||||
| Line # | Worldwide | Total | Onshore | Offshore | Foreign | note | |||||||||||||||
| A | B | C | D | E | |||||||||||||||||
| Production (Lifting) Costs: | |||||||||||||||||||||
| Royalty Expenses | 39.00 | ///////////////// | ///////////////// | ///////////////// | ///////////////// | , , | |||||||||||||||
| Taxes other than Income Taxes | 40.00 | ///////////////// | , , | ///////////////// | ///////////////// | , , | |||||||||||||||
| Other | 41.00 | ///////////////// | , , | ///////////////// | ///////////////// | , , | |||||||||||||||
| Total Production Costs | 42.00 | , , | , , | , , | , , | , , | |||||||||||||||
| Total costs Incurred | 43.00 | , , | , , | , , | , , | , , | |||||||||||||||
| Memo: Support Equipment and Facilities: |
|||||||||||||||||||||
| Depreciation | 44.00 | , , | , , | , , | , , | , , | |||||||||||||||
| New Investment | 45.00 | , , | , , | , , | , , | , , | |||||||||||||||
Sheet 20: 5211-4 (19)
| EIA-28 Financial Reporting System Sch 5211 -- Page 4 of 4 |
Domestic and Foreign Petroleum Segments | ||||||||||||||||||||
| Production Segment | |||||||||||||||||||||
| Expenditure and Operating Expense Detail | |||||||||||||||||||||
| ($000,000) | |||||||||||||||||||||
| FRS Line # |
Total Foreign |
Canada | Europe | Former Soviet Union |
Africa | Middle East |
Other Eastern Hemisphere |
Other Western Hemisphere |
Foot note |
||||||||||||
| E | F | G | H | I | J | K | L | ||||||||||||||
| Property Acquisition Costs: | |||||||||||||||||||||
| Unproved Acreage | 19.00 | , , | , , | , , | , , | , , | , , | , , | , , | ||||||||||||
| Proved Acreage | 20.00 | , , | , , | , , | , , | , , | , , | , , | , , | ||||||||||||
| Total Acquisition Costs | 21.00 | , , | , , | , , | , , | , , | , , | , , | , , | ||||||||||||
| Exploration Costs | 29.00 | , , | , , | , , | , , | , , | , , | , , | , , | ||||||||||||
| Development Costs | 37.00 | , , | , , | , , | , , | , , | , , | , , | , , | ||||||||||||
| Subtotal (21, 29, & 37) | 38.00 | , , | , , | , , | , , | , , | , , | , , | , , | ||||||||||||
| Production (Lifting) Costs: | |||||||||||||||||||||
| Royalty Expenses | 39.00 | , , | , , | , , | , , | , , | , , | , , | , , | ||||||||||||
| Taxes other than Income Taxes | 40.00 | , , | , , | , , | , , | , , | , , | , , | , , | ||||||||||||
| Other | 41.00 | , , | , , | , , | , , | , , | , , | , , | , , | ||||||||||||
| Total Production Costs | 42.00 | , , | , , | , , | , , | , , | , , | , , | , , | ||||||||||||
| Total costs Incurred | 43.00 | , , | , , | , , | , , | , , | , , | , , | , , | ||||||||||||
| Memo: Support Equipment and Facilities: |
|||||||||||||||||||||
Depreciation |
44.00 | , , | , , | , , | , , | , , | , , | , , | , , | ||||||||||||
| New Investment | 45.00 | , , | , , | , , | , , | , , | , , | , , | , , | ||||||||||||
Sheet 21: 5212-1 (20)
|
|||||||||||||||||||||
| EIA-28 Financial Reporting System Sch 5212 -- Page 1 of 2 |
|||||||||||||||||||||

|
|||||||||||||||||||||
| Foreign | |||||||||||||||||||||
| FRS | Purchases | Sales | Purchases | Sales | Foot | ||||||||||||||||
| Line # | Volume | Value | Volume | Value | Volume | Value | Volume | Value | note | ||||||||||||
| A | B | C | D | E | F | G | H | ||||||||||||||
| Domestic Refining/Marketing Segment: | |||||||||||||||||||||
| Raw Materials: | |||||||||||||||||||||
| Crude Oil & NGL's (5245) | 01.00 | , , | , , | , , | , , | , , | , , | , , | , , | ||||||||||||
| Natural Gas | 02.00 | , , | , , | ///////////////// | ///////////////// | , , | , , | /////////////// | ///////////// | ||||||||||||
| Other Raw Materials | 03.00 | ///////////////// | , , | ///////////////// | , , | ///////////////// | , , | /////////////// | , , | ||||||||||||
| Total | 04.00 | ///////////////// | , , | ///////////////// | , , | ///////////////// | , , | /////////////// | , , | ||||||||||||
| Refined Products: | |||||||||||||||||||||
| Motor Gasoline | 05.00 | , , | , , | , , | , , | , , | , , | , , | , , | ||||||||||||
| Distillate Fuels | 06.00 | , , | , , | , , | , , | , , | , , | , , | , , | ||||||||||||
| Other Refined (Including Residual) | 07.00 | , , | , , | , , | , , | , , | , , | , , | , , | ||||||||||||
| Total (05-07) (5212/18/A) | 08.00 | , , | , , | , , | , , | , , | , , | , , | , , | ||||||||||||
| Domestic Production Segment Purchases and Sales of: | |||||||||||||||||||||
| Crude Oil & NGL'S | 09.00 | , , | , , | , , | , , | , , | , , | , , | , , | ||||||||||||
| Natural Gas | 10.00 | , , | , , | , , | , , | , , | , , | , , | , , | ||||||||||||
| Total (09 & 10) | 11.00 | ///////////////// | , , | ///////////////// | , , | ///////////////// | , , | ///////////////// | , , | ||||||||||||
Sheet 22: 5212-2 (21)
|
|||||||||||||||||||||
| EIA-28 Financial Reporting System Sch 5212 -- Page 2 of 2 |
|||||||||||||||||||||

|
|||||||||||||||||||||
| No. of | |||||||||||||||||||||
| Active | |||||||||||||||||||||
| FRS | Total | Motor Gasoline | Distillate Fuels | Other Refined | Outlets | Foot | |||||||||||||||
| Line # | Value | Volume | Value | Volume | Value | Volume | Value | @ Year End | note | ||||||||||||
| A | B | C | D | E | F | G | H | ||||||||||||||
| Domestic Dispositions: | |||||||||||||||||||||
| Intersegment Sales | 12.00 | , , | , , | , , | , , | , , | , , | , , | |||||||||||||
| Domestic Third-Party Sales: | |||||||||||||||||||||
| Wholesale Resellers | 13.00 | ///////////////// | , , | , , | ///////////////// | ///////////////// | ///////////////// | ///////////////// | |||||||||||||
| Company-Operated Automotive Outlets | 14.00 | ///////////////// | , , | , , | ///////////////// | ///////////////// | ///////////////// | ///////////////// | |||||||||||||
| Company Lessee & Open Automotive Outlets | 15.00 | ///////////////// | , , | , , | ///////////////// | ///////////////// | ///////////////// | ///////////////// | |||||||||||||
| Other (Industrial, Commercial & Other Retail) | 16.00 | ///////////////// | , , | , , | ///////////////// | ///////////////// | ///////////////// | ///////////////// | |||||||||||||
| Total Third-Party Sales | 17.00 | , , | , , | , , | , , | , , | , , | , , | |||||||||||||
| Total (5210/02/F) | 18.00 | , , | , , | , , | , , | , , | , , | , , | |||||||||||||
| Number of Active Automotive Outlets at Year End: | |||||||||||||||||||||
| Company Operated | 19.00 | ///////////////// | ///////////////// | ///////////////// | ///////////////// | ///////////////// | ///////////////// | ///////////////// | , , | ||||||||||||
| Lessee Dealers | 20.00 | ///////////////// | ///////////////// | ///////////////// | ///////////////// | ///////////////// | ///////////////// | ///////////////// | , , | ||||||||||||
| Open Dealers | 21.00 | ///////////////// | ///////////////// | ///////////////// | ///////////////// | ///////////////// | ///////////////// | ///////////////// | , , | ||||||||||||
Sheet 23: 5241-1 (22)

|
|||||||||||||||||||||
| EIA-28 Financial Reporting System Sch 5241 -- Page 1 of 3 |
|||||||||||||||||||||

|
|||||||||||||||||||||
| Domestic | |||||||||||||||||||||
| FRS Line # |
Worldwide | Total | Onshore | Offshore | Total Foreign |
Foot note |
|||||||||||||||
| A | B | C | D | E | |||||||||||||||||
| Total Acreage (M Acres): | |||||||||||||||||||||
| Gross Acreage: | |||||||||||||||||||||
| Developed | 01.00 | , , | , , | , , | , , | , , | |||||||||||||||
| Undeveloped | 02.00 | , , | , , | , , | , , | , , | |||||||||||||||
| Net Acreage: | |||||||||||||||||||||
| Developed | 03.00 | , , | , , | , , | , , | , , | |||||||||||||||
| Undeveloped | 04.00 | , , | , , | , , | , , | , , | |||||||||||||||
| Number of Wells Completed During Period: | |||||||||||||||||||||
| Net Exploratory Wells: | |||||||||||||||||||||
| Dry Holes | 05.00 | , , . | , , . | , , . | , , . | , , . | |||||||||||||||
| Oil Wells | 06.00 | , , . | , , . | , , . | , , . | , , . | |||||||||||||||
| Gas Wells | 07.00 | , , . | , , . | , , . | , , . | , , . | |||||||||||||||
| Total | 08.00 | , , . | , , . | , , . | , , . | , , . | |||||||||||||||
| Net Development Wells: | |||||||||||||||||||||
| Dry Holes | 09.00 | , , . | , , . | , , . | , , . | , , . | |||||||||||||||
| Oil Wells | 10.00 | , , . | , , . | , , . | , , . | , , . | |||||||||||||||
| Gas Wells | 11.00 | , , . | , , . | , , . | , , . | , , . | |||||||||||||||
| Total | 12.00 | , , . | , , . | , , . | , , . | , , . | |||||||||||||||
| Number of Wells at Period-End: | |||||||||||||||||||||
| Net In-Progress Wells: | |||||||||||||||||||||
| Exploratory Wells | 13.00 | , , . | , , . | , , . | , , . | , , . | |||||||||||||||
| Development Wells | 14.00 | , , . | , , . | , , . | , , . | , , . | |||||||||||||||
| Total | 15.00 | , , . | , , . | , , . | , , . | , , . | |||||||||||||||
| Net Producing Wells: | |||||||||||||||||||||
| Oil Wells | 16.00 | , , . | , , . | , , . | , , . | , , . | |||||||||||||||
| Gas Wells | 17.00 | , , . | , , . | , , . | , , . | , , . | |||||||||||||||
| Total | 18.00 | , , . | , , . | , , . | , , . | , , . | |||||||||||||||
Sheet 24: 5241-2 (23)
|
||||||||||||||||||||||
| EIA-28 Financial Reporting System Sch 5241 -- Page 2 of 3 |
||||||||||||||||||||||

|
||||||||||||||||||||||
| Foreign | ||||||||||||||||||||||
| FRS Line # |
Total | Canada | Europe | Former Soviet Union |
Africa | Middle East |
Other Eastern Hemisphere |
Other Western Hemisphere |
Foot note |
|||||||||||||
| E | F | G | H | I | J | K | L | |||||||||||||||
| Number of Wells Completed During Period: | ||||||||||||||||||||||
| Net Exploratory Wells: | ||||||||||||||||||||||
| Dry Holes | 05.00 | , . | , . | , . | , . | , . | , . | , . | , . | |||||||||||||
| Oil Wells | 06.00 | , . | , . | , . | , . | , . | , . | , . | , . | |||||||||||||
| Gas Wells | 07.00 | , . | , . | , . | , . | , . | , . | , . | , . | |||||||||||||
| Total | 08.00 | , . | , . | , . | , . | , . | , . | , . | , . | |||||||||||||
| Net Development Wells: | ||||||||||||||||||||||
| Dry Holes | 09.00 | , . | , . | , . | , . | , . | , . | , . | , . | |||||||||||||
| Oil Wells | 10.00 | , . | , . | , . | , . | , . | , . | , . | , . | |||||||||||||
| Gas Wells | 11.00 | , . | , . | , . | , . | , . | , . | , . | , . | |||||||||||||
| Total | 12.00 | , . | , . | , . | , . | , . | , . | , . | , . | |||||||||||||
| Number of Wells at Period-End: | ||||||||||||||||||||||
| Net In-Progress Wells: | ||||||||||||||||||||||
| Exploratory Wells | 13.00 | , . | , . | , . | , . | , . | , . | , . | , . | |||||||||||||
| Development Wells | 14.00 | , . | , . | , . | , . | , . | , . | , . | , . | |||||||||||||
| Total | 15.00 | , . | , . | , . | , . | , . | , . | , . | , . | |||||||||||||
| Net Producing Wells: | ||||||||||||||||||||||
| Oil Wells | 16.00 | , . | , . | , . | , . | , . | , . | , . | , . | |||||||||||||
| Gas Wells | 17.00 | , . | , . | , . | , . | , . | , . | , . | , . | |||||||||||||
| Total | 18.00 | , . | , . | , . | , . | , . | , . | , . | , . | |||||||||||||
Sheet 25: 5241-3 (24)
|
||||||||||||||||||
| EIA-28 Financial Reporting System Sch 5241 -- Page 3 of 3 |
||||||||||||||||||

|
||||||||||||||||||
| Domestic | ||||||||||||||||||
| FRS Line # |
Total | Onshore | Offshore | Foot note |
||||||||||||||
| A | B | C | ||||||||||||||||
| Cumulative Net Drilling Footage for Wells Completed this Year: |
||||||||||||||||||
| Exploratory Well Footage: | ||||||||||||||||||
| Dry Hole Footage | 19.00 | , , | , , | , , | ||||||||||||||
| Oil Well Footage | 20.00 | , , | , , | , , | ||||||||||||||
| Gas Well Footage | 21.00 | , , | , , | , , | ||||||||||||||
| Total Exploratory Footage (19-21) | 22.00 | , , | , , | , , | ||||||||||||||
| Development Well Footage: | ||||||||||||||||||
| Dry Hole Footage | 23.00 | , , | , , | , , | ||||||||||||||
| Oil Well Footage | 24.00 | , , | , , | , , | ||||||||||||||
| Gas Well Footage | 25.00 | , , | , , | , , | ||||||||||||||
| Total Development Footage (23-25) | 26.00 | , , | , , | , , | ||||||||||||||
Sheet 26: 5242 (25)
| EIA-28 Financial Reporting System Sch 5242 -- Page 1 of 1 |
||||||||||||||||||
| FRS Line # |
World- Wide |
Domestic | Foreign | Foot note |
||||||||||||||
| A | B | C | ||||||||||||||||
| Number of Refineries: | ||||||||||||||||||
| Wholly Owned | 01.00 | , | , | , | ||||||||||||||
| Partially Owned | 02.00 | , | , | , | ||||||||||||||
| At Own Refineries | ||||||||||||||||||
| Gross Input to Distillation (M bbls/day): | 03.00 | , | , | , | ||||||||||||||
| Other Refinery Inputs (Mbbls/day) | 03.50 | , | , | , | ||||||||||||||
| Total Input at Refineries of Others (Mbbls/day) | 04.00 | , | , | , | ||||||||||||||
| Total | 05.00 | , | , | , | ||||||||||||||
| Refinery Output: | ||||||||||||||||||
| At Own Refineries (M bbls/day): | ||||||||||||||||||
| Motor Gasoline: | ||||||||||||||||||
| Reformulated | 05.50 | ///////////// | , | ///////////// | ||||||||||||||
| Oxygenated | 06.50 | ///////////// | , | ///////////// | ||||||||||||||
| Other | 07.50 | ///////////// | , | ///////////// | ||||||||||||||
| Total | 08.00 | , | , | , | ||||||||||||||
| Distillate Fuels | 09.00 | , | , | , | ||||||||||||||
| Other Refined Products | 10.00 | , | , | , | ||||||||||||||
| Petroleum Consumed by the Refineries | 10.50 | , | , | , | ||||||||||||||
| Total (08-10) | 11.00 | , | , | , | ||||||||||||||
| At Refineries of Others (M bbls/day): | ||||||||||||||||||
| Motor Gasoline: | ||||||||||||||||||
| Reformulated | 11.50 | ///////////// | , | ///////////// | ||||||||||||||
| Oxygenated | 12.50 | ///////////// | , | ///////////// | ||||||||||||||
| Other | 13.50 | ///////////// | , | ///////////// | ||||||||||||||
| Total | 14.00 | , | , | , | ||||||||||||||
| Distillate Fuels | 15.00 | , | , | , | ||||||||||||||
| Other Refined Products | 16.00 | , | , | , | ||||||||||||||
| Total (14-16) | 17.00 | , | , | , | ||||||||||||||
| Total Refinery Output (11 & 17) | 18.00 | , | , | , | ||||||||||||||
| Capacity -- Barrels per Calendar Day Basis (M bbls/day): | ||||||||||||||||||
| Capacity at Beginning of Period | 19.00 | , | , | , | ||||||||||||||
| Purchases of Existing Refineries | 20.00 | , | , | , | ||||||||||||||
| Sales of Refinery Capacity | 21.00 | , | , | , | ||||||||||||||
| Other Net Capacity Changes | 22.00 | , | , | , | ||||||||||||||
| Capacity at End of Period (19-22) | 23.00 | , | , | , | ||||||||||||||
Sheet 27: 5245 (26)

|
|||||||||||||||||||
| EIA-28 Financial Reporting System Sch 5245 -- Page 1 of 1 |
|||||||||||||||||||

|
|||||||||||||||||||
| FRS Line # |
World- Wide |
Domestic | Foreign | Foot note |
|||||||||||||||
| A | B | C | |||||||||||||||||
| Sources (M Barrels): | |||||||||||||||||||
| Acquisitions from Production Segment* | 01.00 | , , | , , | , , | |||||||||||||||
| Purchases: | |||||||||||||||||||
| Other Segments | 02.00 | , , | , , | , , | |||||||||||||||
| Unconsolidated Affiliates | 03.00 | , , | , , | , , | |||||||||||||||
| Unaffiliated Third Parties: | |||||||||||||||||||
| Foreign Access | 04.00 | , , | , , | , , | |||||||||||||||
| Foreign Governments (Open Market) | 05.00 | , , | , , | , , | |||||||||||||||
| Other Unaffiliated Third Parties | 06.00 | , , | , , | , , | |||||||||||||||
| Total (04-06) | 07.00 | , , | , , | , , | |||||||||||||||
| Transfers between Columns B & C | 08.00 | , -0- , | , , | , , | |||||||||||||||
| Total Available (01-03, 07 & 08) Equals 15 Below) | 09.00 | , , | , , | , , | |||||||||||||||
| Dispositions (M Barrels): | |||||||||||||||||||
| Net Change in Inventories | 10.00 | , , | , , | , , | |||||||||||||||
| Input to Refineries (Value @ 5211/04) | 11.00 | , , | , , | , , | |||||||||||||||
| Sold to: | |||||||||||||||||||
| Unaffilated Third Parties | 12.00 | , , | , , | , , | |||||||||||||||
| Other Segments (e.g., Chemical) | |||||||||||||||||||
| (Excluding Items on 08 Above) | 13.00 | , , | , , | , , | |||||||||||||||
| Total Sold (Value @ 5211/05) | 14.00 | , , | , , | , , | |||||||||||||||
| Total (10, 11 & 14) (Equals 09 Above) | 15.00 | , , | , , | , , | |||||||||||||||
| Refined Product Transfers Between | |||||||||||||||||||
| Columns B & C (M Barrels) | 16.00 | , -0- , | , , | , , | |||||||||||||||
| *Should approximate production on 5246. | |||||||||||||||||||
Sheet 28: 5246-1 (27)
|
||||||||||||||||||
| EIA-28 Financial Reporting System Sch 5246 -- Page 1 of 2 |
||||||||||||||||||
| Domestic | ||||||||||||||||||
| FRS Line # |
Total | Onshore | Offshore | Foot note |
||||||||||||||
| A | B | C | ||||||||||||||||
| Crude & Natural Gas Liquids (M Barrels): | ||||||||||||||||||
| Net Ownership Interest Reserves: | ||||||||||||||||||
| Beginning of Period | 01.00 | , , | , , | , , | ||||||||||||||
| Revisions of Previous Estimates | 02.00 | , , | , , | , , | ||||||||||||||
| Improved Recovery | 03.00 | , , | , , | , , | ||||||||||||||
| Purchases of Minerals-in-Place | 04.00 | , , | , , | , , | ||||||||||||||
| Extensions & Discoveries | 05.00 | , , | , , | , , | ||||||||||||||
| Production of Crude Oil | 05.50 | , , | , , | , , | ||||||||||||||
| Production of Natural Gas Liquids (NGLs) | 05.60 | , , | , , | , , | ||||||||||||||
| Production of Crude Oil and NGLs | 06.00 | , , | , , | , , | ||||||||||||||
| Sales of Minerals-in-Place | 07.00 | , , | , , | , , | ||||||||||||||
| End of Period | 08.00 | , , | , , | , , | ||||||||||||||
| Proportionate Interest in Investee Reserves | 09.00 | , , | , , | , , | ||||||||||||||
| Foreign Access Reserves | 10.00 | ///////////////// | ///////////////// | ///////////////// | ||||||||||||||
| Foreign Access Production | 11.00 | ///////////////// | ///////////////// | ///////////////// | ||||||||||||||
| Natural Gas (MMCF): | ||||||||||||||||||
| Net Ownership Interest Reserves: | ||||||||||||||||||
| Beginning of Period | 12.00 | , , | , , | , , | ||||||||||||||
| Revisions of Previous Estimates | 13.00 | , , | , , | , , | ||||||||||||||
| Improved Recovery | 14.00 | , , | , , | , , | ||||||||||||||
| Purchases of Minerals-in-Place | 15.00 | , , | , , | , , | ||||||||||||||
| Extensions & Discoveries | 16.00 | , , | , , | , , | ||||||||||||||
| Production | 17.00 | , , | , , | , , | ||||||||||||||
| Sales of Minerals-in-Place | 18.00 | , , | , , | , , | ||||||||||||||
| End of Period | 19.00 | , , | , , | , , | ||||||||||||||
| Proportionate Interest in Investee Reserves | 20.00 | , , | , , | , , | ||||||||||||||
| Foreign Access Reserves | 21.00 | ///////////////// | ///////////////// | ///////////////// | ||||||||||||||
| Foreign Access Production | 22.00 | ///////////////// | ///////////////// | ///////////////// | ||||||||||||||
Sheet 29: 5246-2 (28)
|
|
|||||||||||||||||||||
| EIA-28 Financial Reporting System Sch 5246 -- Page 2 of 2 |
|||||||||||||||||||||
| Foreign | |||||||||||||||||||||
| FRS Line # |
Total | Canada | Europe | FSU | Africa | Middle East |
Other E. Hemisphere |
Other W. Hemisphere |
Foot note |
||||||||||||
| D | E | F | G | H | I | J | K | ||||||||||||||
| Crude & Natural Gas Liquids (M Barrels): | |||||||||||||||||||||
| Net Ownership Interest Reserves: | |||||||||||||||||||||
| Beginning of Period | 01.00 | , , | , , | , , | , , | , , | , , | , , | , , | ||||||||||||
| Revisions of Previous Estimates | 02.00 | , , | , , | , , | , , | , , | , , | , , | , , | ||||||||||||
| Improved Recovery | 03.00 | , , | , , | , , | , , | , , | , , | , , | , , | ||||||||||||
| Purchases of Minerals-in-Place | 04.00 | , , | , , | , , | , , | , , | , , | , , | , , | ||||||||||||
| Extensions & Discoveries | 05.00 | , , | , , | , , | , , | , , | , , | , , | , , | ||||||||||||
| Production of Crude Oil | 05.50 | , , | , , | , , | , , | , , | , , | , , | , , | ||||||||||||
| Production of Natural Gas Liquids (NGLs) | 05.60 | , , | , , | , , | , , | , , | , , | , , | , , | ||||||||||||
| Production of Crude Oil and NGLs | 06.00 | , , | , , | , , | , , | , , | , , | , , | , , | ||||||||||||
| Sales of Minerals-in-Place | 07.00 | , , | , , | , , | , , | , , | , , | , , | , , | ||||||||||||
| End of Period | 08.00 | , , | , , | , , | , , | , , | , , | , , | , , | ||||||||||||
| Proportionate Interest in Investee Reserves | 09.00 | , , | , , | , , | , , | , , | , , | , , | , , | ||||||||||||
| Foreign Access Reserves | 10.00 | , , | , , | , , | , , | , , | , , | , , | , , | ||||||||||||
| Foreign Access Production | 11.00 | , , | , , | , , | , , | , , | , , | , , | , , | ||||||||||||
| Natural Gas (MMCF): | |||||||||||||||||||||
| Net Ownership Interest Reserves: | |||||||||||||||||||||
| Beginning of Period | 12.00 | , , | , , | , , | , , | , , | , , | , , | , , | ||||||||||||
| Revisions of Previous Estimates | 13.00 | , , | , , | , , | , , | , , | , , | , , | , , | ||||||||||||
| Improved Recovery | 14.00 | , , | , , | , , | , , | , , | , , | , , | , , | ||||||||||||
| Purchases of Minerals-in-Place | 15.00 | , , | , , | , , | , , | , , | , , | , , | , , | ||||||||||||
| Extensions & Discoveries | 16.00 | , , | , , | , , | , , | , , | , , | , , | , , | ||||||||||||
| Production | 17.00 | , , | , , | , , | , , | , , | , , | , , | , , | ||||||||||||
| Sales of Minerals-in-Place | 18.00 | , , | , , | , , | , , | , , | , , | , , | , , | ||||||||||||
| End of Period | 19.00 | , , | , , | , , | , , | , , | , , | , , | , , | ||||||||||||
| Proportionate Interest in Investee Reserves | 20.00 | , , | , , | , , | , , | , , | , , | , , | , , | ||||||||||||
| Foreign Access Reserves | 21.00 | , , | , , | , , | , , | , , | , , | , , | , , | ||||||||||||
| Foreign Access Production | 22.00 | , , | , , | , , | , , | , , | , , | , , | , , | ||||||||||||
Sheet 30: 5250 (29)
| EIA-28 Financial Reporting System Sch 5250 -- Page 1 of 1 |
Domestic and Foreign Petroleum Segments | ||||||||||||||||||||
| Eliminations in Consolidation | |||||||||||||||||||||
| ($000,000) | |||||||||||||||||||||

|
|||||||||||||||||||||
| Domestic Petroleum | Foreign Petroleum | ||||||||||||||||||||
| FRS Line # |
Total (B-D) |
Production | Refining/ Marketing |
Pipeline | Total (F-H) |
Production | Refining/ Marketing |
International Marine |
Foot note |
||||||||||||
| A | B | C | D | E | F | G | H | ||||||||||||||
| Schedule 5210 Petroleum Intersegment Transactions: |
|||||||||||||||||||||
| Intersegment Purchases by: | |||||||||||||||||||||
| Domestic Production Segment Purchases from | 01.00 | , , | ////////////////// | , , | , , | ////////////////// | ////////////////// | ////////////////// | ////////////////// | ||||||||||||
| Domestic Refining/Marketing Segment Purchases from | 02.00 | , , | , , | ////////////////// | , , | , , | , , | , , | , , | ||||||||||||
| Domestic Pipeline Segment Purchases from | 03.00 | , , | , , | , , | ////////////////// | ////////////////// | ////////////////// | ////////////////// | ////////////////// | ||||||||||||
| Total | 04.00 | , , | , , | , , | , , | , , | , , | , , | , , | ||||||||||||
| Foreign Production Segment Purchases from | 05.00 | , , | ////////////////// | , , | ////////////////// | , , | ////////////////// | , , | , , | ||||||||||||
| Foreign Refining/Marketing Segment Purchases from | 06.00 | , , | ////////////////// | , , | ////////////////// | , , | , , | ////////////////// | , , | ||||||||||||
| International Marine Segment Purchases from | 07.00 | , , | ////////////////// | , , | ////////////////// | , , | , , | , , | ////////////////// | ||||||||||||
| Total | 08.00 | , , | ////////////////// | , , | ////////////////// | , , | , , | , , | , , | ||||||||||||
| Memo: Petroleum/Chemical Transactions: | |||||||||||||||||||||
| Domestic Chemical Segment Purchases from | 09.00 | , , | , , | , , | , , | , , | , , | , , | , , | ||||||||||||
| Foreign Chemical Segment Purchases from | 10.00 | , , | , , | , , | , , | , , | , , | , , | , , | ||||||||||||
| Domestic Chemical Segment Sales to | 11.00 | , , | , , | , , | , , | , , | , , | , , | , , | ||||||||||||
| Foreign Chemical Segment Sales to | 12.00 | , , | , , | , , | , , | , , | , , | , , | , , | ||||||||||||
Sheet 31: 5710-1 (30)
| EIA-28 Financial Reporting System Sch 5710 -- Page 1 of 1 |
Domestic and Foreign Downstream Natural Gas Segments | ||||||||||||||||||||||||
| Consolidating Statement of Income | |||||||||||||||||||||||||
| ($000,000) | |||||||||||||||||||||||||

|
|||||||||||||||||||||||||
| Consolidated | Domestic Downstream Natural Gas | ||||||||||||||||||||||||
| FRS Line # |
Natural Gas (5110) |
Eliminations | Consolidated | Eliminations | Processing | Marketing/ Trading | Transmission /Distribution |
Other (LNG, GTL) |
Consolidated Foreign | Foot note |
|||||||||||||||
| A | B | C | D | E | F | G | H | I | |||||||||||||||||
| Operating Revenues | |||||||||||||||||||||||||
| Natural Gas Sales | 01.00 | , , | , , | , , | , , | , , | , , | ////////////////// | , , | , , | |||||||||||||||
| LNG Sales | 01.50 | , , | , , | , , | , , | , , | , , | ////////////////// | , , | , , | |||||||||||||||
| NGL Sales | 02.00 | , , | , , | , , | , , | , , | , , | ////////////////// | , , | , , | |||||||||||||||
| Transportation Sales | 03.00 | , , | , , | , , | , , | , , | , , | , , | , , | , , | |||||||||||||||
| Other Product Sales | 04.00 | , , | , , | , , | , , | , , | , , | , , | , , | , , | |||||||||||||||
| Hedging/ Derivatives | 05.00 | , , | , , | , , | , , | ////////////////// | , , | ////////////////// | ////////////////// | , , | |||||||||||||||
| Management & Processing Fees | 06.00 | , , | , , | , , | , , | , , | , , | , , | , , | , , | |||||||||||||||
| Other Revenues | 07.00 | , , | , , | , , | , , | , , | , , | , , | , , | , , | |||||||||||||||
| Total Operating Revenues | 08.00 | , , | , , | , , | , , | , , | , , | , , | , , | , , | |||||||||||||||
| Operating Expenses: | |||||||||||||||||||||||||
| General Operating Expenses | 09.00 | , , | , , | , , | , , | , , | , , | , , | |||||||||||||||||
| DD&A | 10.00 | , , | , , | , , | , , | , , | , , | , , | , , | , , | |||||||||||||||
| General & Administrative | 11.00 | , , | , , | , , | , , | , , | , , | , , | , , | , , | |||||||||||||||
| Total Operating Expenses | 12.00 | , , | , , | , , | , , | , , | , , | , , | , , | , , | |||||||||||||||
| Operating Income | 13.00 | , , | , , | , , | , , | , , | , , | , , | , , | , , | |||||||||||||||
| Other Revenue & (Expense): | |||||||||||||||||||||||||
| Earning of Unconsolidated Affiliates | 14.00 | , , | , , | , , | , , | , , | , , | , , | , , | , , | |||||||||||||||
| Gain/(Loss) on Disposition of PP&E | 15.00 | , , | , , | , , | , , | , , | , , | , , | , , | , , | |||||||||||||||
| Sub-Total | 16.00 | , , | , , | , , | , , | , , | , , | , , | , , | , , | |||||||||||||||
| Pre-tax Income (Lines 13 & 16) | 17.00 | , , | , , | , , | , , | , , | , , | , , | , , | , , | |||||||||||||||
| Income Tax Expense | 18.00 | , , | , , | , , | , , | , , | , , | , , | , , | , , | |||||||||||||||
| Income before Lines 2000 & 2100 | 19.00 | , , | , , | , , | , , | , , | , , | , , | , , | , , | |||||||||||||||
| Discontinued Operations | 20.00 | , , | , , | , , | , , | , , | , , | , , | , , | , , | |||||||||||||||
| Extraordinary Items and Cumulative | |||||||||||||||||||||||||
| Effect of Accounting Changes | 21.00 | , , | , , | , , | , , | , , | , , | , , | , , | , , | |||||||||||||||
| Contribution to Net Income | 22.00 | , , | , , | , , | , , | , , | , , | , , | , , | , , | |||||||||||||||
Sheet 32: 5711-1 (31)
| EIA-28 Financial Reporting System Sch 5711 -- Page 1 of 1 |
Domestic Downstream Natural Gas Segments | ||||||||||||||||||||
| General Operating Expense Detail | |||||||||||||||||||||
| ($000,000) | |||||||||||||||||||||

|
|||||||||||||||||||||
| FRS | |||||||||||||||||||||
| Line # | Domestic | Foreign | foot note |
||||||||||||||||||
| A | B | ||||||||||||||||||||
| Processing: | |||||||||||||||||||||
| NGL Production Costs: | |||||||||||||||||||||
| Natural Gas Purchased | 01.00 | , , | , , | ||||||||||||||||||
| NGLs Purchased | 02.00 | , , | , , | ||||||||||||||||||
| less: Raw Material Used as Plant Fuel | 03.00 | , , | , , | ||||||||||||||||||
| Plant Energy Expense | 04.00 | , , | , , | ||||||||||||||||||
| Storage and Other Supply Expense | 05.00 | , , | , , | ||||||||||||||||||
| Other Plant Operating Expense | 06.00 | , , | , , | ||||||||||||||||||
| Other Processing Expense | 07.00 | , , | , , | ||||||||||||||||||
| Total Processing (5710/09/E) | 09.00 | , , | , , | ||||||||||||||||||
| Marketing/Trading Costs: | |||||||||||||||||||||
| Natural Gas Purchased | 10.00 | , , | , , | ||||||||||||||||||
| LNG Purchased | 10.50 | , , | , , | ||||||||||||||||||
| NGLs Purchased | 11.00 | , , | , , | ||||||||||||||||||
| Other Trading Expense | 12.00 | , , | , , | ||||||||||||||||||
| Total Trading (5710/09/F) | 13.00 | , , | , , | ||||||||||||||||||
| Transmission/Distribution Costs: | |||||||||||||||||||||
| Natural Gas Purchased | 18.00 | , , | , , | ||||||||||||||||||
| LNG Purchased | 18.50 | , , | , , | ||||||||||||||||||
| NGLs Purchased | 19.00 | , , | , , | ||||||||||||||||||
| Transportation | 20.00 | , , | , , | ||||||||||||||||||
| Storage | 21.00 | , , | , , | ||||||||||||||||||
| Other Transmission/Distribution Expense | 22.00 | , , | , , | ||||||||||||||||||
| Total Transmission/Distribution (5710/09/G) | 23.00 | , , | , , | ||||||||||||||||||
| Other Costs: | |||||||||||||||||||||
| Total LNG Liquefaction Expenses | 24.00 | , , | , , | ||||||||||||||||||
| Total LNG Regasification Expenses | 25.00 | , , | , , | ||||||||||||||||||
| Other Expenses | 26.00 | , , | , , | ||||||||||||||||||
| Total Other Expenses (5710/9/H) | 27.00 | , , | , , | ||||||||||||||||||
Sheet 33: 5712-1 (32)
| EIA-28 Financial Reporting System Sch 5712 -- Page 1 of 1 |
Downstream Natural Gas Segments | |||||||||||||||||||||||||
| Purchases and Sales of Natural Gas and NGLs | ||||||||||||||||||||||||||
| ($000,000, MMcf, & M Barrels) | ||||||||||||||||||||||||||
| FRS | Domestic | Foreign | ||||||||||||||||||||||||
| Line # | Volume | Value | Volume | Value | foot note |
|||||||||||||||||||||
| A | B | C | D | |||||||||||||||||||||||
| Purchases: | ||||||||||||||||||||||||||
| Natural Gas: | ||||||||||||||||||||||||||
| Transfers from Production* | 01.00 | , , | , , | , , | , , | |||||||||||||||||||||
| Transfers between Foreign and Domestic | 02.00 | , , | , , | , , | , , | |||||||||||||||||||||
| Third-party Purchases | 03.00 | , , | , , | , , | , , | |||||||||||||||||||||
| Total Natural Gas Purchases (lines 1 through 3, 5711/1+10+18/A) | 04.00 | , , | , , | , , | , , | |||||||||||||||||||||
| LNG: | ||||||||||||||||||||||||||
| Transfers between Foreign and Domestic | 05.00 | , , | , , | , , | , , | |||||||||||||||||||||
| Third-party Purchases | 06.00 | , , | , , | , , | , , | |||||||||||||||||||||
| Total LNG Purchases (lines 5 and 6, 5711/1.5+10.5+18.5/A) | 07.00 | , , | , , | , , | , , | |||||||||||||||||||||
| Natural Gas Liquids: | ||||||||||||||||||||||||||
| Transfers from Production | 08.00 | , , | , , | , , | , , | |||||||||||||||||||||
| Transfers between Foreign and Domestic | 09.00 | , , | , , | , , | , , | |||||||||||||||||||||
| Third-party Purchases | 10.00 | , , | , , | , , | , , | |||||||||||||||||||||
| Total NGL Purchases (lines 8 through 10, 5711/2+11+19/A) | 11.00 | , , | , , | , , | , , | |||||||||||||||||||||
| Sales: | ||||||||||||||||||||||||||
| Natural Gas: | ||||||||||||||||||||||||||
| Intersegment | 12.00 | , , | , , | , , | , , | |||||||||||||||||||||
| Third-party: | ||||||||||||||||||||||||||
| Wholesale/Resellers | 13.00 | , , | , , | , , | , , | |||||||||||||||||||||
| End Users | 14.00 | , , | , , | , , | , , | |||||||||||||||||||||
| Total Third Party | 15.00 | , , | , , | , , | , , | |||||||||||||||||||||
| Total Natural Gas Sales (lines 12 + 15, 5710/1) | 16.00 | , , | , , | , , | , , | |||||||||||||||||||||
| LNG: | ||||||||||||||||||||||||||
| Intersegment | 17.00 | , , | , , | , , | , , | |||||||||||||||||||||
| Third-party: | ||||||||||||||||||||||||||
| Wholesale/Resellers | 18.00 | , , | , , | , , | , , | |||||||||||||||||||||
| End Users | 19.00 | , , | , , | , , | , , | |||||||||||||||||||||
| Total Third Party | 20.00 | , , | , , | , , | , , | |||||||||||||||||||||
| Total LNG Sales (lines 17 + 20, 5710/1.5) | 21.00 | , , | , , | , , | , , | |||||||||||||||||||||
| Natural Gas Liquids: | ||||||||||||||||||||||||||
| Intersegment | 22.00 | , , | , , | , , | , , | |||||||||||||||||||||
| Third-party: | ||||||||||||||||||||||||||
| Wholesale/Resellers | 23.00 | , , | , , | , , | , , | |||||||||||||||||||||
| End Users | 24.00 | , , | , , | , , | , , | |||||||||||||||||||||
| Total Third Party | 25.00 | , , | , , | , , | , , | |||||||||||||||||||||
| Total NGL Sales (lines 22 + 25, 5710/2) | 26.00 | , , | , , | , , | , , | |||||||||||||||||||||
| *5712/1/A should approximate 5246/17/A and 5712/1/C should approximate 5246/17/D. | ||||||||||||||||||||||||||
Sheet 34: 5741-1 (33)
| EIA-28 Financial Reporting System Sch 5741 -- Page 1 of 2 |
Domestic and Foreign Downstream Natural Gas Segments | |||||||||||||||||||||||||
| Capacity and Output Statistics | ||||||||||||||||||||||||||
| (MMcf/d, MMcf, Mb/d, Mb, Miles) | ||||||||||||||||||||||||||
| End of Year | ||||||||||||||||||||||||||
| FRS Line # |
Worldwide | Domestic | Foreign | Foot note |
||||||||||||||||||||||
| A | B | C | ||||||||||||||||||||||||
| Processing: | ||||||||||||||||||||||||||
| Processing Capacity (MMcf/d) | 01.00 | , , | , , | , , | ||||||||||||||||||||||
| Number of Processing Plants | 02.00 | , , | , , | , , | ||||||||||||||||||||||
| Natural Gas Treatment Capacity (MMcf/d) | 03.00 | , , | , , | , , | ||||||||||||||||||||||
| Number of Treatment Plants | 04.00 | , , | , , | , , | ||||||||||||||||||||||
| Natural Gas Storage Capacity (MMcf) | 04.50 | , , | , , | , , | ||||||||||||||||||||||
| NGL Storage Capacity (Mb) | 04.60 | , , | , , | , , | ||||||||||||||||||||||
| LNG Facilities: | ||||||||||||||||||||||||||
| LNG Liquefaction Capacity (MMcf/d) | 05.00 | , , | , , | , , | ||||||||||||||||||||||
| LNG Regasification Capacity (MMcf/d) | 05.50 | , , | , , | , , | ||||||||||||||||||||||
| Storage (MMcf) | 06.00 | , , | , , | , , | ||||||||||||||||||||||
| Natural Gas Transmission/Distribution: | ||||||||||||||||||||||||||
| Transmission Line Miles | 07.00 | , , | , , | , , | ||||||||||||||||||||||
| Working Gas Storage (MMcf) | 08.00 | , , | , , | , , | ||||||||||||||||||||||
| Base Gas Storage (MMcf) | 09.00 | , , | , , | , , | ||||||||||||||||||||||
| NGL/LPG Pipelines: | ||||||||||||||||||||||||||
| Line Miles | 13.00 | , , | , , | , , | ||||||||||||||||||||||
| Storage Capacity (Mb) | 14.00 | , , | , , | , , | ||||||||||||||||||||||
Sheet 35: 5741-2 (34)
| EIA-28 Financial Reporting System Sch 5741 -- Page 2 of 2 |
Domestic and Foreign Downstream Natural Gas Segments | |||||||||||||||||||
| Capacity and Output Statistics | ||||||||||||||||||||
| (MMcf/d, MMcf, Mb/d, Mb, Miles) | ||||||||||||||||||||

|
||||||||||||||||||||
| Foot note |
||||||||||||||||||||
| A | B | C | ||||||||||||||||||
| Processing: | ||||||||||||||||||||
| Total NGL Production (Mb/d) | 15.00 | , , | , , | , , | ||||||||||||||||
| Natural Gas Processed at Own Processing Plants (MMcf/d) | 17.00 | , , | , , | , , | ||||||||||||||||
| Natural Gas Processed by Others for Company Account (MMcf/d) | 17.50 | , , | , , | , , | ||||||||||||||||
| LNG Facilities: | ||||||||||||||||||||
| LNG Production (MMcf/d) | 18.00 | , , | , , | , , | ||||||||||||||||
| LNG Regasified (MMcf/d) | 19.00 | , , | , , | , , | ||||||||||||||||
| Natural Gas Transmission/Distribution: | ||||||||||||||||||||
| Transmission Throughput (MMcf/d) (7 and 8) | 21.00 | , , | , , | , , | ||||||||||||||||
| Distribution Throughput (MMcf/d) | 24.00 | , , | , , | , , | ||||||||||||||||
Sheet 36: 5810-1 (35)
| EIA-28 Financial Reporting System Sch 5810 -- Page 1 of 1 |
Domestic and Foreign Electric Power Segments | |||||||||||||||||||||||||
| Consolidating Statement of Income | ||||||||||||||||||||||||||
| ($000,000) | ||||||||||||||||||||||||||

|
||||||||||||||||||||||||||
| Consolidated | Domestic Electric Power | |||||||||||||||||||||||||
| FRS Line # |
Total (5110) |
Eliminations | Consolidated Domestic | Domestic Eliminations | Generation | Marketing/ Trading | Transmission and Distribution | Consolidated Foreign |
Foot note |
|||||||||||||||||
| A | B | C | D | E | F | H | I | |||||||||||||||||||
| Operating Revenues: | ||||||||||||||||||||||||||
| Power Sales | 01.00 | , , | , , | , , | , , | , , | , , | , , | , , | |||||||||||||||||
| Transportation Sales | 02.00 | , , | , , | , , | , , | ////////////////// | , , | , , | , , | |||||||||||||||||
| Other Product Sales | 03.00 | , , | , , | , , | , , | ////////////////// | , , | , , | , , | |||||||||||||||||
| Hedging / Derivatives | 04.00 | , , | , , | , , | , , | ////////////////// | , , | ////////////////// | , , | |||||||||||||||||
| Other Revenues | 05.00 | , , | , , | , , | , , | , , | , , | , , | , , | |||||||||||||||||
| Total Operating Revenues | 06.00 | , , | , , | , , | , , | , , | , , | , , | , , | |||||||||||||||||
| Operating Expenses: | ||||||||||||||||||||||||||
| General Operating Expenses | 07.00 | , , | , , | , , | , , | , , | , , | , , | , , | |||||||||||||||||
| DD&A | 08.00 | , , | , , | , , | , , | , , | , , | , , | , , | |||||||||||||||||
| General & Administrative | 09.00 | , , | , , | , , | , , | , , | , , | , , | , , | |||||||||||||||||
| Total Operating Expenses | 10.00 | , , | , , | , , | , , | , , | , , | , , | , , | |||||||||||||||||
| Operating Income | 11.00 | , , | , , | , , | , , | , , | , , | , , | , , | |||||||||||||||||
| Other Revenue & (Expense): | ||||||||||||||||||||||||||
| Earning of Unconsolidated Affiliates | 12.00 | , , | , , | , , | , , | , , | , , | , , | , , | |||||||||||||||||
| Gain/(Loss) on Disposition of PP&E | 13.00 | , , | , , | , , | , , | , , | , , | , , | , , | |||||||||||||||||
| Sub-Total | 14.00 | , , | , , | , , | , , | , , | , , | , , | , , | |||||||||||||||||
| Pre-tax Income (Lines 11 & 14) | 15.00 | , , | , , | , , | , , | , , | , , | , , | , , | |||||||||||||||||
| Income Tax Expense | 16.00 | , , | , , | , , | , , | , , | , , | , , | , , | |||||||||||||||||
| Income before Lines 18.00 & 19.00 | 17.00 | , , | , , | , , | , , | , , | , , | , , | , , | |||||||||||||||||
| Discontinued Operations | 18.00 | , , | , , | , , | , , | , , | , , | , , | , , | |||||||||||||||||
| Extraordinary Items and Cumulative | ||||||||||||||||||||||||||
| Effect of Accounting Changes | 19.00 | , , | , , | , , | , , | , , | , , | , , | , , | |||||||||||||||||
| Contribution to Net Income | 20.00 | , , | , , | , , | , , | , , | , , | , , | , , | |||||||||||||||||
Sheet 37: 5811-1 (36)
| EIA-28 Financial Reporting System Sch 5811 -- Page 1 of 1 |
Domestic Electric Power Segments | ||||||||||||||||||||||||
| General Operating Expense Detail | |||||||||||||||||||||||||
| ($000,000) | |||||||||||||||||||||||||

|
|||||||||||||||||||||||||
| Domestic | |||||||||||||||||||||||||
| FRS Line # |
Total | Foot note |
|||||||||||||||||||||||
| Domestic: | A | ||||||||||||||||||||||||
| Generation Expense: | |||||||||||||||||||||||||
| Fuel Cost: | |||||||||||||||||||||||||
| Cost of Fuel Purchased (5812/6/B) | 01.00 | , , | |||||||||||||||||||||||
| Transportation and Handling | 02.00 | , , | |||||||||||||||||||||||
| Other Fuel Cost | 03.00 | , , | |||||||||||||||||||||||
| Total Fuel Cost | 04.00 | , , | |||||||||||||||||||||||
| Other General Operating Expense | 05.00 | , , | |||||||||||||||||||||||
| Total General Operating Expense (5810/ 7 /E) | 06.00 | , , | |||||||||||||||||||||||
| Marketing/Trading Expense*: | |||||||||||||||||||||||||
| Purchased Power | 07.00 | , , | |||||||||||||||||||||||
| Other Expense | 08.00 | , , | |||||||||||||||||||||||
| Total General Operating Expense (5810/ 7/F) | 09.00 | , , | |||||||||||||||||||||||
| Transmission/Distribution Expense: | |||||||||||||||||||||||||
| Purchased Power (Distribution Only) | 11.00 | , , | |||||||||||||||||||||||
| Other Transmission/Distrbution Expenses | 12.00 | , , | |||||||||||||||||||||||
| Total General Operating Expense (5810/ 7/G) | 13.00 | , , | |||||||||||||||||||||||
| *Only include transactions settled in volumes. | |||||||||||||||||||||||||
| 5811 | |||||||||||||||||||||||||
Sheet 38: 5812-1 (37)
| EIA-28 Financial Reporting System Sch 5812 -- Page 1 of 1 |
Domestic Electric Power Segments | ||||||||||||||||||||||||
| Purchases and Sales of Fuel and Electric Power | |||||||||||||||||||||||||
| ($000,000, MMcf, M Barrels, M Tons, MWh) | |||||||||||||||||||||||||
| FRS | Domestic | Foreign | Foot | ||||||||||||||||||||||
| Line # | Volume | Value | Volume | Value | note | ||||||||||||||||||||
| Power Purchases | 07.00 | , , | , , | , , | , , | ||||||||||||||||||||
| Power Sales ( 5810/1/E-G)) | 16.00 | , , | , , | , , | , , | ||||||||||||||||||||
Sheet 39: 5841-1 (38)
| EIA-28 Financial Reporting System Sch 5841 -- Page 1 of 2 |
Domestic and Foreign Electric Power Segments | |||||||||||||||||||||||||||||
| Capacity and Output Statistics | ||||||||||||||||||||||||||||||
| (MW, KVA, Miles, Customers) | ||||||||||||||||||||||||||||||
| End of Year | ||||||||||||||||||||||||||||||
| FRS Line # |
Worldwide | Domestic | Foreign | Foot note |
||||||||||||||||||||||||||
| Generation (By Primary Fuel Source): | A | B | C | |||||||||||||||||||||||||||
| Consolidated Capacity (M W): | ||||||||||||||||||||||||||||||
| Total Consolidated Generation Capacity | 10.00 | , , | , , | , , | ||||||||||||||||||||||||||
| Number of Units | 11.00 | , , | , , | , , | ||||||||||||||||||||||||||
| Unconsolidated Capacity | 12.00 | , , | , , | , , | ||||||||||||||||||||||||||
Sheet 40: 5841-2 (39)
| EIA-28 Financial Reporting System Sch 5841 -- Page 2 of 2 |
Domestic and Foreign Electric Power Segments | |||||||||||||||||||||
| Capacity and Output Statistics | ||||||||||||||||||||||
| (MWH, KWH) | ||||||||||||||||||||||

|
||||||||||||||||||||||
| FRS Line # |
World- Wide |
Domestic | Foreign | Foot note |
||||||||||||||||||
| A | B | C | ||||||||||||||||||||
| Total Consolidated Generation | 24.00 | , , | , , | , , | ||||||||||||||||||
| Unconsolidated Generation | 26.00 | , , | , , | , , | ||||||||||||||||||
| File Type | application/vnd.ms-excel |
| Author | Greg Filas |
| Last Modified By | Crash |
| File Modified | 2009-08-11 |
| File Created | 2005-11-21 |
© 2026 OMB.report | Privacy Policy