Supporting Statement Part B - Assessing the Fit and Comfort of Motorcycle Safety Gear
Supporting Statement Part B - Assessing the Fit and Comfort of Motorcycle Safety Gear.docx
Assessing the Fit and Comfort of Motorcycle Safety Gear
OMB:
Assessing the Fit and Comfort of Motorcycle Safety Gear
Supporting Statement Part B
Department of Transportation
National Highway Traffic Safety Administration
Information Collection Request Supporting Statement: Part B
Assessing the Fit and Comfort of Motorcycle Safety Gear
OMB Control Number: 2127-XXXX (new)
Abstract:1 NHTSA is seeking approval from OMB for a new information collection request to assess the fit, comfort, and preference of motorcyclists’ safety gear. The proposed study aims to address the pressing need to understand the relationship between the fit and comfort of personal protective motorcycle gear and the decision to use gear. This information collection will be a one-time voluntary collection involving assessments of motorcycle safety gear (i.e., footwear, gloves, helmets, jackets, and pants).
In 2022, there were 6,218 motorcyclists killed in traffic crashes, comprising 15 percent of all traffic fatalities and 19 percent of all motor vehicle occupant (driver and passenger) fatalities, representing a fatality rate per vehicle miles traveled nearly 22 times that of passenger car occupants.2 These findings demonstrate the inherent risk of motorcycle riding and highlight the importance of wearing personal protective gear. Nonetheless, not all motorcyclists use gear on every ride.
There are many reasons why a motorcycle rider may not wear protective gear, such as a sense of “personal freedom,” “It’s more fun to ride without a helmet,” skepticism about the protective value of helmets, and the discomfort of wearing a helmet.3 Even when protective gear is worn, ill-fitting gear or improperly worn gear could compromise protection. NHTSA provides specific information on its website about finding the right fit and identifying unsafe helmets, but the extent to which motorcyclists wear helmets that fit and are worn safely is unknown. Additionally, the requirements for an effective fit may vary by the type of motorcycle, riding style, and riding positions.
To encourage greater and proper usage of protective gear, it is crucial to understand the factors contributing to non-adherence to safety recommendations. NHTSA is conducting this study to investigate riders' beliefs, attitudes, and perceptions regarding gear fit and comfort, and to assess the fit and comfort of gear in use.
The study plans to screen 1,250 riders to reach the targeted 625 study participants with an equal number of riders of standard, cruiser, sport, and adventure/touring motorcycles and seated motor scooters; gather information about the protective gear the riders use; and assess the fit and comfort of the gear. Participation will be voluntary and anonymous.
Participants will be recruited at locations where riders gather such as rallies, and other organized social or training events. Study staff will observe gear worn by riders, assess the fit of one type of gear (i.e., footwear, gloves, helmet, jacket, or pants) per participant, and ask riders for their opinions about the fit and comfort of the gear type of interest (one type of gear per participant). Additionally, study staff will use a tablet to show participants a series of images of examples of the gear type of interest that range in protective value (e.g., half helmet, full-face helmet); the examples will include a description of the item (e.g., composition material, ventilation/waterproof features) but not the brand name. Participants will rate each example in terms of its perceived protection and the likelihood they would use or purchase it. The intention of this collection is to learn about the experiences and perceptions of riders regarding gear. The collected information will inform NHTSA’s programmatic activities as it looks for ways to improve rider safety while still prioritizing rider comfort to ensure riding remains an enjoyable experience.
NHTSA will use the collected information to produce a technical report with aggregate (summary) statistics and tables only; no identifying data will be retained or reported. The technical report will be distributed to audiences interested in improving highway safety.
B.1. Describe (including a numerical estimate) the potential respondent universe and any sampling or other respondent selection methods to be used. Data on the number of entities (e.g., establishments, State and local government units, households, or persons) in the universe covered by the collection and in the corresponding sample are to be provided in tabular form for the universe as a whole and for each of the strata in the proposed sample. Indicate expected response rates for the collection as a whole. If the collection had been conducted previously, include the actual response rate achieved during the last collection. Response rate means -- of those in your respondent sample, from what percentage do you expect to get the required information (if this is not a mandatory collection). The non-respondents would include those you could not contact, as well as those you contacted but who refused to give the information.
Staff will select motorcycle events such as those compiled in Table 1. The study team will seek approval from event management to set up an area for data collection. The potential respondent universe will be composed of all motorcyclists in the US. However, because the collected data will be from a convenience sample of volunteers, the results cannot be generalized to the population of American motorcycle riders. NHTSA will use the findings as a foundation from which to generate ideas for the development of countermeasures for motorcycle safety.
The sampling frame will be a subset of this universe and inclusive of all motorcyclists attending the selected events. The study anticipates contacting and screening an estimated 1,250 potential participants to obtain a total sample of 625 riders, comprised of 125 riders in each motorcycle type group; the motorcycle types include standard motorcycles, cruisers, sport motorcycles/sportsters, touring motorcycles, and scooters/mopeds. The number of riders can vary at a given venue depending on the size and type of the event. For instance, the 2022 Sturgis motorcycle rally had 505,000 attendees, while the White Mountain Boogie N’ Blues Festival had 4,500 attendees last year. Table 1 identifies various motorcycle rallies and provides recent year attendance, if available. NHTSA will select the events based on whether the event management authorizes the study staff to conduct the study during the event. Motorcycle Rallies in U.S. Destinations
Motorcycle Type |
Rally or Event Name |
Location |
Usual Month |
Estimated Attendance (year) |
All Motorcycle Types |
Laconia Motorcycle Week |
New Hampshire |
June |
300,000 (2025) |
Outer Banks Bike Week |
North Carolina |
April |
Not available |
|
Americade |
New York |
May/June |
35,000 (2022) |
|
Sturgis Motorcycle Rally |
South Dakota |
August |
470,000 (2024) |
|
Daytona Bike Week |
Florida |
March |
233,500 (2024) |
|
AIMEXPO |
Nevada |
February |
4,500 (2025) |
|
Cruisers |
Myrtle Beach Bike Week |
South Carolina |
October |
500,000 (2024) |
Bikefest Lake of the Ozarks |
Missouri |
September |
125,000 (2024) |
|
Adventure/ Touring Motorcycle |
AMA Gypsy Tour |
Florida |
March |
40,000 (2022) |
Myrtle Beach Bike Week |
South Carolina |
October |
500,000 (2024) |
|
Standard Motorcycles |
Thunder Beach Motorcycle Rally |
Florida |
October |
60,000 (2024) |
White Mountain Boogie N’ Blues Festival |
New Hampshire |
August |
4,500 (2024) |
|
Sport Motorcycles |
Laconia Motorcycle Week (New Hampshire Motor Speedway) |
New Hampshire |
June |
300,000 (2024) |
MotoAmerica |
Various |
March - Sept. |
300,000 (2022; across 10 events) |
|
Scooters |
Beauford Scooter Rally |
North Carolina |
June |
Not available |
Cape Cod Scooter Rally |
Massachusetts |
June |
Not available |
|
Land of 10K Scoots |
Minnesota |
August |
19,000 (2024) |
The study expects to obtain 625 participants with the breakdown of participant counts by motorcycle type shown in Table 2.
Type of Gear |
Type of Motorcycle |
|
|||||
Standard |
Cruiser |
Sport/Sportster |
Touring |
Scooters/Mopeds |
Total |
||
Footwear |
25 |
25 |
25 |
25 |
25 |
N=125 |
|
Gloves |
25 |
25 |
25 |
25 |
25 |
N=125 |
|
Helmet |
25 |
25 |
25 |
25 |
25 |
N=125 |
|
Jacket |
25 |
25 |
25 |
25 |
25 |
N=125 |
|
Pants |
25 |
25 |
25 |
25 |
25 |
N=125 |
|
Total |
N=125 |
N=125 |
N=125 |
N=125 |
N=125 |
N=625 |
|
Intercept field surveys have proven effective in a variety of domains. For example, a synthesis conducted as part of the Transit Cooperative Research Program found intercept surveys to have higher response rates than telephone, mail, and online surveys.4 That synthesis found most intercept surveys had a response rate between 33% and 67%. NHTSA’s 2013-2014 National Roadside Survey, which involved recruiting drivers from live traffic to complete questionnaires and provide biological samples, achieved a high response rate (79.3% of eligible drivers participated).5 Because of the COVID-19 pandemic, however, this study is anticipating a lower willingness to participate compared to prior efforts as some researchers have found that COVID-19 had a negative effect on response rates overall.6 Based on the foregoing, , the current study is estimating a 50% response rate among eligible riders who stop to hear more about the study. As such, it is estimated the new data collection will include the screening of an estimated 1,250 potential participants to qualify a total sample of 625 motorcyclists. To qualify, a participant must be:
Able to read and understand English
A US citizen or permanent resident
At least 18 years old
Observed to be the operator of one of the types of motorcycles of interest (i.e., standard, cruiser, sport, adventure/touring, scooter).
Table 3 provides the age, race, and sex distributions of motorcycle riders in the U.S.7 These values were used to calculate estimates of expected participant distributions in the current study’s sample.
Variable |
Category |
Distribution |
Estimated Sample Size |
Age |
18-29 |
13% |
81 |
|
30-39 |
18% |
112 |
|
40-49 |
22% |
137 |
|
50-59 |
25% |
156 |
|
60+ |
23% |
143 |
|
|
|
|
Race/Ethnicity |
White |
88% |
550 |
|
African American |
7% |
44 |
|
Hispanic |
4% |
25 |
|
Asian/Pacific Islander |
1% |
6 |
|
|
|
|
Sex |
Male |
80% |
500 |
|
Female |
20% |
125 |
Sample Size Considerations
Margin of Error. In any study of this type, it is critical to minimize margin of error (MOE) to ensure the survey results reflect as best as possible the true behaviors, knowledge, or opinions of the population from which the sample is taken. MOEs at 90%, 95%, and 99% confidence levels were calculated with the constants of population parameter = 0.5, DEFF = 1, and sample size varied from 500 to 1000. Table 4 summarizes the expected MOEs under these conditions. As shown in the table, the proposed sample size of 625 will result in an MOE of ±3.9% at a 95% confidence level. This MOE will be acceptable for the basic gear prevalence (i.e., gear worn/not worn) and gear fit (i.e., gear fit appropriately/did not fit appropriately) measures.
|
Sample Size |
|||
Confidence |
500 |
625 |
800 |
1000 |
90% |
3.7 |
3.3 |
2.9 |
2.6 |
95% |
4.4 |
3.9 |
3.5 |
3.1 |
99% |
5.8 |
5.2 |
4.6 |
4.1 |
Group Differences. The study expects to utilize z-tests on column proportions to determine if the proportion of responses among independent samples differs from one group of gear usage versus another. For example, assuming a baseline usage rate of 64% for helmets, a difference of 18% from jacket usage at 46% would be detectable with 125 participants in each group at a power level of .80.
Sample Size per Gear Group to Detect Differences at .80 or .90 Power
Power (1- β) |
Difference in Proportions |
||||
0.15 |
0.18 |
0.21 |
0.24 |
0.27 |
|
0.80 |
171 |
119 |
88 |
67 |
53 |
0.90 |
228 |
159 |
117 |
89 |
70 |
Likert Items Analysis. The study will utilize Analysis of Variance (ANOVA) to determine group differences on Likert items such as those that ask participants to rate gear as “Comfortable” or “Easy to put on” on a “strongly disagree” to “strongly agree” scale. A power analysis for gear type by motorcycle type (5 x 5) design is summarized in Table 6 below. All sample sizes assume a medium effect size of f = 0.25 (Cohen’s f statistic). As can be seen in the table, the total sample size (N = 625) projected for this study is more than sufficient to detect medium effect sizes at a power of 0.90 at the full interaction level of the model (Gear x Motorcycle).
Power (1- β) |
Model Factors |
|||
Gear |
Motorcycle |
Gear x Motorcycle |
|
|
0.80 |
200 |
200 |
325 |
|
0.90 |
275 |
275 |
400 |
|
Note: All sample sizes assume a medium effect size of f = 0.25.
Statistical Analysis Plan
This study intends to observe gear usage/prevalence for all 625 participants to estimate gear use among the rider populations at the selected venues. As such, overall gear use prevalence will be calculated with an expected MOE of ±3.9% at a 95% confidence level for a sample of 625 riders. This MOE will be acceptable for the basic gear prevalence (i.e., gear worn/not worn) measures. Fit assessments will only be conducted when a rider is wearing the gear. Descriptive statistics will be provided for the fit/did not fit variables with MOE calculated based on the acquired sample size (number of gear fit assessments that were completed) for each gear type.
The study expects to utilize Chi-Square Tests to determine if the distributions of frequencies of responses in each category for comfort and fit items vary by gear type. Similar analyses will explore if distributions of responses vary by type of motorcycle ridden for ratings of comfort and fit across gear types.
ANOVA will be used to examine differences in ratings of comfort and fit by motorcycle type and gear type. Relationships between variables will be explored in the following ways, including but not limited to:
Comfort and fit of various gear types
Attitudes about various gear types
Perceptions of various gear types
Reasons for gear use or gear avoidance
Participant characteristics (e.g., motorcycle type, demographics)
Descriptive results will be provided for the demographic and survey information collected.
B.2. Describe the procedures for the collection of information, including:
Statistical methodology for stratification and sample selection.
Participants will be recruited at locations such as motorcycle rallies, social gatherings, training events, and meet-ups where the means for on-site data collection will be set up. Overall, the selected events/sites for data collection will be a convenience sample of events or locations where riders of each motorcycle type congregate. Staff will attempt to focus on separate events that cater specifically to riders of distinct motorcycle types, when possible, but many events attract a variety of motorcycle/rider types. Larger events (i.e., more riders attending based on past attendance documentation) will be given priority during the site selection process in an attempt to reach a wider audience of riders. Approvals will be obtained from the selected events to establish a data collection area at the event site. The study will collect data from 125 participants for each of the five different motorcycle types (standard, cruiser, sport, adventure/touring, scooter), screening an estimated 1,250 individuals to recruit 625 total potential participants. Twenty-five participants within each motorcycle type will provide inputs on fit and comfort for one of the gear types (i.e., footwear, gloves, helmets, jackets, pants).
At any given event, study staff will attempt to randomly recruit riders passing by the data collection location or in the parking lot of the selected location. Recruitment will be limited by the number of available data collectors. When a data collector is available, they will attempt to recruit every third rider passing by the data collection location. Recruiting will stop when all data collectors are occupied with participants. Once a data collector is available, they will begin the random selection process again. Information on non-participants (e.g., estimated age, sex, race, motorcycle type) will be gathered to the extent possible to assess potential biases in the sample obtained at each location. While it is anticipated the sample will be representative of the riders at each event given the recruitment approach, the sample will not be representative of all riders of a given type across the country due to the event selection process. As such, no inferences will be made to the larger population of riders beyond those attending the selected events.
Data Collection Procedures
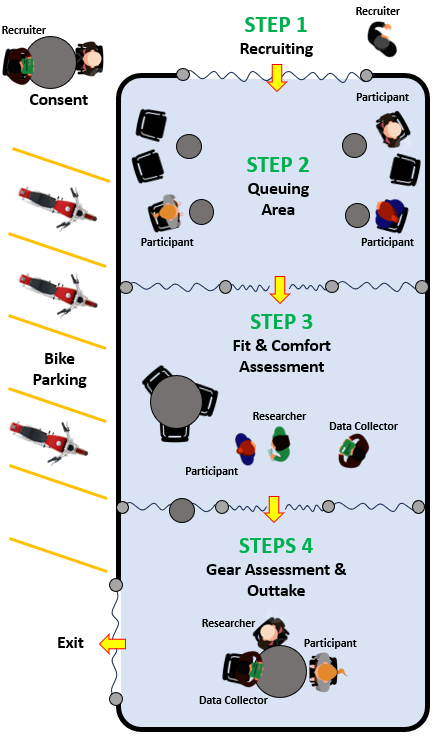
Riders will be recruited as they pass the data collection area or in the parking areas of the selected locations if a stationary data collection approach is not viable at a given event. Figure 1 provides an example site setup and flow of the data collection process. The actual setup could vary depending on the available space at an event. In the event a stationary location is not available, or recruitment of passing riders proves very difficult, study staff may approach riders in the parking lot to complete the study steps near their motorcycle.
Example Site Setup for Data Collection
Once recruited, a study staff member will approach a potential participant, introduce themselves, indicate the study is voluntary and anonymous, explain the components of the study, and ask the initial screening items if the individual is interested in participating. Once deemed eligible, the data collector will provide the potential participant with a tablet to read and complete the informed consent process. A data collector can read the consent aloud if an individual is having difficulty reading. Once consent has been obtained, the data collector will begin observing the gear the rider is wearing at the time of arrival at the data collection site (i.e., footwear, gloves, helmets, jackets, pants). Participants will then complete the intake survey which includes questions about riding history, motorcycle make/model, and information about the rider’s gear choices.
A trained researcher will then perform the appropriate measurements for the gear type being assessed (e.g., head circumference for helmets, waist circumference for pants). Measurements will be recorded on the study tablet by the assigned data collector. Data collectors will collect observations about the gear type of interest and ask the participant questions about the gear they are currently wearing. Data collectors will record participant responses on the study tablet.
Participants will then be shown images of selected pieces of the gear type of interest (one type per participant) of differing protective value (e.g., half helmet, full-face helmet) on a tablet along with a description of the item (e.g., composition material, ventilation/waterproof features) and be asked questions concerning perceived protective value, likelihood of wearing/buying similar gear, perceived functionality of the item while riding, and the perceived quality of the item
Once the pieces of gear have been assessed, participants will be compensated $50.00 cash (or an equivalent gift card to a vendor at the event) for their time. Study staff will be available to answer any questions the participants may have.
B.3 Describe methods to maximize response rates and to deal with issues of nonresponse.
The study will use highly trained teams of data collectors to implement the recruitment procedures described above. Such intercept survey approaches have proven effective for NHTSA and other transportation studies in the past. The study will offer financial incentives for participation. The study plans to pay $50.00 to participants who complete all data collection activities. As previously noted, information collected for participants and nonparticipants at each data collection location will be used to assess potential biases in the final sample obtained.
Additionally, researchers will provide assurances of anonymity in the informed consent process by indicating that no identifying information will be recorded by the project.
B.4. Describe any tests of procedures or methods to be undertaken. Testing is encouraged as an effective means of refining collections of information to minimize burden and improve utility. Tests must be approved if they call for answers to identical questions from 10 or more respondents. A proposed test or set of tests may be submitted for approval separately or in combination with the main collection of information.
Study staff will conduct pilot testing of all surveys and other study procedures. The surveys will be tested on the tablets on which they will be administered. Pilot testing of all data collection elements will be conducted with up to nine non-staff members who are naïve to the project objectives. This pilot testing will evaluate participant comprehension of survey items and provide practice for data collectors to accurately take anthropometric measurements. Pilot test data will be reviewed for inconsistent survey responses that could signal suboptimal item structure or flaws in the data collection sequence of events. These findings will be used to identify potential improvements to the data collection instruments prior to beginning actual data collection.
B.5. Provide the names and telephone numbers of individuals consulted on statistical aspects of the design.
The following individuals have reviewed technical aspects of this research plan:
Kristie Johnson, PhD
National Highway Traffic Safety Administration
Department of Transportation
1200 New Jersey Avenue SE, Washington, DC 20590
Emily Brunsen, PhD
Dunlap and Associates, Inc.
125 Edinburgh South Drive, Suite 111, Cary, NC 27511
Office: 319-213-1868
Kraig Finstad, PhD
Dunlap and Associates, Inc.
125 Edinburgh South Drive, Suite 111, Cary, NC 27511
Office: 203-323-8464
F. Dennis Thomas, MA, PhD
Dunlap and Associates, Inc.
125 Edinburgh South Drive, Suite 111, Cary, NC 27511
Office: 203-215-2948
Jenna
Darrah, MS
Dunlap and Associates, Inc.
125 Edinburgh South Drive, Suite 111, Cary, NC 27511
Office: 412-965-9889
1 The Abstract must include the following information: (1) whether responding to the collection is mandatory, voluntary, or required to obtain or retain a benefit; (2) a description of the entities who must respond; (3) whether the collection is reporting (indicate if a survey), recordkeeping, and/or disclosure; (4) the frequency of the collection (e.g., bi-annual, annual, monthly, weekly, as needed); (5) a description of the information that would be reported, maintained in records, or disclosed; (6) a description of who would receive the information; (7) if the information collection involves approval by an institutional review board, include a statement to that effect; (8) the purpose of the collection; and (9) if a revision, a description of the revision and the change in burden.
2 National Center for Statistics and Analysis. (2024, July). Motorcycles: 2022 data (Traffic Safety Facts. Report No. DOT HS 813 589). National Highway Traffic Safety Administration.
3 Higgins, L.L. & Turner, P. (2013). Texas motorcycle survey, 2012 [Paper presentation]. International Motorcycle Safety Conference, Orlando, FL, United States.
4 Schaller, B. (2005). On-board and intercept transit survey techniques: A synthesis of transit practice. Transportation Research Board.
5 Kelley-Baker, T., Lacey, J. H., Berning, A., Moore, C., Brainard, K., Ramirez, A., Moore, C., Brainard, K., Yao, J., Tippetts, A. S., Romano, E., Carr, K., & Pell, K. (2016). 2013–2014 national roadside survey of alcohol and drug use by drivers: Methodology (Report No. DOT HS 812 294). National Highway Traffic Safety Administration.
6 Sastry, N., McGonagle, K., & Fomby, P. (2020). Effects of the COVID-19 crisis on survey fieldwork: Experience and lessons from two major supplements to the U.S. Panel Study of Income Dynamics. Survey research methods, 14(2), 241–245.
7 Jones, C. (2023). Motorcycle Demographics: 59 User Facts & Numbers [2023]. https://motorandwheels.com/motorcycle-demographics/#Age_Demographics_of_Motorcycle_Riders
Page
| File Type | application/vnd.openxmlformats-officedocument.wordprocessingml.document |
| File Title | NCC edits |
| Author | Wochinger, Kathryn (NHTSA) |
| File Modified | 0000-00-00 |
| File Created | 2025-12-05 |
© 2026 OMB.report | Privacy Policy