Boundary and Annexation Survey
Boundary and Annexation Survey (BAS)
BAS Paper How-to Guide
Boundary and Annexation Survey
OMB: 0607-0151
Boundary
and Annexation Survey
Paper How-to Guide Instructions
for Participating in the Boundary and Annexation Survey Using Paper
Maps
Instructions
for Participating in the Boundary and Annexation Survey Using Paper
Maps

Last Updated January 2026.
Table of Contents
A. Key Dates for Respondents vi
B. Adjacencies and Legal Disputes vi
Chapter 1 Completing A Paper BAS Submission 1
1.1 Check the Package Materials 1
1.3 Return the Completed Submission 1
Chapter 2 Marking Updates on the Map: Boundaries 2
2.1.1 How to Draw Legal Boundary Changes 2
2.1.2 Boundary Changes Involving Coincident Features 3
2.4.1 Submitting New Tribal Subdivisions 6
2.4.2 Updating Existing Tribal Subdivisions 6
2.4.3 Tribal Subdivision Documentation 6
2.5 New Incorporations and Disincorporations 7
Chapter 3 Marking Updates on the Map: Street Features 8
3.1 Modifying Street Locations 8
3.3 Adding Street Names in a Congested Area 9
Appendix A Reading a Map A-1
List of Figures
Figure 1. Annotating a Legal Boundary Change 2
Figure 2. Annotating an AIA Trust Land 3
Figure 3. Annotating a Legal Boundary Change Coincident with a Feature 3
Figure 4. Annotating a Legal Change to an Incorporated Place 4
Figure 5. Annotating a Boundary Correction to an Incorporated Place Boundary 4
Figure 6. Indicating a Geographic Corridor 5
Figure 7. Depicting a Geographic Offset 5
Figure 8. Recording New Tribal Subdivision Information 6
Figure 9. Modifying a Street Location 8
Figure 10. Adding an MTFCC when Adding a New Street 9
Figure 11. Listing Street Names when Adding Streets in a Congested Area 9
Figure 12. Correcting a Street Name 10
Figure 13. Deleting a Street 10
Figure 16. Key to Adjacent Sheets A-3
Figure 17. Sheet Location within Government Key A-3
This page left blank intentionally.
Introduction
The Boundary and Annexation Survey (BAS) provides eligible governments, which include tribal, state, and general-purpose local governments, an opportunity to review the Census Bureau’s legal boundary data to confirm the Census Bureau has the correct boundary, name, and status information. BAS also allows participants to review and provide updates to census designated place (CDP) boundaries and linear features. Maintaining correct boundaries helps the Census Bureau assign appropriate housing and population counts to each government. Title 13, Section 6, United States Code authorizes this survey.
BAS fulfills the agency’s responsibility as part of the National Spatial Data Infrastructure, for which the Office of Management and Budget (OMB) Circular A–16 designates the Census Bureau as the lead federal agency for maintaining national data about legal government boundaries, as well as administrative and statistical boundaries. BAS supports the geospatial data steward responsibilities of the Geospatial Data Act, the Evidence Act, OMB E-Gov, the Federal Geographic Data Committee, Data.gov, GeoPlatform.gov, the National Map, the Geographic Names Information System, and the Geospatial One-Stop.
The Census Bureau uses the boundaries collected in BAS to tabulate data for various censuses and surveys including the decennial census, American Community Survey (ACS), and Population Estimates Program (PEP). It also uses the boundaries collected through BAS to support several other programs such as Congressional and State Legislative redistricting, the Economic Census, the Geographically Updated Population Certification Program, and the Special Census program.
January 1 Legal boundary changes must be in effect on or before this date to be reported in the current survey year.
March 1 First BAS deadline – Legal boundary changes returned or postmarked by this date will be shown in the ACS and PEP data and in next year’s BAS materials.
May 31 Final BAS deadline – Legal boundary changes returned or postmarked by this date will be shown in next year’s BAS materials. If time permits, boundary corrections returned by this date may also be shown.
The Census Bureau
will not make any boundary change that affects adjacent legal
governments without the appropriate documentation. Review any changes
that affect adjacent governments to determine if they are intentional
legal changes. If the Census Bureau discovers that an area of land is
in dispute between two or more jurisdictions, the Census Bureau will
not make any changes until the parties come to a written agreement or
there is a documented final court decision regarding the dispute. To
learn more, contact the Census Bureau Legal Office at
1-301-763-2918.
For disputes involving tribal areas, the Census Bureau must defer to the Office of the Solicitor at the Department of the Interior for a legal opinion. Often complicated land issues require an extended period for resolution, and in those cases, the Census Bureau will retain the current boundary until a legal opinion is issued by the Solicitor's office.
For assistance in preparing your BAS submission, contact the Census Bureau at <geo.bas@census.gov> or 1-800-972-5651.
Additional resources include a technical guide and videos that
demonstrate the BAS submission process. For background on Census
Bureau geography and technical details regarding the BAS submission,
change types, and shapefiles are in the BAS Technical Guide at:
<www.census.gov/programs-surveys/bas/information/respondent-guides.html>.
Videos of recorded demonstrations and informational sessions are
available on the BAS website at:
<www.census.gov/programs-surveys/bas/library/bas-videos.html>.
Use the instructions and help references from this section to begin.
Note: To standardize experiences across the Census Bureau’s Geographic Partnership Programs, your BAS ID is now your GOVID. This unique geographic identifier will help us keep track of program participation and proper contact information. The ID itself has not changed from last year.
The Paper BAS package contains: this guide, the materials package cover letter, an index map, larger scale map sheet(s), colored pencils, a postage paid return envelope, and a return label.
Compare the reference maps to a local source for the government (e.g., a local plat map or a county assessor’s dataset). Update the map(s) if the boundaries shown do not correctly depict the boundaries in effect as of January 1 of the current survey year.
Chapter 2 and Chapter 3 of this guide give detailed instructions on how to update the map using the pencils provided.
Appendix A of this guide describes how to interpret the paper maps provided; however, viewing a digital map of the boundaries in TIGERweb, before annotating the paper maps, can be helpful.
TIGERweb <https://tigerweb.geo.census.gov/tigerwebmain/TIGERweb_main.html> is the Census Bureau’s online map viewer that can be used to see a more detailed version of boundaries alongside imagery. The TIGERweb for BAS instructions can be found on the BAS website at: <https://www2.census.gov/geo/pdfs/partnerships/bas/TIGERwebforBAS.pdf>.
Return all updated maps using the postage paid return envelope and return label from the Paper BAS package, or mail the updated maps to the Census Bureau at the address listed below:
U.S. Census Bureau
National Processing Center
1621 Dutch Lane
ATTN: BAS, Check-in and Batching Section, Bldg 60A
Jeffersonville, IN 47130
BAS participants using paper maps may only make updates affecting legal boundaries. Updates needed for census designated places cannot be performed as a paper participant. Please Contact Us if questions exist regarding this detail.
All legal changes (annexations and deannexations) must have documentation supporting the change(s) annotated on the map. AIA legal boundary changes must have AIA legal documentation (e.g., statute, federal court decision, trust deed) submitted with each requested change. Legal changes from incorporated places, minor civil divisions (MCDs), and counties must have an authorization number, such as a resolution or ordinance number, authorization type, and the effective date noted on the map.
Figure 1 and Figure 2 illustrate the correct way to draw legal boundary changes on the reference maps.
Using the red pencil provided, cross out the portion of the boundary that is no longer current with a string of “Xs”.
Draw the new boundary line(s) ensuring the boundary is closed.
Add the ordinance number or other legal identifier of the action authorizing the change, along with the effective date of each annexation or deannexation that is drawn on the map.
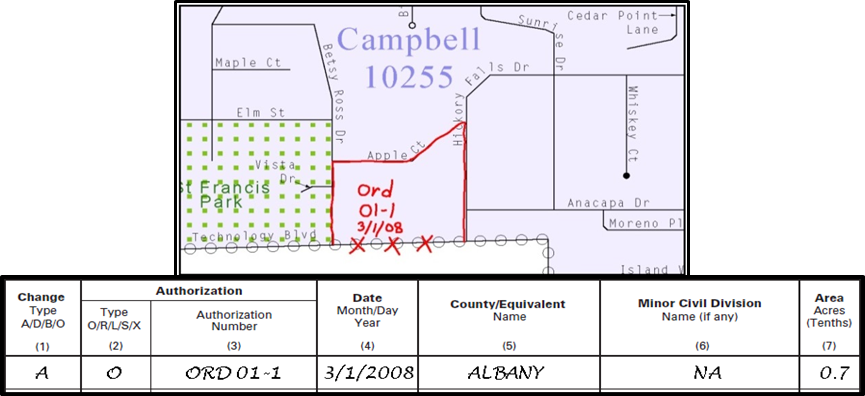
Figure 1. Annotating a Legal Boundary Change
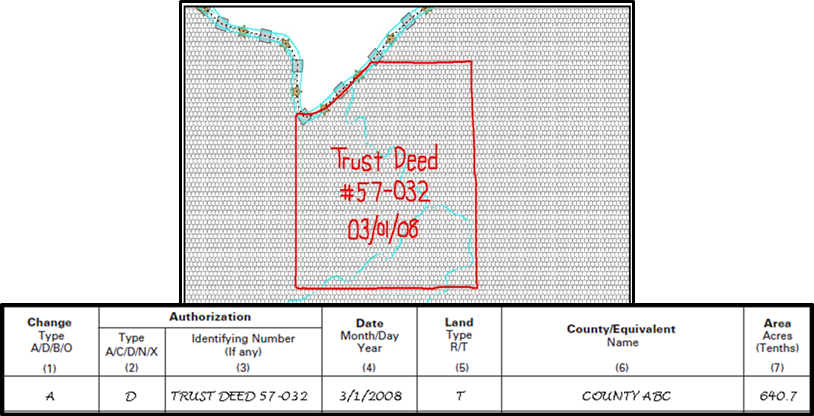
Figure 2. Annotating an AIA Trust Land
Figure 3
and Figure 4
illustrate how to adjust a boundary that is currently coincident with
(i.e., follows exactly) a feature, such as a river or street.
Using the red pencil, cross out the portion of the boundary that is no longer current using a string of “Xs” inside circles.
Draw the updated boundary.
Add the authorization number or other identifier of the action authorizing the change along with the effective date of each addition or deletion next to the area being changed.
If both the boundary and feature need to be moved, cross out the incorrect boundary with red “Xs” and then draw a red line representing the new location of the boundary and road.
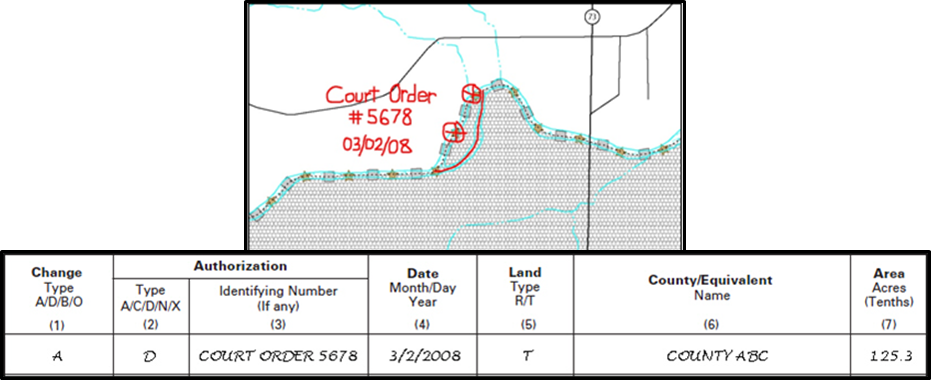
Figure 3. Annotating a Legal Boundary Change Coincident with a Feature
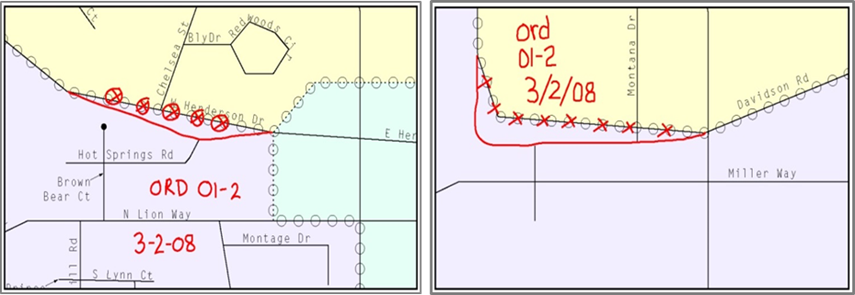
Figure 4. Annotating a Legal Change to an Incorporated Place
Left: Only the boundary moves to the new location. The street feature location is correct, but the boundary location is incorrect. Right: Both the boundary and the street feature move to a new location. Both the boundary and the street feature location are incorrect.
A boundary correction is the adjustment of a boundary to correct an error in the Census Bureau’s version of the boundary, and it is not the result of a legal change. Boundary corrections should follow the general shape of the existing boundary. Legal documentation is not required when submitting a boundary correction to the Census Bureau. Figure 5 illustrates how to complete a boundary correction.
Using the red pencil, cross out the incorrect boundary with a string of “Xs”.
Add a line showing the correct boundary.
Print the letters “BC” inside the change to identify the update as a boundary correction rather than a legal change.
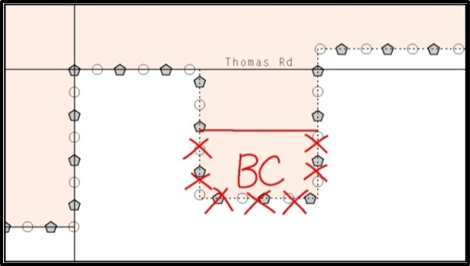
Figure 5. Annotating a Boundary Correction to an Incorporated Place Boundary
The Census Bureau does not require places and AIAs to report rights-of-way. Geographic corridors are not essential to the mission of the Census Bureau and the right-of-way should only be included if it is crucial to the place or AIA, or if state or local laws require it.
To indicate a geographic corridor on the map, use the red pencil to draw a line on each side of the road. Mark the beginning and end of each line with perpendicular hatch (||) marks. Write the letters “GC” beside each line (Figure 6). To remove a geographic corridor or offset, use the red pencil to mark the beginning and end of the corridor or offset with perpendicular hatch (||) marks and write “remove GC.”
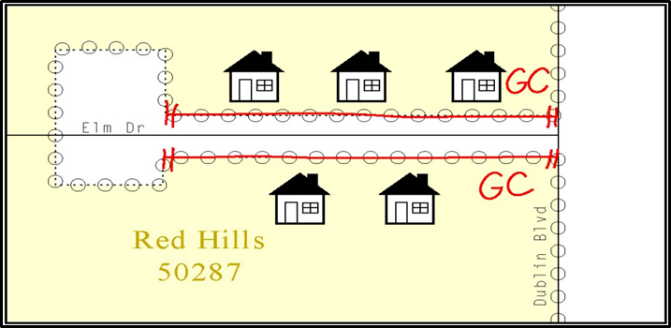
Figure 6. Indicating a Geographic Corridor
To indicate a geographic offset on the map, use the red pencil to draw a line parallel to the road, along which the offset will be created. Mark the beginning and end of the line with perpendicular hatch (||) marks. Write the letters “OFF” on the side of the road where the geographic offset exists (Figure 7).
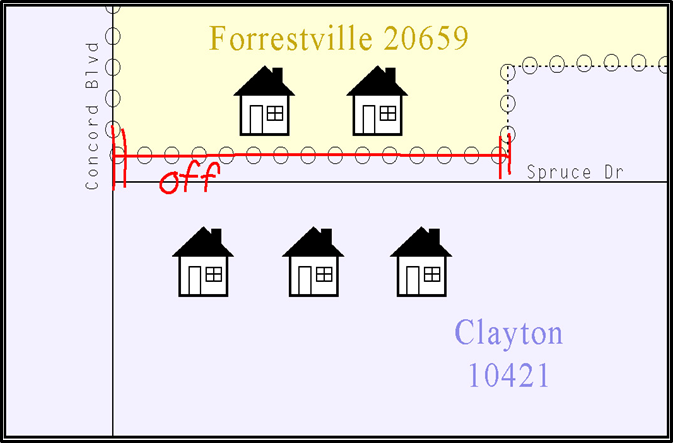
Figure 7. Depicting a Geographic Offset
The Census Bureau
considers any type of unit of self-government or administration in
tribal areas as a tribal subdivision. A tribe may submit only one
type of subdivision, even if it has more than one type of distinct
administrative area that could qualify as a tribal subdivision
(e.g., tribal election districts, tribal water districts, or
health service areas with different boundaries). The Census Bureau
recognizes two types of tribal subdivisions – active (A) and
inactive (I):
Active subdivisions are defined as having a functioning government, with elected officials, that provides programs and services.
Inactive subdivisions have no functioning government or elected officials and receive services solely from the tribe.
If this is the first time that tribal subdivisions are being provided to the Census Bureau do the following (Figure 8):
Using the blue pencil, add the boundaries on the reference map(s).
Each tribal subdivision must be labeled on each map sheet with its name (e.g., “District 3,” “Arlee District,” “White Rock Chapter,” “Parmelee Community”).
Record the name, type, and status of each subdivision on the map.
If a tribal subdivision boundary follows a visible feature such as a stream, road, or fence-line, be sure to indicate that on the reference map. Add the visible feature the boundary follows if it is not already shown on the map.
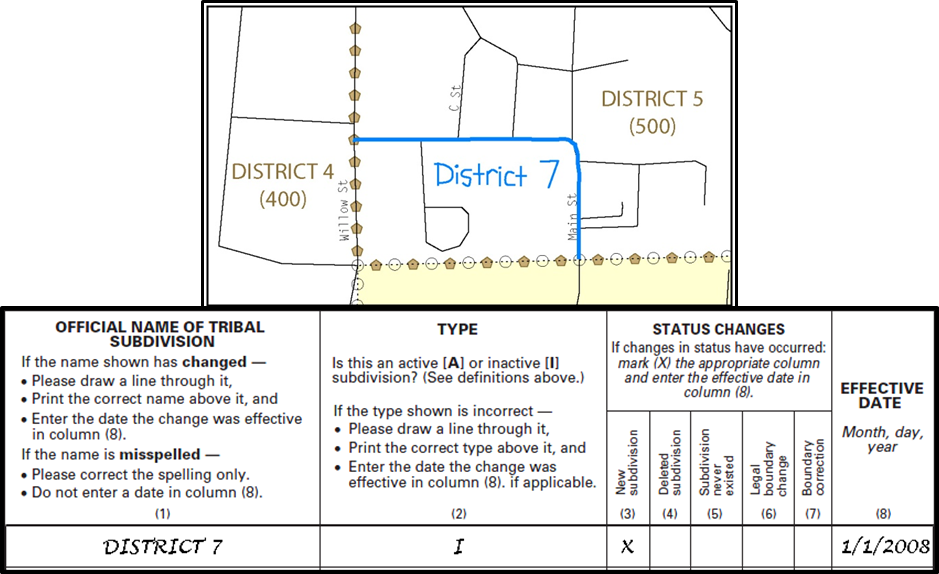
Figure 8. Recording New Tribal Subdivision Information
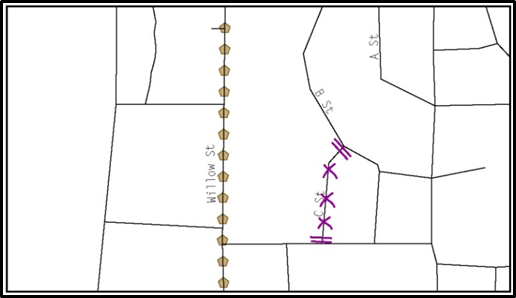
If tribal subdivisions were delineated during a prior survey, they are symbolized on the enclosed reference maps by a dashed pentagon-shaped gold line. To add or revise tribal subdivision boundaries on the enclosed map(s):
Using the red pencil, note any changes to the boundary of the land base on the map(s).
Using the blue pencil, add and/or revise the boundaries of the tribal subdivisions on the enclosed reference map(s).
New tribal subdivisions and name changes to existing tribal subdivisions require documentation, regardless of whether they are being delineated for the first time or being added to those previously reported. This documentation should be in the form of a tribal resolution or a tribal constitution. Include a copy of this documentation with the reference maps when returning these materials to the Census Bureau.
Corrections to the Census Bureau’s depiction of tribal subdivision boundaries do not require documentation.
Newly incorporated governments should provide the Census Bureau with:
A copy of the official new incorporation papers, including date of incorporation.
A map indicating the boundaries of the new incorporation.
Contact information for the highest elected official and a contact for BAS.
Disincorporated governments should provide the Census Bureau with a copy of the official papers of disincorporation, including the effective date.
The primary purpose of BAS is to collect legal boundary information. However, street feature updates and modifications occurring within your government’s jurisdiction may be reported through BAS.
Using the purple pencil, cross out the incorrect street location with “Xs”. Only correct streets that are incorrectly located, mislabeled, or distorted.
Draw the street in the correct location.
Print the name of the street along the length of the street as shown in Figure 9.
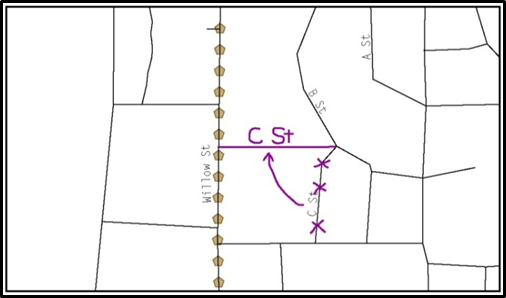
Figure 9. Modifying a Street Location
Using the purple pencil, draw the street and its name on the map. If the correct street name attribution is not provided, the Census Bureau will not make the correction. The newly added streets must be named and exist on the ground or be currently under construction (no paper or planned streets) when submitted. The Census Bureau does not accept new street adds for driveways, parking lot roads, unnamed alleys and other types of unnamed streets.
Provide the Master Address File/Topologically Integrated Geographic Encoding and Referencing (MAF/TIGER) Feature Class Code (MTFCC) for all new streets (Figure 10). The MTFCC will be S1400 for most residential streets. A full list of MTFCC codes and descriptions can be found at: <www.census.gov/library/reference/code-lists/mt-feature-class-codes.html>.
Alternate street names may be written in parentheses below the primary street name. Due to the difficulty of showing multiple names for a street, only the primary street name is shown on the reference maps.
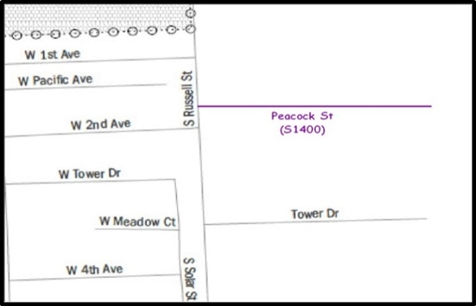
Figure 10. Adding an MTFCC when Adding a New Street
If an area of the map is too congested to add all street names, using the purple pencil, number each feature and list this number and the corresponding feature name in the map margin or in an uncongested spot close to the feature’s actual location (Figure 11).
Do not repeat numbers on a map sheet.
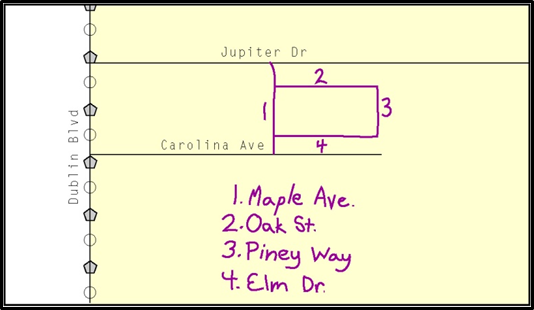
Figure 11. Listing Street Names when Adding Streets in a Congested Area
Using the purple pencil, draw a line through the incorrect street name.
Print the correct street name along the street.
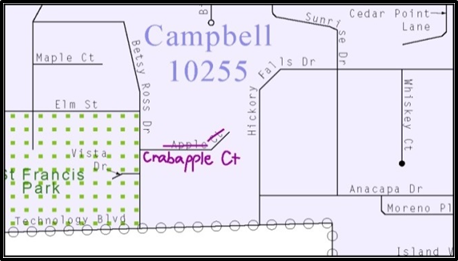
Figure 12. Correcting a Street Name
Delete streets only if they are nonexistent or impassable. Do not delete a street because the local jurisdiction is not responsible for maintaining it.
Using the purple pencil, mark the beginning and end of the base feature to be deleted with hatch (||) marks perpendicular to the feature as shown below.
Cross-out the nonexistent street feature using a string of “Xs”.
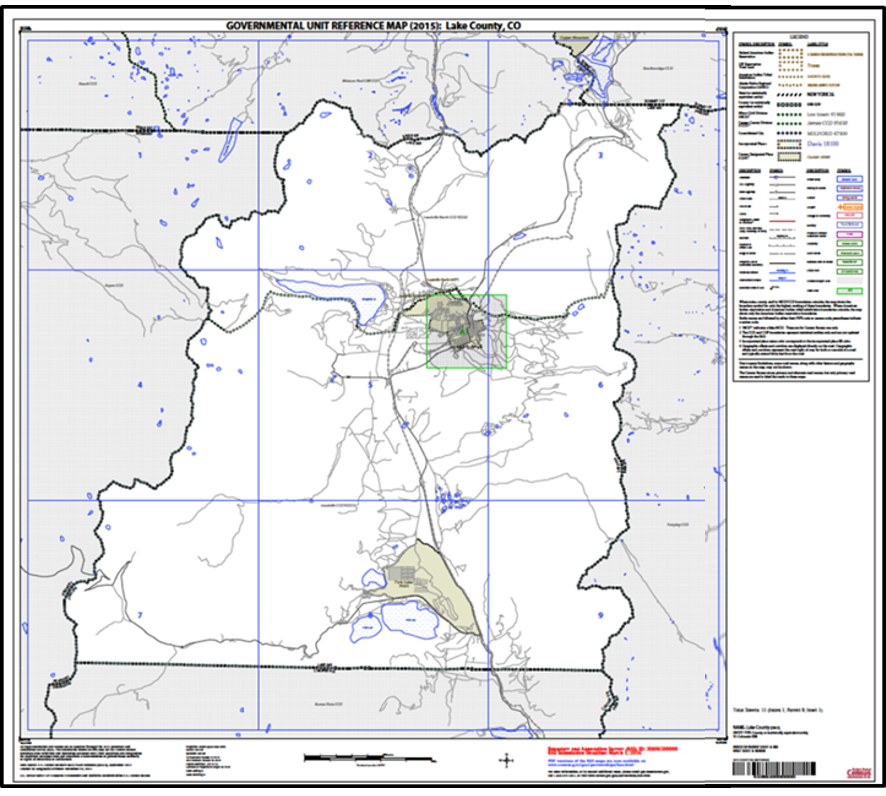
When deciding which map to use for a BAS submission, it is necessary to view the government as a whole and choose the correct parent map sheet based on its location within the government. Do this by referring to the index map (Figure 14), a relatively small-scale map that shows the entire government, and the location and number of all parent map sheets within that government. Each parent map sheet has a numerical locator, which differentiates it from the other parent map sheets associated with that government. The numbering begins with the northern and western-most parent map sheets and continues left-to-right. By referring to the index map, determine which parent map sheet(s) to use for the BAS submission, and then access it based on its number on the index map. The index map is not appropriate for BAS submissions. Its purpose is as a reference or index of parent maps, and it will not be accepted as a BAS submission.
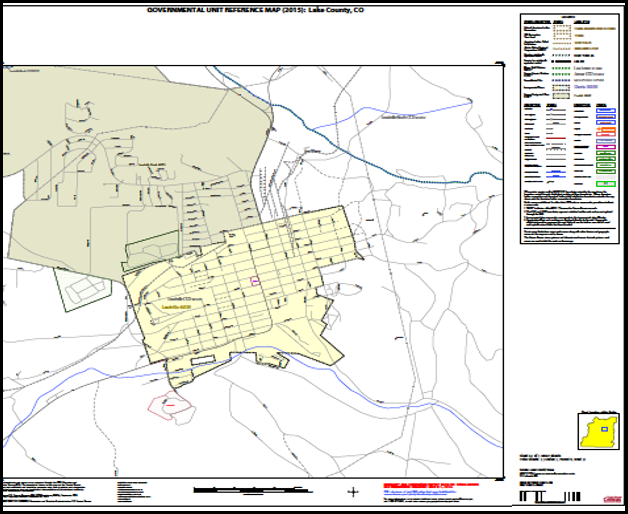
Many governments are too large to be shown on a single map. For this reason, it is necessary to separate the government into sections, each of which has its own map, called the parent map sheet (Figure 15). A single government is often represented with numerous map sheets, with each parent map sheet showing a small section of the government. Each parent map is assigned a number, beginning with the number one and increasing progressively for each additional parent map sheet (i.e., 1, 2, 3, 4, and so on). This makes viewing and editing map sheets more manageable, and it becomes possible to depict an area with the level of detail necessary to make changes or challenges. In most instances, the parent map is the one that should be used for BAS submissions.
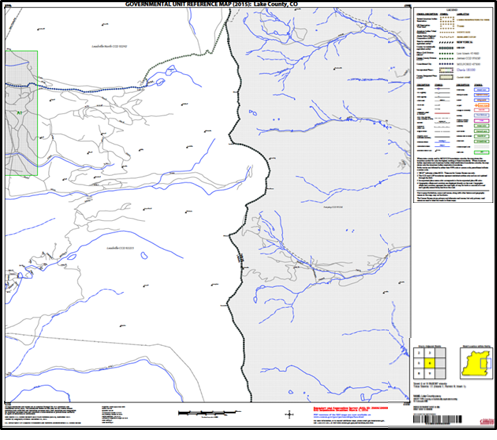
In the bottom right-hand corner of the parent map sheet, there is a key to the parent map sheet’s location in relation to adjacent map sheets as shown in Figure 15 above. A larger example of this key is shown in Figure 16. This key helps the user quickly determine which adjacent map sheet to use.
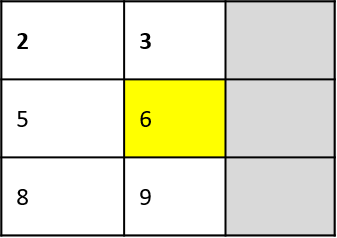
Figure 16. Key to Adjacent Sheets
Next to the key to adjacent sheets, there is a small outline of the entire government (the inside of which is colored yellow), and a blue outline of the parent map sheet. This key displays the location of the map sheet in relation to the government as a whole (Figure 17).
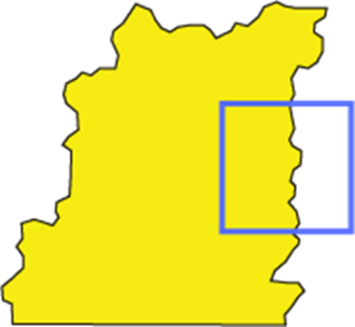
Figure 17. Sheet Location within Government Key
In some instances, in highly congested areas, even a parent map sheet provides insufficient detail for BAS purposes. In such cases, rather than using a parent map, the area is depicted within an inset map (Figure 18). This refers to a map with a very large scale, so that it displays a smaller area than the parent map sheet, but with greater detail. On the index map, an inset map is represented by a green outline and is assigned a number preceded by a letter (i.e., A1, A2, B1, etc.), as shown in Figure 19. Inset maps are only found in areas with many features and are used less often than parent maps.
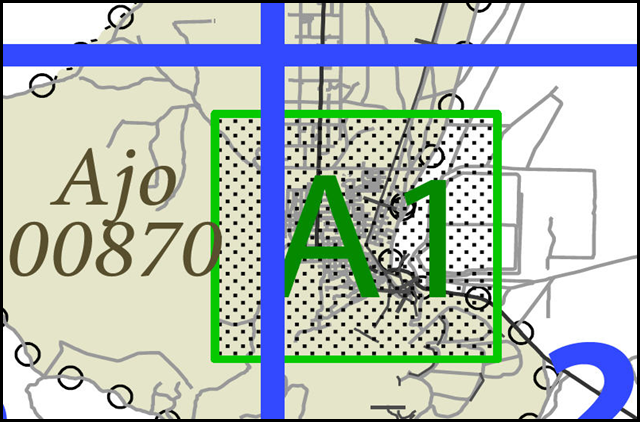
Figure 18. Inset Map Displayed on the Index Map
Naturally, the map is always smaller than the area it represents, so nearly all maps are equipped with a scale that depicts the ratio of distance on the map to the actual distance on land. The scale can be designed any number of ways, but two of the most common scales are ratio scales, which describe a ratio between the map and the real world (e.g., 1: 24,000), and bar scales, which depict that relationship graphically by displaying how much a certain distance on the map represents in the real world (Figure 20). In other words, if a map has a ratio scale of 1: 24,000, it means that one inch on the map represents 24,000 inches on the ground. This works with any unit of measurement, as long as the unit being used on the map is the same as, or properly converted from, the unit being depicted on the ground. Often a map will have both types of scale.
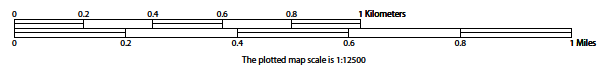
The map from which this scale was taken has a ratio scale of 1:12,500. The bar scale shows distances in kilometers and miles.
A bar scale will often be a set length (e.g., one inch), and/or represent a set distance (e.g., one mile). The bar scale is used to determine distance on the map by using a ruler. Place the ruler on the map to determine the distance on the map, then place the ruler along the bar scale to show how much that distance represents on the ground.
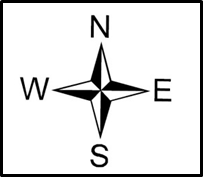
All maps should have some sort of diagram depicting at least one, but sometimes all, of the cardinal directions (north, south, east, and west) that the map reader can use to orient the map. This diagram is called a compass rose (Figure 21). It is important to check the compass rose when beginning to read a map to determine the direction in which the map is oriented (i.e., which direction is at the top of the map).
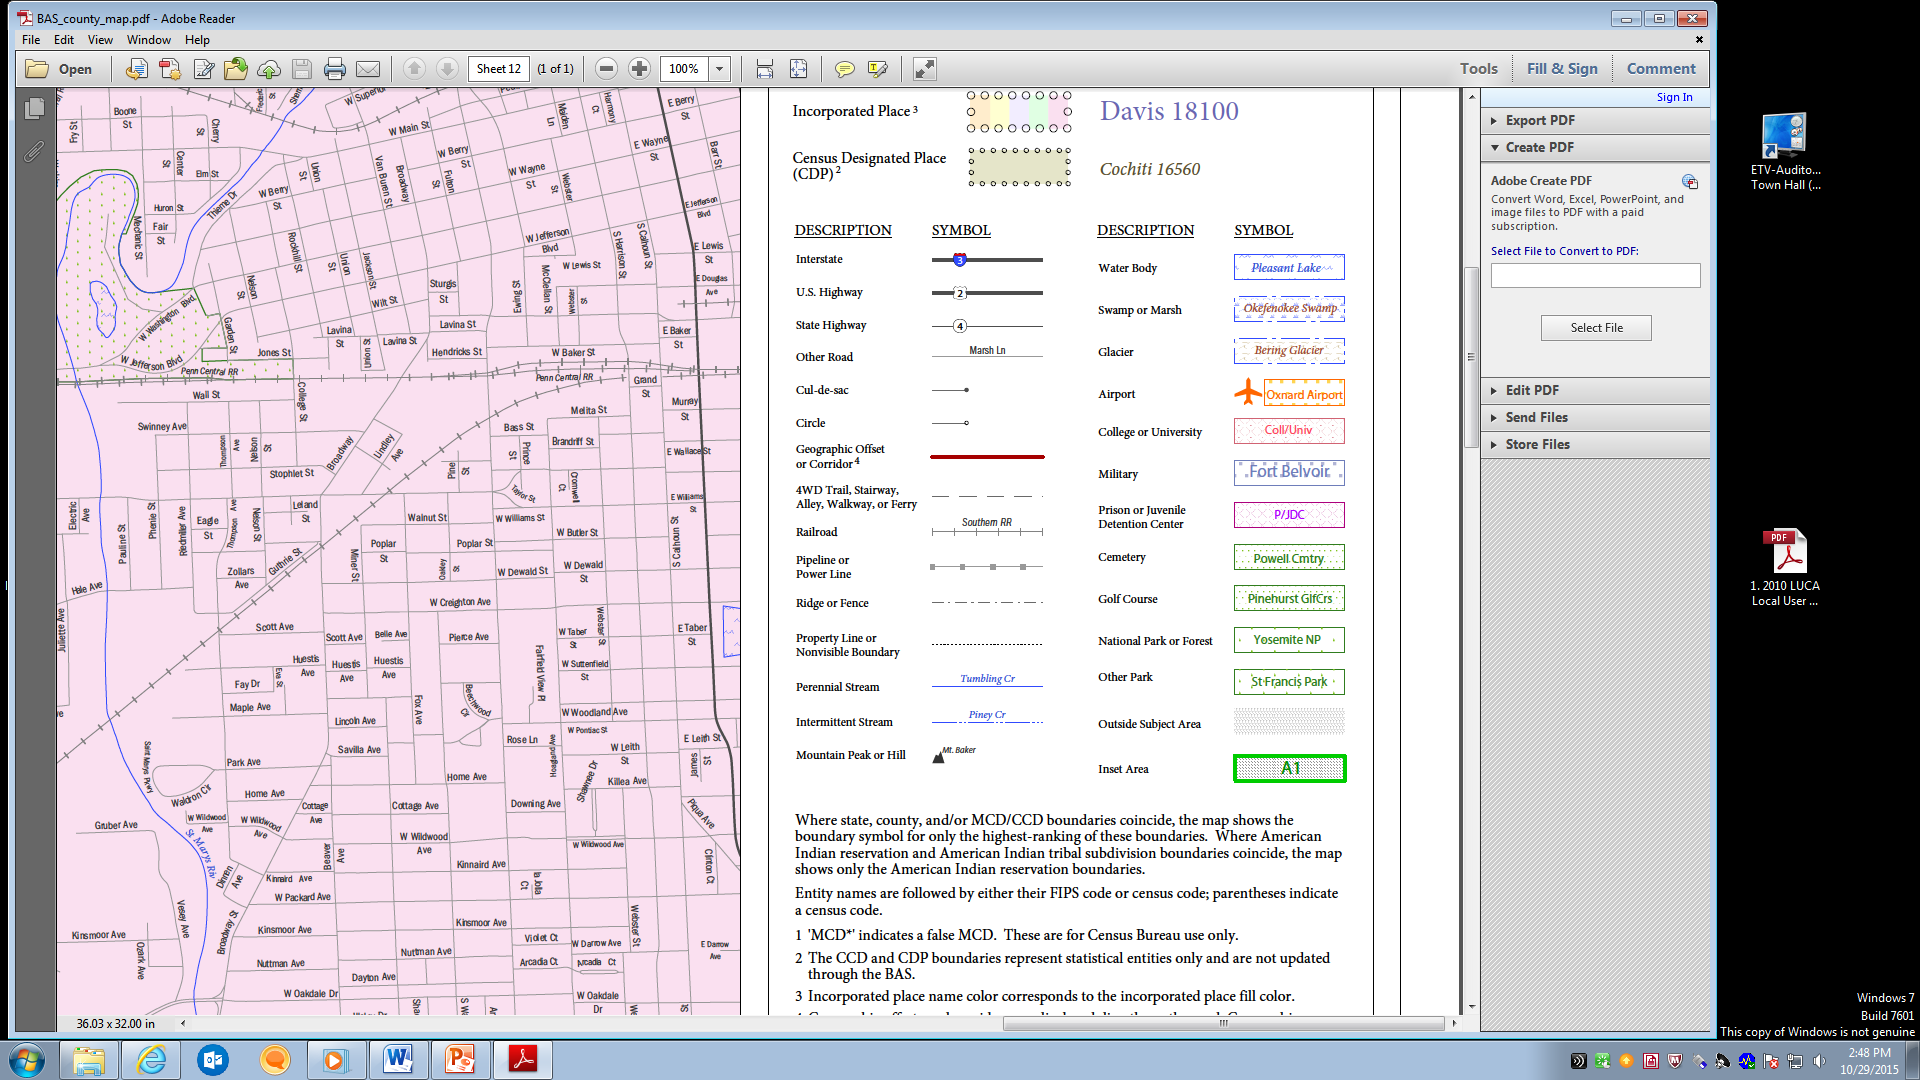
Because a map is a graphic representation of a real-world area, it is necessary, and convenient, to symbolize real world features with representative symbols. In order to describe what each symbol means, most maps have a legend (Figure 22). Typically, the legend will have a small example of each symbol (e.g., a line or a picture of a tent), and next to the symbol, in text, a brief description of what is being depicted (e.g., “road” or “campground”).
Sometimes a map needs to depict multiple features concurrently. This is because some lines are the boundaries of multiple geographies at the same time (i.e., a county boundary can also be a city boundary, a voting district boundary, and even a highway or river). Such instances can be depicted in various ways, but Census Bureau maps depict coincident lines by alternating the symbols for each type of line as shown in Figure 23. In other words, if a line is both a county boundary (symbolized by a series of squares) and a city boundary (a series of circles), that boundary will be depicted as a series of alternating squares and circles for the length of the concurrency.
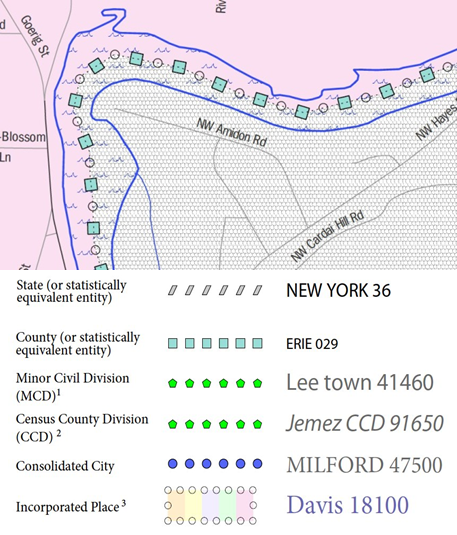
Figure 23. Map Depicting Multiple Concurrent Boundaries
In situations where higher-level geographies (e.g., national, state, county, or county subdivisions) coincide, the Census Bureau’s maps display only the symbol of the highest-ranking of these boundaries. In other words, if a particular boundary is shared by both a state and county, only the symbol representing the state boundary will be displayed.

![]()
| File Type | application/vnd.openxmlformats-officedocument.wordprocessingml.document |
| File Title | BAS Paper How-to Guide |
| Author | U.S. Census Bureau |
| File Modified | 0000-00-00 |
| File Created | 2025-10-01 |
© 2026 OMB.report | Privacy Policy