Techincal Guidance
[OADPS] The Performance Measures Project: Improving Performance Measurement and Monitoring by CDC Programs
AttA_OD2A LOCAL PM Technical Guidance_MAY 2025
[OADPS] OD2A-LOCAL Cooperative Agreement (# CD23-0003)
OMB: 0920-1282
Form approved:
OMB Control Number: 0920-1282
Expiration date: 06/30/2026
OD2A: LOCAL
Performance Measures Technical Guidance
Centers for Disease Control and Prevention
Division of Overdose Prevention
Prevention Programs and Evaluation Branch
May 2025
CDC estimates the average public reporting burden for this collection of information as 35 hours annually per response from each recipient, including the time for reviewing instructions, searching existing data/information sources, gathering and maintaining the data/information needed, and completing and reviewing the collection of information. An agency may not conduct or sponsor, and a person is not required to respond to a collection of information unless it displays a currently valid OMB control number. Send comments regarding this burden estimate or any other aspect of this collection of information, including suggestions for reducing this burden to CDC/ATSDR Information Collection Review Office, 1600 Clifton Road NE, MS D-74, Atlanta, Georgia 30333; ATTN: PRA (0920-1282)
Acknowledgments
We want to acknowledge everyone who played a crucial role in the development of performance measures for OD2A: Limiting Overdose through Collaborative Actions in Localities (OD2A: LOCAL). This would not have been possible without the dedication, expertise, and collaboration of a diverse group of public health partners. Special thanks to the subject matter experts (SMEs) at the Centers for Disease Control and Prevention (CDC), whose invaluable insights and domain knowledge shaped the selection and prioritization of indicators. Thank you also for the active engagement of our recipients during the initial performance measures webinar, whose feedback provided essential perspectives and ensured the relevance of our measures. Finally, thank you to the evaluators from the Program Evaluation Team, who each played a critical role in the development of this guide. This collective effort underscores the spirit of collaboration and commitment that defines our work in OD2A: LOCAL.
Contents
OD2A: LOCAL Performance Measures 6
Indicator Reference Sheets for Each Performance Measure 8
Introduction
This technical guidance is specifically developed to support recipients of Overdose Data to Action: Limiting Overdose through Collaborative Actions in Localities (OD2A: LOCAL) in their reporting of performance measures, also referred to as indicators. Performance measures will be reported by recipients during the period of funding to track progress on key interventions and outcomes as outlined in the Notice of Funding Opportunity (NOFO).
This Technical Guidance document includes:
Introduction
Snapshot of performance measures
Detailed descriptions of each performance measure
Reporting timeline and guidance
The primary goal of performance measures in OD2A: LOCAL is to provide a common set of indicators that will be used by recipients and their partners to monitor progress and identify areas for improvement. Performance measures data can be used to help:
Recipients show progress and communicate progress to their health department leadership.
CDC and recipients inform future CDC programmatic investments.
CDC and recipients understand the contributions of OD2A: LOCAL across overdose prevention strategies and use data for programmatic improvement.
CDC communicate with Health and Human Services (HHS) and other federal policymakers about the progress made under OD2A: LOCAL.
At CDC, these performance measures are not meant to compare jurisdictions to each other, but rather to monitor progress for a recipient over time and to examine OD2A: LOCAL as a program, overall. By establishing and regularly monitoring performance measures, recipients can identify areas of strength, pinpoint challenges, and align their efforts with intended objectives, ultimately fostering accountability and continuous enhancement within their programs.
We strive for high-quality data reported across performance measures. High-quality data ensure that the information collected is accurate, consistent, and reflective of the true impact of program activities. Addressing data quality requires a proactive approach to include staff training, standardized data collection protocols, regular data quality assurance checks, and continuous monitoring and improvement processes. Investing in data quality enhances the credibility of performance measures, supporting evidence-based decision-making and ensuring the program's overall success. Consider the following:
Accuracy – The information collected should clearly and adequately measure the indicator within a plausible range.
Consistency – Written documentation of data collection and analysis methods can ensure the same procedures are followed each time.
Timeliness – The information collected should be available to inform program management decisions and it should represent the most current data available. Reporting the data soon after it is collected is a good practice and can help to reflect the true impact of program activities.
Integrity – Safeguards should be established to minimize the risk of bias or errors in data transcription. This may be achieved by having more than one person conduct the data transcription. In addition, there should be independence in key data collection, management, and assessment procedures and mechanisms to prevent unauthorized changes to the data.
We are asking OD2A: LOCAL recipients to keep us informed if you identify any data quality concerns and challenges in data collection or reporting processes that could affect data quality. Each of the performance measures includes data quality and contextual questions in which any data quality concerns should be shared with CDC. Ultimately, we want to ensure that performance measure data we review and share account for any needed caveats regarding data quality.
OD2A: LOCAL Performance Measures
There are 8 performance measures. There are 7 quantitative measures and 1 qualitative measure. The labels and brief descriptions are listed here for a quick reference. All quantitative data should be answered in the Excel reporting tool. All qualitative questions including HE_Impact, contextual questions, and data quality questions should be reported directly in Partner’s Portal.
Quick View
Icon |
Label Name |
Performance Measure |
|
|
Impactful practices for improving access to care and treatment for disproportionately affected populations |
||
|
Number of health impact focused overdose prevention interventions focused on disproportionately affected populations implemented with OD2A funding |
||
|
Number of harm reduction service encounters at OD2A-funded organizations |
||
|
Number of naloxone doses distributed by OD2A-funded organizations |
||
|
Number of hours navigators spent on linkage to care and harm reduction services via warm handoffs |
||
|
Number of referrals to care and harm reduction services |
||
|
Percent of clinicians who received training on implementing the “2022 CDC Clinical Practice Guideline for Prescribing Opioids for Pain” |
||
|
Number of health settings implementing or improving protocols and/or policies for evidence-based substance use disorder (SUD) treatment or referrals |
||
This guide uses a standard format to describe each performance measure. Each indicator reference sheet is organized by an overview of the measure and its key reporting fields. Each indicator reference sheet includes a section on reporting specifications to explain exactly what needs to be reported for each performance measure. Each quantitative measure includes required and optional disaggregates, contextual questions, and data quality questions. Contextual questions are required and help recipients explain any nuances in the data and provide a fuller picture of the quantitative measures. Data quality questions are included for you to provide information about the data reported to help explain representativeness, completeness, and other data quality considerations.
Label |
Used to give a shorthand to each measure. |
Name |
Descriptive name of performance measure. |
Primary Unit of Measure |
Quantitative value (e.g., count or percentage). |
Numerator |
Suggested numerator (included if there is a denominator). |
Denominator |
Suggested denominator (if applicable) |
Disaggregates |
The separation of indicators into smaller units to identify underlying trends and patterns. Allows for understanding how subgroups are differently impacted. All disaggregates are required unless otherwise noted as optional. |
Reporting Specifications |
Descriptions that operationalize how to report each measure to CDC. |
Contextual Questions |
Questions to improve CDC’s understanding of numeric data. As a complement to the reported performance measures data, recipients are asked to provide qualitative contextual explanatory information. |
Data Quality |
Specific questions for which recipients should describe data quality and representativeness of the data, for example, issues or concerns with respect to data quality and completeness. |


Indicator Reference Sheets for Each Performance Measure


HE_Impact
Impactful practices for improving access to care and treatment for disproportionately affected populations
Key Reporting Fields
Primary Measure |
This is a qualitative measure. It is a narrative description of the impactful practices you observe in your jurisdiction that improve access to care and treatment for PWUD. There is no quantitative reporting required for this performance measure. This may be reported in Partner’s Portal. |
Disaggregates |
N/A |
Reporting Specifications |
The following format is recommended for reporting this qualitative indicator:
The length of the narrative should be succinct, but each impactful practice* should have a descriptive paragraph if more than one is outlined.
*Note: If your jurisdiction or partners have not implemented any impactful practices at the time of reporting, please note in the relevant data submission field “no practices have been implemented to improve access to care and treatment to date.” |
Contextual Questions |
|
Data Quality |
|
HE_Activities
Number
of health impact overdose prevention interventions focused on
disproportionately affected populations implemented with OD2A funding
Key Reporting Fields
Primary Unit of Measure |
Total count of health impact activities |
Disaggregates |
Settings
|
Reporting Specifications |
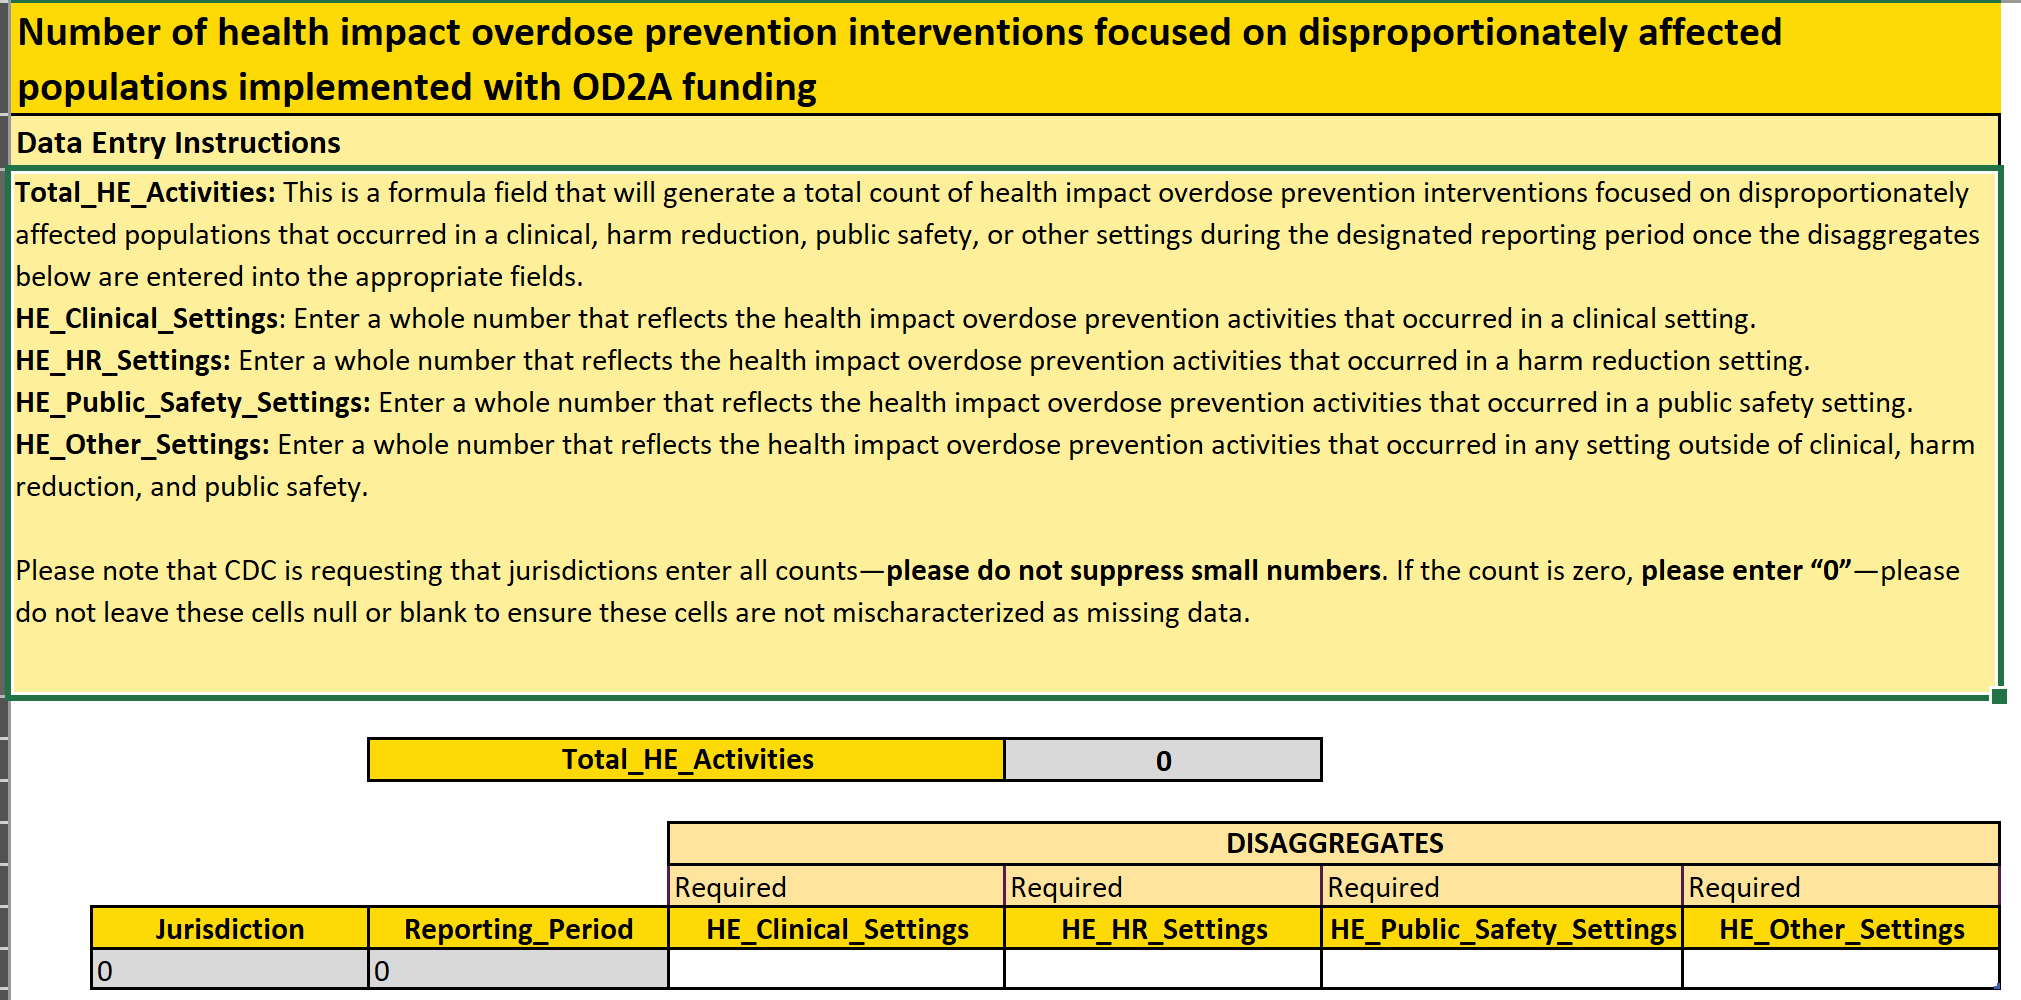
Total_HE_Activities This is a formula field that will generate a total count of health impact overdose prevention interventions focused on disproportionately affected populations that occurred in a clinical, harm reduction, public safety, or other settings during the designated reporting period once the disaggregates below are entered into the appropriate fields.
HE_Clinical_Settings Enter a whole number for the health impact overdose prevention activities that occurred in a health/clinical setting.
HE_HR_Settings Enter a whole number for the health impact overdose prevention activities that occurred in a harm reduction setting.
HE_Public_Safety_Settings Enter a whole number for the health impact overdose prevention activities that occurred in a public safety setting.
HE_Other_Settings Enter a whole number that reflects the health impact overdose prevention activities that occurred in any setting outside of clinical, harm reduction, and public safety.
|
Contextual Questions |
|
Data Quality |
|
 HR_Encounters
Number of harm reduction service encounters at organizations funded or supported by OD2A
Key Reporting Fields
Primary Unit of Measure |
Total count of harm reduction service encounters |
Disaggregates |
Selected harm reduction services:
Locations where harm reduction services were provided:
|
Reporting Specifications |
Total_HR_Encounters This is a formula field that will generate a total count of harm reduction service encounters (e.g., in-person, mail, telephone, online) that occurred at OD2A: LOCAL funded organizations during the designated reporting period once the data are entered by zip code into the appropriate fields. Note the total is calculated from the data entered by zip code, not the encounters with drug checking disaggregates.
Encounters_with_Drug_Checking Enter a whole number for service encounters where drug checking occurred.
Encounters_with_People_High_Risk This disaggregate is optional. If chosen, enter a whole number for service encounters with people at highest risk of overdose and/or with populations disproportionately affected by overdose.
|
Reporting Specifications (continued) |
ZipCode_By_HR_Service_Site Enter the five-digit zip code for each site where harm reduction services (e.g., in-person, mail, telephone, online) were provided. For any service site where services are provided in person, use the brick-and-mortar location zip code. For services provided via phone or mail, use the address of the brick-and-mortar location. For mobile-based outreach services, use the zip code of where the outreach encounter happened. For any service sites where zip codes are unknown, provide the total number of encounters that occurred across locations with unknown zip codes in the designated cell for “unknown” within the reporting tool.
Num_Encounters_ZipCode Enter a whole number for service encounters for each zip code provided. When the zip code is “unknown” total the remaining encounters and enter a whole number.
|
Contextual Questions |
___% at brick and mortar locations ___% via mobile-based outreach services ___% via mail-based delivery ___% other (please specify)
|
Data Quality |
|
 HR_Naloxone
Number of naloxone doses distributed by OD2A-funded or supported organizations
Key Reporting Fields
Primary Unit of Measure |
Total count of pre-measured naloxone doses distributed |
Disaggregates |
|
Reporting Specifications |
Total_Naloxone_Distributed This is a formula field that will generate a total count of doses of naloxone that were distributed by OD2A-funded organizations during the designated reporting period once the disaggregates below are entered into the appropriate fields.
Type_of_Organization This variable has been pre-selected. If data are not available for a particular type of organization, enter 0 in the adjacent row.
Num_Doses_Distributed Enter a whole number for the count of all pre-measured naloxone doses distributed for each type of organization. |
Reporting Specifications (continued) |
ZipCode_By_DistributionSite Enter the five-digit zip code where the funded organization distributed their doses of naloxone. For any distribution site where the zip code is unknown, provide the total in the adjacent cell.
Num_Doses_Distributed_ZipCode Enter a whole number for the count of pre-measured naloxone doses distributed for each zip code. When the zip code is “unknown” total the remaining doses distributed and enter a whole number. |
Contextual Questions |
|
Data Quality |
|
LTC_Navigator_Hours
Number
of hours navigators spent on linkage to care (LTC) and harm reduction
services
Key Reporting Fields
Primary Unit of Measure |
Total count of hours navigators spent on linkage efforts with PWUD
|
Disaggregates |
Entry points where navigators are primarily located:
|
Reporting Specifications |
Total_Navigator_Hours This is a formula field that will generate a total count of hours navigators spent linking PWUD to care and/or harm reduction services once the disaggregates below are entered into the appropriate fields.
Navigator_Hours_Clinical Enter a whole number for the total hours navigators have spent on linkage to care or referral efforts in health/clinical settings.
Navigator_Hours_HR Enter a whole number for the total hours navigators have spent on linkage to care or referral efforts in harm reduction settings.
Navigator_Hours_Public_Safety Enter a whole number for the total hours navigators have spent on linkage to care or referral efforts in public safety settings.
Navigator_Hours_Other Enter a whole number for the total hours navigators have spent on linkage to care or referral efforts in any other settings.
Note: Hours should be reported in whole hours. |
Contextual Questions |
|
Data Quality |
|
LTC_Referrals
Number
of referrals to care and harm reduction services
Key Reporting Fields
Primary Unit of Measure |
Total count of unique referrals
Note: If you refer one individual to both MOUD and harm reduction services, you would account for 2 different referrals as you will report by each service. If you refer the same individual multiple times, they would be counted multiple times. This indicator does not count unique individuals, but rather referral encounters. |
Disaggregates |
Types of care/service referrals:
Demographics of people who are referred:
|
Reporting Specifications |
Total_Referrals This is a formula field that will generate a total count for all referrals to MOUD, behavioral health treatment only (without MOUD), and harm reduction services.
Race_Ethnicity This variable has been pre-selected. If data are not available for a particular race and ethnicity, enter 0 for all variables in the adjacent row. Note: when the race_ethnicity is marked unknown, this also includes if an individual preferred not to answer.
Ref_MOUD Enter a whole number for all referrals to MOUD for each race and ethnicity with available data.
Ref_Behavioral_Trt Enter a whole number for all referrals to behavioral health treatment only (without MOUD) for each race and ethnicity with available data. Ref_to_HR Enter a whole number for all referrals to harm reduction services for each race and ethnicity with available data. |
Reporting Specifications (continued) |
Total_Ref_Race_Ethnicity This is a formula field that will generate a total count for all referrals to MOUD, behavioral treatment only (without MOUD) and harm reduction services by each race and ethnicity.
|
Contextual Questions |
Types of Impactful Referrals
Reporting Partners
|
Data Quality |
|
HS_Training
Percent of clinicians who received training on implementing the “2022 CDC Clinical Practice Guideline for Prescribing Opioids for Pain”
Key Reporting Fields
Primary Unit of Measure |
Percent of clinicians trained |
Numerator |
Count of clinicians trained |
Denominator |
Count of eligible clinicians *We recognize not all jurisdictions will have a training model that lends itself to collecting a denominator and we will work with recipients on a case-by-case basis. |
Disaggregates |
|
Reporting Specifications |
Total_Percentage_trained This is a formula field that will generate a percentage of clinicians trained on implementing the 2022 CDC Clinical Practice Guidelines for Prescribing Opioids for Pain once the numerator and denominator are entered into the appropriate fields for each specialty.
Specialty This variable has been pre-selected. If data are not available for a particular specialty, enter 0 for all variables in the adjacent row.
Num_Trained Enter a numerator for the unique clinicians trained on implementing the 2022 CDC Clinical Practice Guidelines for Prescribing Opioids for Pain for each specialty. |
Reporting Specifications (continued) |
Num_Eligible Enter a denominator for all eligible individuals who could be trained on implementing the 2022 CDC Clinical Practice Guidelines for Prescribing Opioids for Pain for each specialty.
Percent_Clinician_Trained This is a formula field that will generate a percentage of clinicians trained for each specialty once the numerator (Num_Trained) and denominator (Num_Eligible) are entered into the appropriate fields.
|
Contextual Questions |
|
Data Quality |
|
HS_SUD_Protocols
Number
of health settings implementing or improving protocols and/or
policies for evidence-based SUD treatment or referrals
Key Reporting Fields
Primary Unit of Measure |
Total count of health settings |
Disaggregates |
|
Reporting Specifications |
Total_Health_Settings Enter the total count of health settings where protocols and/or policies have been implemented/improved for evidence-based SUD treatment and/or referrals. Note this will be the number of unique health settings, regardless of whether they have just one or both types of protocols/policies.
Num_Settings_SUD_Treatment Enter a whole number for the health settings where protocols or policies have been implemented/improved for evidence-based SUD treatment.
Num_Settings_SUD_Referrals Enter a whole number for the health settings where protocols or policies have been implemented/improved for evidence-based SUD referrals. |
Contextual Questions |
|
Data Quality |
|
Reporting
OD2A: LOCAL recipients are expected to report on all performance measures on an annual basis. We have selected a short list of measures we believe are feasible for most recipients to report on. This does not limit what individual health departments want to collect and analyze for your own uses, and individual recipients can examine their capacities to collect, analyze, and disseminate additional performance measure data.
Data collection may be ongoing in each individual health department with partners reporting to health departments monthly or quarterly at minimum to allow for discussion and potential course corrections early on. As part of the performance measures submission, DOP staff at the CDC commit to review the data, engage with recipients in discussion of the data, and learn from health departments’ experiences and expertise gathered through prior and ongoing efforts to collect data and further strengthen overdose prevention programs. Once data quality is at a sufficient place, the CDC will share data reports back to individual recipients with their own data. CDC will use the performance measures data along with data from work plans, APRs, and other sources to craft case studies and data stories to share with CDC leadership, Health and Human Services, and other federal policymakers. We will share these with recipients as well. CDC will find opportunities for mutual learning, growth, and sharing best practices so that we can all learn from each other.
The current plan is for recipients to report performance measure data in Partner’s Portal. The 1 qualitative performance measure, contextual questions, and data quality questions will be submitted directly into the Partner’s Portal platform. Data for the 7 quantitative measures along with their disaggregates will be submitted using the Excel tool we developed—the Excel tool will be submitted as an attachment within Partner’s Portal. The Excel tool has a tab titled, “Start Here.” Please read the information on that tab before entering data.
Please note that the CDC is requesting that jurisdictions enter all counts—please do not suppress small numbers. All numbers will be available to the CDC OD2A: LOCAL Program Evaluation Team, and small counts will not be shared with anyone outside the support team. The CDC OD2A: LOCAL Program Evaluation Team will aggregate small counts before any data are shared, and we will consult with recipients on plans to share data. If the count is zero, please enter “0”—please do not leave these cells null or blank to ensure these cells are not mischaracterized as missing data.
Performance measures will be reported using the Partner’s Portal (see reporting process above). To aid in data collection with your partners and provide a clearer roadmap for data collection including required and optional disaggregates, we have developed an Excel-based tool, OD2A: LOCAL Performance Measure Reporting Tool.
Example of OD2A: LOCAL Performance Measure Reporting Tool.
| File Type | application/vnd.openxmlformats-officedocument.wordprocessingml.document |
| Author | Geller, Amanda (CDC/NCIPC/DOP) |
| File Modified | 0000-00-00 |
| File Created | 2025-07-04 |
© 2026 OMB.report | Privacy Policy