Equine 2026 SS Part B FINAL 20251217
Equine 2026 SS Part B FINAL 20251217.docx
Equine 2026 Study
OMB: 0579-0269
October 2025
Supporting Statement
Center for Epidemiology and Animal Health (CEAH)
National Animal Health Monitoring System (NAHMS) Equine 2026 Study
OMB Control Number 0579-0269
Part B
B. Collections of Information Employing Statistical Methods
1. Describe (including a numerical estimate) the potential respondent universe and any sampling or other respondent selection method to be used. Data on the number of entities (e.g., establishments, State and local government units, households, or persons) in the universe covered by the collection and in the corresponding sample are to be provided in tabular form for the universe as a whole and for each of the strata in the proposed sample. Indicate expected response rates for the collection as a whole. If the collection had been conducted previously, include the actual response rate achieved during the last collection.
Phase I of the Equine 2026 Study will include a survey focusing on the health and management of equids1 on equine operations, while Phase II of the Study will include a survey on biosecurity and management of equids at equine events2, with optional biological testing for select pathogens of interest. The potential respondent universe for Phase I of the Equine 2026 Study is all operations on the National Agricultural Statistics Service (NASS) frame with 5 or more equids in all 50 States. See Table A.1 in Appendix A for the historical size of the population of operations with one or more equids, which is the closest published data to the potential respondent universe. NASS unpublished data were used internally for the sampling design.
The potential respondent universe for Phase II of the Equine 2026 Study is all equine events in 30 States3 that can be gathered from online sources and that are likely to draw participants from at least a large portion of a State or from out of State. Events that only draw participants from the local areas within the State where they are held will be excluded. A national list of equine events is not available from NASS or other sources, so the Animal and Plant Health Inspection Service (APHIS)–National Animal Health Monitoring System (NAHMS) will build a list for the study, as was done for the NAHMS Equine 2005 study of equine events.
For the Equine 2005 study4, a total of 3,379 events (2,018 unique events, accounting for events repeated throughout the year) were compiled and organized by state (California, Colorado, Florida, Kentucky, New York, and Texas) and study scope (State, regional, and national, with the same definitions as single State; multi-State, adjacent; and multi-State, non-adjacent, respectively, given below). Two-phase samples of approximately 60 events were taken within each of the 6 study States with the first phase being a systematic random sample among events not recurring a substantial number of times throughout the year and a stratified random sample of event occurrences among events recurring a substantial number of times throughout the year. Of the 367 events selected, 34 were not held or were cancelled and of the 333 remaining events, 252 (75.7 percent of held events) completed the study questionnaire. Only 57 events (17.1 percent of held events) were inaccessible.
A preliminary list of events for the Equine 2026 Study was constructed using the information collected from a select list of online websites. This list is detailed in Table A.3 and Figures A.5 and A.6 in Appendix A. Appendix E includes a more comprehensive list of sources intended to be used for the final list frame of events from which the sample will be selected. While it is unknown what the coverage of events was for the Equine 2005 Study and it is unknown what the coverage of events will be for the Equine 2026 Study, since there is no comprehensive list of equine events in the United States, extensive efforts to compile a list that is as comprehensive as possible of equine events held in the study states is being made, as was done in 2005. A broad variety of resources are planned to be used to identify events, including web searches through equine association and eventing websites, social media and blog posts, and news outlets, in addition to collaboration with Equine Association members, equine subject matter experts from the government at the Federal and State levels and at university and extension offices. Appendix E contains more information on the resources being considered for list frame building, and information on the resources used to compile the list for the Equine 2005 study are listed in Appendix II of the Equine 2005 Descriptive Report.
Phase I of the Study is of similar design, scope, and focus of previous APHIS– NAHMS Equine studies, conducted in 1998, 2005, and 2015. Phase I will consist of a single questionnaire administered to equine operation contacts, with a focus on equine health and management. Phase II of the study will not include the same equine operation contacts that were a part of Phase I. Phase II will focus on equine events, similar to the NAHMS Equine 2005 Events study, which was conducted in six States (California, Colorado, Florida, Kentucky, New York, and Texas).
One goal of APHIS–NAHMS national study design is to include States that account for at least 70 percent of the animals and operators/producers in the United States. Phase I will include all 50 States and so satisfies these requirements. This choice was made to ensure maximal representation of equine health, management, and biosecurity across the United States and was done in response to Study stakeholder input and conversations with NASS statisticians on the design of the Study. For Phase II, the 30 selected States account for 83.0 percent of the events in the preliminary selection of listed events. See Table A.3 and Figures A.5 and A.6 in Appendix A for more information on the state selection for Phase II.
Completion rates for Phase I of previous NAHMS Equine and related NAHMS studies are listed in Table C.1 and completion rates for the biologics components of the NAHMS Equine 2015 and NAHMS Goat 2019 studies are presented in Table C.2. Briefly, it is expected that the completion rate to Phase I will be 30 percent (approximately the average of the response rates to the studies from NAHMS Equine 2015 through NAHMS Bison 2022). It is expected that the response rate for the Phase II event questionnaire will be 30 percent as well. For the events that have a completed questionnaire, it is expected that approximately 60 percent (approximately the average of the completion rate across biologics types for NAHMS Equine 2015 and NAHMS Goat 2019) will elect to complete the biologics sampling. Within the events that elect to complete the biologics sampling, it is expected that 60 percent of individuals selected to participate in individual biologics sampling will participate.
Describe the procedures for the collection of information including:
For Phase I of the study, a total sample of approximately 3,600 operations will be sampled from the NASS frame of equine operations with 5 or more equids in the 50 United States. Selected operations will be drawn as a stratified random sample, with strata defined by state and operation size category, with the size categories being as defined below.
Operation size (number of equids)
Small (5–9)
Medium (10–19)
Large (20 or more)
NAHMS and NASS staff will work together to allocate the sample based on population count estimates provided by NASS. The sample will be allocated by State and by size category based on a weighted average of inventory and the number of operations within each stratum to select large operations with a larger probability than they would be selected in a simple random sample. Within strata, a simple random sample of equine operations will be selected.
For Phase II of the study, a list frame of equine events occurring from January 2027 through December 2027 will be constructed using the resources listed in Appendix E. From the list, a stratified random sample of events will be selected, with strata defined by State, event scope, and season. Event scope, a categorization of the events based on the intended source of participants, and season are defined as below. Phase II was originally planned to take place in 2026, but it was delayed.
Event scope
Multi-State, non-adjacent: The event is intended to include participants from multiple, non-adjacent States,
Multi-State, adjacent: The event is intended to include participants from multiple, adjoined States, or
Single State: the event is intended to include participants only from an entire state.
Season (months)
Winter (January 2027–February 2027, December 2027)
Spring (March 2027–May 2027)
Summer (June 2027–August 2027)
Fall (September 2027–November 2027)
The event sample will be allocated uniformly by State, event scope, and season strata so that there will be two to three events per stratum to allow for a primary event to be contacted in that stratum with one or two backup events in case the first event is inaccessible or refuses participation while still allowing coverage of the scopes and seasons expected to have impacts on biosecurity risks, practices, and disease pathogen presence.
The sampling design is a stratified random sample with unequal probabilities of selection across sampling strata. Statistical estimation will be undertaken using either SAS survey procedures or SUDAAN. Both software packages use a Taylor series expansion to estimate appropriate variances for the stratified, weighted data. Phase I selection weights and Phase II selection weights, constructed using the built list frame of equine events, will be adjusted for nonresponse, calibrated to known population totals, and trimmed if necessary.
NAHMS’ goal is to produce descriptive statistics (proportions or means) with a coefficient of variation (CV) of 20.0 percent or less. If possible, given adequate response rates, reporting will be at the national, regional, and operation size levels, with operation size being defined as above and region being defined as below. In addition, reporting for specific tables will be broken out by primary function of the operation and primary use of the equids on the operation, where sample size and precision requirements are met.
Region (States)
West (Alaska, Arizona, California, Colorado, Hawaii, Idaho, Montana, New Mexico, Nevada, Oregon, Utah, Washington, Wyoming)
South (Alabama, Arkansas, Florida, Georgia, Kentucky, Louisiana, Mississippi, North Carolina, Oklahoma, South Carolina, Tennessee, Texas)
North Central (Iowa, Illinois, Indiana, Kansas, Michigan, Minnesota, Missouri, North Dakota, Nebraska, Ohio, South Dakota, Wisconsin)
Northeast (Connecticut, Delaware, Massachusetts, Maryland, Maine, New Hampshire, New Jersey, New York, Pennsylvania, Rhode Island, Vermont, West Virginia, Virginia)
Primary function of the operation
Equine boarding stable/training
Riding stable
Equine breeding farm
Farm/ranch
Residence with equids for personal use
Other
Primary use of the equids on the operation
Pleasure/recreation
Lessons/school
Showing/competition not betting
Breeding
Farm or ranch work
Other
For Phase I, to meet the precision criteria within each of the given stratification cells, we require an overall sample size of approximately 900 assuming that a simple random sample with a perfect response rate is taken. However, due to practical considerations, we must account for the expected completion rate of approximately 30.0 percent and an expected design effect of approximately 1.2 (derived from a sample of questions from NAHMS Equine 2015) to obtain estimates meeting the precision criterion of aiming for a CV of 20.0 percent or less. An overall sample size of 3,600 is required after adjusting for these factors. Tables B.1 and B.2 in Appendix B show estimates of precision based on the total sample of 3,600, Nationally, by region, and by operation size. All the estimated CVs for Phase I are expected to be within the desired range.
For Phase II, field work and budget considerations limited the total completion count to approximately 850 events, where each event would have 1 or 2 backup events in the case of an event being inaccessible or refusing participation. The precision of event-level estimates with this sample size can be found in Tables B.3–B.5 in Appendix B, most of which are below 20.0 percent. The precision of equine-level estimates of pathogen prevalence using the biologics samples are given in Table B.6.
Reporting strata may be adjusted depending on the number of respondents. In general, if sample sizes are too small or CVs too large, those estimates are not published.
There are no unusual problems requiring specialized sampling procedures and data collection cycles.
Any use of periodic (less frequent than annual) data collection cycles to reduce burden:
The data collection described is not planned to be carried out on an annual or less than annual frequency basis.
3. Describe methods to maximize response rates and to deal with issues of non-response. The accuracy and reliability of information collected must be shown to be adequate for intended uses. For collections based on sampling, a special justification must be provided for any collection that will not yield "reliable" data that can be generalized to the universe studied.
The study minimizes collection of data to that which is absolutely necessary to meet the stated objectives. Questionnaires are extensively reviewed by APHIS staff, NASS staff, and industry experts.
The Equine 2026 study lead has made numerous contacts and collaborative efforts to identify the information needs of the equine industry and the best way to ask for that information via questionnaire.
Skip logic is used in both Phase I and Phase II questionnaires to guide respondents to sections relevant to their operation and practices and avoid sections that would not be applicable to their operation.
Data collectors and data handlers will have been trained on data and information security guidelines.
For Phase I data collection, NAHMS staff will develop training materials, including an interviewer’s manual, for NASS enumerators that explain the purpose of the study as well as benefits of participation to equine owners and to the industry, and address anticipated difficulties with questions. NAHMS and NASS will co-lead training meetings with NASS staff and enumerators.
For Phase II data collection, APHIS coordinators and the State and university data collectors will receive specialized training, demonstrations, and materials from NAHMS staff to prepare them for data collection.
Equine owners contacted during Phase I will be mailed introductory information regarding the study so that they know how the study may benefit them and the equine industry and will know what is coming and what is required to complete the study. They will also receive a survey mailing, which will include the questionnaire, and a reminder mailing, and will be followed up with by telephone or in-person visit. Multiple, but limited, contact events have been used in previous NAHMS studies to promote response on a timeline and via a mode that works best for the owner.
Event representatives contacted during Phase II will be mailed, emailed, or texted introductory information regarding the study that will include an overview of the study benefits and requirements and the questionnaire. Federal staff will follow up with them by telephone to schedule a time during which they would like to complete the questionnaire and/or a time during which they would like biological samples to be collected. To align with the event schedules, mailings and telephone calls to event representatives will be made monthly or semi-monthly throughout the data collection period.
The study is supported by the American Horse Council and the American Association of Equine Practitioners. The Equine 2026 study lead will work with representatives from these groups to promote the study.
Promotional materials will be published to announce the upcoming study to potential study participants and stakeholders via stakeholder releases, social media releases, and other communications with industry and related groups.
Thank you cards will be sent to equine owners who complete Phase I and to the event representatives who complete Phase II of the Study. Informational graphics displaying findings from the Study will also be sent to those who complete Phase I and to those event representatives who complete Phase II of the Study.
NASS enumerators have gone through specific training to help them answer questions of reluctant owners to maximize response rates. Training for the APHIS coordinators and the State and university data collectors will include specific suggestions from the previous participants in NAHMS studies based on their experience in avoiding and converting refusals.
Nonresponse adjustment:
Baseline response rates are taken from NAHMS Equine and other previous NAHMS studies and are shown in Tables C.1 and C.2 in Appendix C.
For Phase I, APHIS will adjust selection weights, which will be provided by NASS, for non-response using NASS-supplied stratification variables. Weights of eligible non-respondents will be transferred to responding equine operations that are most similar based on available data, including the State and operation size category stratification variables. The non-response adjustment will use the method of propensity scores, in which a logistic regression model is constructed to predict the probability of responding. The inverse of this probability is the nonresponse adjustment. For Phase II, the propensity score nonresponse adjustment method will be used to adjust the selection weights in a similar way, though the selection weights will be constructed using the list frame of events in the 30 study States, and the strata will be defined by State, event scope, and season.
If the respondents differ substantially from the non-respondents, then there is potential for bias. NASS’ List Frame data may be available for both respondents and non-respondents to allow for examination of potential differences in type of responding and non-responding equine operations. If needed, APHIS will perform a non-response bias analysis to investigate unexpected response patterns to guide future sampling efforts. If significant nonresponse bias is found, the factors contributing to the bias will be incorporated into the nonresponse weight adjustment using post-stratification raking procedures.
Sampling and design strategies:
Multiple mode options for response were chosen to meet the varied response mode preferences of equine owners. Preferred response modes vary across the population, and so making available a selection of response opportunities to fit owner’s schedules and preferences has been important to maximizing response and will continue to be important going forward. Paper-assisted self-interviews (via the mail), computer-assisted self-interviews (via the web), paper- and computer-assisted telephone interviews (via telephone), and paper- and computer-assisted personal interviews (face-to-face) modes will be used.
In-person interview options are planned to be included in both phases of the study. Previous NAHMS studies that included in-person interview options, including the Goat 2019 and Sheep 2024 studies, tend to have greater completion rates compared to studies for which that option is not available.
4. Describe any tests of procedures or methods to be undertaken. Testing is encouraged as an effective means of refining collections of information to minimize burden and improve utility. Tests must be approved if they call for answers to identical questions from 10 or more respondents. A proposed test or set of tests may be submitted for approval separately or in combination with the main collection of information.
APHIS and NASS will review and pretest the survey prior to field enumeration, involving fewer than 10 respondents. APHIS will use the results of these pretests to refine the Phase I and Phase II questionnaires to reduce respondent burden and improve the accuracy and usefulness of the information. The pretested and revised questions from the NAHMS Equine 1998, 2005, and 2015 Studies will be used as a baseline, where possible, to borrow from the work performed during those studies and to ensure that trends on particular topics can be drawn across the studies. The final questionnaires will have been reviewed by a variety of experts, including academic researchers, industry representatives, extension agents, veterinarians, health specialists, and epidemiologists.
5. Provide the name and telephone number of individuals consulted on statistical aspects of the design and the name of the agency unit, contractor(s), grantee(s), or other person(s) who will actually collect and/or analyze the information for the agency.
The statistical aspects of the design were coordinated by:
- Matthew Branan, Mathematical Statistician, formerly with National Animal Health Monitoring System, USDA, APHIS, VS, CEAH, Fort Collins, CO (970-494-7349).
For survey design and methodology and for a NASS review of the OMB package submission, NAHMS will coordinate with survey methodologists reporting to:
- Adam Cline, Chief, Standards and Survey Development Methodology Branch, USDA, NASS, Washington, DC (202-531-6010).
The actual data collection will be conducted by NASS enumerators (Phase I) and APHIS-designated data collectors (Phase II). Contact persons for data collection are:
- Scott Cox, Chief, Survey Administration Branch, USDA, NASS, Washington, DC (202-720-6201).
- Dr. Rosemary Sifford, Deputy Administrator, Veterinary Services, USDA, APHIS, Washington, DC (202-799-7147).
- Dr. Andrea Beam, Acting Assistant Director, National Animal Health Monitoring System, USDA APHIS, VS, CEAH, Fort Collins, CO (352-414-8461).
Analysis of the data will be accomplished by APHIS–NAHMS veterinarians, epidemiologists, and statisticians under the direction of:
- Dr. Andrea Beam, Acting Assistant Director, National Animal Health Monitoring System, USDA APHIS, VS, CEAH, Fort Collins, CO (352-414-8461).
Appendix A: State selection
State selection for Phase I of the study was considered based on the percentage of equine inventory and operations, equine density, and the trends of the counts of equine inventory and operations, by State. Population counts were taken from the 2022 Census of Agriculture data. The overall inventory and operation counts, by operation size, are given in Table A.1, while State-level inventory and operation counts, percentages, and equine density are presented in Table A.2. Historical equine inventory and numbers of equine operations were taken from the same two reports and are depicted in Figures A.1–A.2. For comparison, the States included in previous NAHMS Equine studies are included in Figure A.3 and the proposed regions for the Equine 2026 Study are depicted in Figure A.4.
Table A.1: Number and percentage of inventory of equids and number of operations with equids, by equine type and by operation size (number of equids), from the NASS 2022 Census of Agriculture. |
||||||||||
|
Inventory |
Operations |
||||||||
|
Horses and ponies |
Mules, burros, and donkeys |
All equids |
Horses and ponies |
Mules, burros, and donkeys |
|||||
Operation size (number of equids) |
No. |
Pct. |
No. |
Pct. |
No. |
Pct. |
No. |
Pct. |
No. |
Pct. |
1 to 24 |
1,745,499 |
72.4 |
238,152 |
92.4 |
360,034 |
96.6 |
98,386 |
99.7 |
1,745,499 |
72.4 |
25 to 49 |
298,591 |
12.4 |
8,407 |
3.3 |
9,215 |
2.5 |
264 |
0.3 |
298,591 |
12.4 |
50 to 99* |
172,407 |
7.2 |
11,266 |
4.4 |
2,651 |
0.7 |
76 |
0.1 |
172,407 |
7.2 |
100 or more |
194,735 |
8.1 |
|
|
910 |
0.2 |
|
|
194,735 |
8.1 |
Total |
2,411,232 |
100.0 |
257,825 |
100.0 |
372,810 |
100.0 |
98,726 |
100.0 |
2,411,232 |
100.0 |
*Inventory and operations with inventory of mules, burros, and donkeys are published with size categories of 1 to 24, 25 to 49, and 50 or more only. |
||||||||||
Table A.2: Number and percentage of inventory of equids and number of operations with equids, by equine type and by State, from the NASS 2022 Census of Agriculture. Also includes land area (square miles) and equine density (total inventory of horses, ponies, mules, burros, and donkeys per square mile of land area), by State. |
||||||||||||
|
Inventory |
Operations |
Equine density |
|||||||||
|
Horses and ponies |
Mules, burros, and donkeys |
All equids |
Horses and ponies |
Mules, burros, and donkeys |
Land area (mi2) |
Density |
|||||
State |
No. |
Pct. |
No. |
Pct. |
No. |
Pct. |
No. |
Pct. |
No. |
Pct. |
No. |
No. |
AK |
1,237 |
0.1 |
34 |
0.0 |
1,271 |
0.1 |
175 |
0.1 |
15 |
0.0 |
570,641 |
0.0 |
AL |
33,096 |
1.4 |
7,416 |
2.9 |
40,512 |
1.5 |
6,480 |
1.7 |
2,890 |
2.9 |
50,645 |
0.8 |
AR |
37,835 |
1.6 |
6,787 |
2.6 |
44,622 |
1.7 |
7,565 |
2.0 |
2,841 |
2.9 |
52,035 |
0.9 |
AZ |
61,878 |
2.6 |
2,255 |
0.9 |
64,133 |
2.4 |
8,458 |
2.3 |
792 |
0.8 |
113,594 |
0.6 |
CA |
92,831 |
3.9 |
5,607 |
2.2 |
98,438 |
3.7 |
11,077 |
3.0 |
1,910 |
1.9 |
155,779 |
0.6 |
CO |
75,992 |
3.2 |
5,304 |
2.1 |
81,296 |
3.1 |
10,691 |
2.9 |
1,988 |
2.0 |
103,642 |
0.8 |
CT |
9,634 |
0.4 |
706 |
0.3 |
10,340 |
0.4 |
1,071 |
0.3 |
276 |
0.3 |
4,842 |
2.1 |
DE |
3,819 |
0.2 |
147 |
0.1 |
3,966 |
0.2 |
416 |
0.1 |
67 |
0.1 |
1,949 |
2.0 |
FL |
83,114 |
3.5 |
8,689 |
3.4 |
91,803 |
3.4 |
9,832 |
2.6 |
3,299 |
3.3 |
53,625 |
1.7 |
GA |
37,342 |
1.6 |
8,024 |
3.1 |
45,366 |
1.7 |
6,072 |
1.6 |
2,809 |
2.9 |
57,513 |
0.8 |
HI |
4,316 |
0.2 |
279 |
0.1 |
4,595 |
0.2 |
653 |
0.2 |
103 |
0.1 |
6,423 |
0.7 |
IA |
45,033 |
1.9 |
3,133 |
1.2 |
48,166 |
1.8 |
7,306 |
2.0 |
1,292 |
1.3 |
55,857 |
0.9 |
ID |
41,412 |
1.7 |
2,716 |
1.1 |
44,128 |
1.7 |
6,660 |
1.8 |
903 |
0.9 |
82,643 |
0.5 |
IL |
33,348 |
1.4 |
2,854 |
1.1 |
36,202 |
1.4 |
5,506 |
1.5 |
1,273 |
1.3 |
55,519 |
0.7 |
IN |
76,743 |
3.2 |
3,528 |
1.4 |
80,271 |
3.0 |
10,079 |
2.7 |
1,427 |
1.5 |
35,826 |
2.2 |
KS |
42,345 |
1.8 |
3,691 |
1.4 |
46,036 |
1.7 |
7,188 |
1.9 |
1,563 |
1.6 |
81,759 |
0.6 |
KY |
111,402 |
4.6 |
10,770 |
4.2 |
122,172 |
4.6 |
13,767 |
3.7 |
4,316 |
4.4 |
39,486 |
3.1 |
LA |
34,652 |
1.4 |
4,942 |
1.9 |
39,594 |
1.5 |
5,931 |
1.6 |
1,800 |
1.8 |
43,204 |
0.9 |
MA |
13,457 |
0.6 |
830 |
0.3 |
14,287 |
0.5 |
1,422 |
0.4 |
255 |
0.3 |
7,800 |
1.8 |
MD |
26,115 |
1.1 |
1,246 |
0.5 |
27,361 |
1.0 |
2,919 |
0.8 |
618 |
0.6 |
9,707 |
2.8 |
ME |
6,744 |
0.3 |
437 |
0.2 |
7,181 |
0.3 |
1,181 |
0.3 |
221 |
0.2 |
30,843 |
0.2 |
MI |
54,511 |
2.3 |
3,051 |
1.2 |
57,562 |
2.2 |
7,991 |
2.1 |
1,358 |
1.4 |
56,539 |
1.0 |
MN |
40,131 |
1.7 |
3,060 |
1.2 |
43,191 |
1.6 |
6,988 |
1.9 |
1,319 |
1.3 |
79,627 |
0.5 |
MO |
75,250 |
3.1 |
9,486 |
3.7 |
84,736 |
3.2 |
14,489 |
3.9 |
3,825 |
3.9 |
68,742 |
1.2 |
MS |
31,678 |
1.3 |
5,884 |
2.3 |
37,562 |
1.4 |
6,164 |
1.7 |
2,303 |
2.3 |
46,923 |
0.8 |
MT |
63,784 |
2.7 |
2,813 |
1.1 |
66,597 |
2.5 |
8,942 |
2.4 |
1,093 |
1.1 |
145,546 |
0.5 |
NC |
40,097 |
1.7 |
9,410 |
3.7 |
49,507 |
1.9 |
6,803 |
1.8 |
3,631 |
3.7 |
48,618 |
1.0 |
ND |
24,398 |
1.0 |
680 |
0.3 |
25,078 |
0.9 |
3,332 |
0.9 |
329 |
0.3 |
69,001 |
0.4 |
NE |
38,487 |
1.6 |
2,245 |
0.9 |
40,732 |
1.5 |
6,371 |
1.7 |
867 |
0.9 |
76,824 |
0.5 |
NH |
4,869 |
0.2 |
265 |
0.1 |
5,134 |
0.2 |
787 |
0.2 |
131 |
0.1 |
8,953 |
0.6 |
NJ |
20,782 |
0.9 |
1,550 |
0.6 |
22,332 |
0.8 |
2,368 |
0.6 |
562 |
0.6 |
7,354 |
3.0 |
NM |
34,901 |
1.5 |
1,761 |
0.7 |
36,662 |
1.4 |
7,243 |
1.9 |
845 |
0.9 |
121,298 |
0.3 |
NV |
12,055 |
0.5 |
516 |
0.2 |
12,571 |
0.5 |
1,431 |
0.4 |
166 |
0.2 |
109,781 |
0.1 |
NY |
62,404 |
2.6 |
2,793 |
1.1 |
65,197 |
2.4 |
7,148 |
1.9 |
1,257 |
1.3 |
47,126 |
1.4 |
OH |
91,418 |
3.8 |
7,270 |
2.8 |
98,688 |
3.7 |
13,571 |
3.6 |
2,880 |
2.9 |
40,861 |
2.4 |
OK |
100,916 |
4.2 |
14,672 |
5.7 |
115,588 |
4.3 |
17,840 |
4.8 |
5,553 |
5.6 |
68,595 |
1.7 |
OR |
60,127 |
2.5 |
3,459 |
1.3 |
63,586 |
2.4 |
8,795 |
2.4 |
1,425 |
1.4 |
95,988 |
0.7 |
PA |
80,869 |
3.4 |
7,301 |
2.8 |
88,170 |
3.3 |
12,049 |
3.2 |
2,265 |
2.3 |
44,743 |
2.0 |
RI |
1,074 |
0.0 |
57 |
0.0 |
1,131 |
0.0 |
143 |
0.0 |
35 |
0.0 |
1,034 |
1.1 |
SC |
30,673 |
1.3 |
4,893 |
1.9 |
35,566 |
1.3 |
4,934 |
1.3 |
1,958 |
2.0 |
30,061 |
1.2 |
SD |
41,761 |
1.7 |
1,250 |
0.5 |
43,011 |
1.6 |
5,236 |
1.4 |
600 |
0.6 |
75,811 |
0.6 |
TN |
70,919 |
2.9 |
14,614 |
5.7 |
85,533 |
3.2 |
13,355 |
3.6 |
5,437 |
5.5 |
41,235 |
2.1 |
TX |
273,554 |
11.3 |
59,630 |
23.1 |
333,184 |
12.5 |
49,818 |
13.4 |
21,742 |
22.0 |
261,232 |
1.3 |
UT |
49,735 |
2.1 |
3,249 |
1.3 |
52,984 |
2.0 |
7,190 |
1.9 |
799 |
0.8 |
82,170 |
0.6 |
VA |
55,258 |
2.3 |
6,461 |
2.5 |
61,719 |
2.3 |
8,128 |
2.2 |
2,727 |
2.8 |
39,490 |
1.6 |
VT |
7,633 |
0.3 |
319 |
0.1 |
7,952 |
0.3 |
1,012 |
0.3 |
158 |
0.2 |
9,217 |
0.9 |
WA |
44,968 |
1.9 |
2,019 |
0.8 |
46,987 |
1.8 |
7,086 |
1.9 |
893 |
0.9 |
66,456 |
0.7 |
WI |
60,653 |
2.5 |
4,023 |
1.6 |
64,676 |
2.4 |
9,790 |
2.6 |
1,788 |
1.8 |
54,158 |
1.2 |
WV |
17,344 |
0.7 |
3,274 |
1.3 |
20,618 |
0.8 |
4,105 |
1.1 |
1,472 |
1.5 |
24,038 |
0.9 |
WY |
48,638 |
2.0 |
2,425 |
0.9 |
51,063 |
1.9 |
5,252 |
1.4 |
650 |
0.7 |
97,093 |
0.5 |
Total |
2,411,232 |
100.0 |
257,825 |
100.0 |
2,669,057 |
100.0 |
372,810 |
100.00 |
98,726 |
100.0 |
|
|
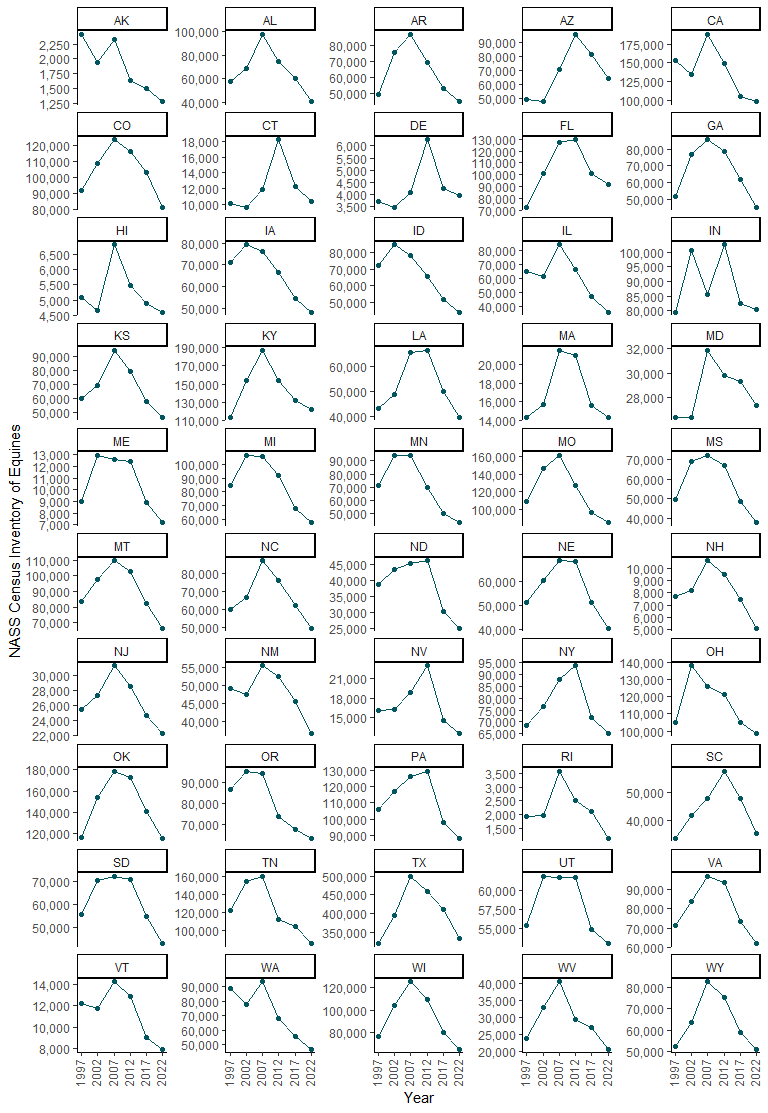
Figure A.1: NASS Census of Agriculture equine inventory, by year 1997 to 2022 and by state.
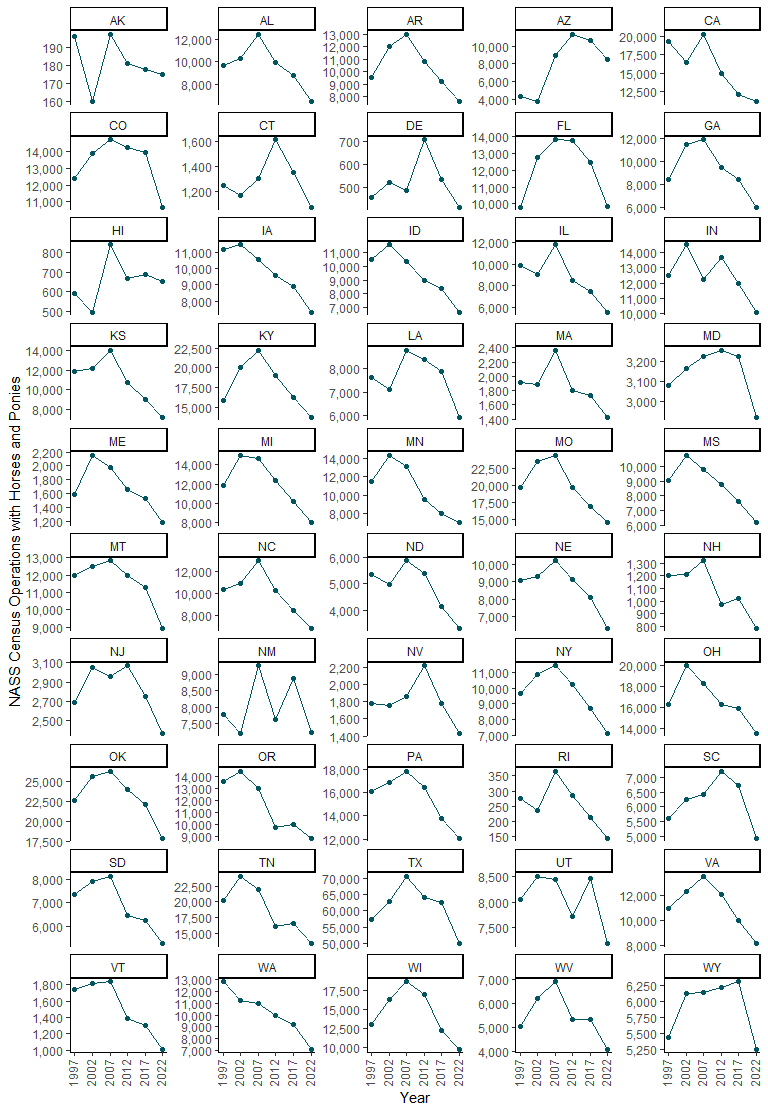
Figure A.2: NASS Census of Agriculture counts of operations with horses and ponies, by year from 1997 to 2022 and by state.
As a comparison, the States included in previous NAHMS Equine studies are depicted in Figure A.3.
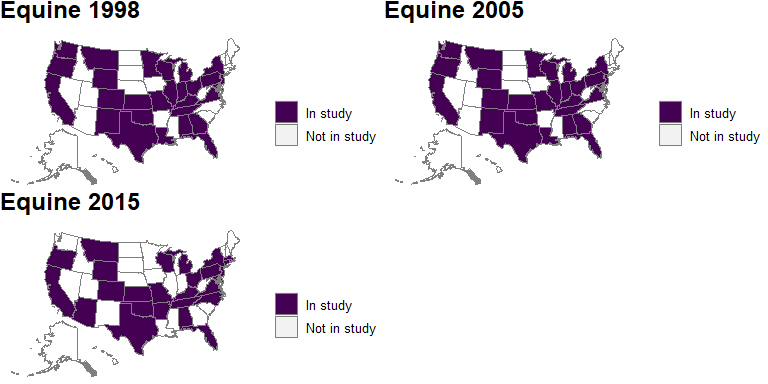
Figure A.3: States included in previous NAHMS Equine studies.
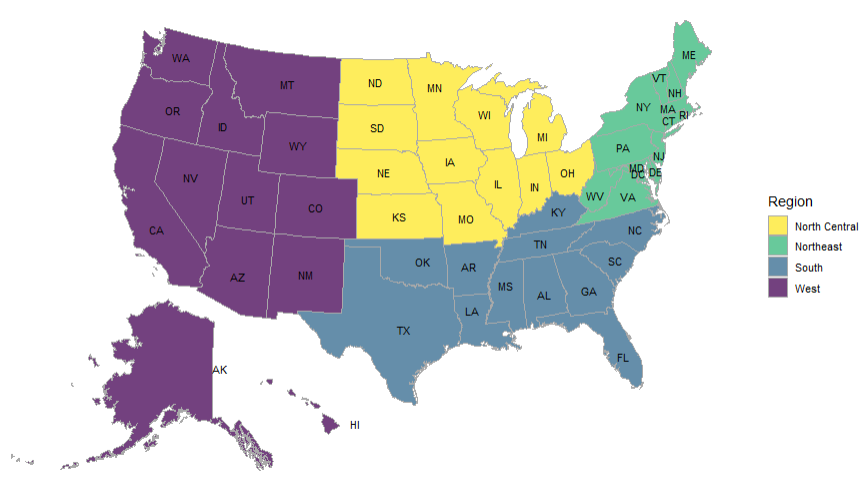
Figure A.4: Proposed regions for the Equine 2026 Study.
For Phase II, we present the findings of a preliminary list of equine events, compiled from the following websites using manual and R-based extraction.
American Quarter Horse Association (AQHA): https://www.aqha.com/
National Cutting Horse Association (NCHA): https://nchacutting.com/
National Reined Cow Horse Association (NRCHA): https://www.nrcha.com/
Pro Rodeo Cowboys Association (PRCA): https://www.prorodeo.com/
United States Equestrian Federation (USEF): https://www.usef.org/
The States for Phase II were selected based on the representation of the percentage of events, input from stakeholders and APHIS field staff coordinators, and geographic representation. The number and percentage of events are presented in Table A.3 and a map of the included States is included in Figure A.5. A bar chart showing the count of events by region and by month of the year is included in Figure A.6.
Table A.3: Number and percentage of events from the preliminary list of equine events, by State. Selected study states are highlighted in grey. |
||
State |
Number of events |
Percentage of events |
AK |
7 |
0.1 |
AL |
53 |
0.9 |
AR |
29 |
0.5 |
AZ |
184 |
3.0 |
CA |
389 |
6.4 |
CO |
215 |
3.5 |
CT |
58 |
1.0 |
DE |
- |
0.0 |
FL |
453 |
7.4 |
GA |
133 |
2.2 |
HI |
4 |
0.1 |
IA |
43 |
0.7 |
ID |
83 |
1.4 |
IL |
81 |
1.3 |
IN |
27 |
0.4 |
KS |
62 |
1.0 |
KY |
110 |
1.8 |
LA |
105 |
1.7 |
MA |
56 |
0.9 |
MD |
50 |
0.8 |
ME |
12 |
0.2 |
MI |
66 |
1.1 |
MN |
168 |
2.8 |
MO |
159 |
2.6 |
MS |
128 |
2.1 |
MT |
118 |
1.9 |
NC |
166 |
2.7 |
ND |
37 |
0.6 |
NE |
109 |
1.8 |
NH |
6 |
0.1 |
NJ |
160 |
2.6 |
NM |
31 |
0.5 |
NV |
100 |
1.6 |
NY |
217 |
3.6 |
OH |
180 |
2.9 |
OK |
151 |
2.5 |
OR |
112 |
1.8 |
PA |
180 |
2.9 |
RI |
2 |
0.0 |
SC |
106 |
1.7 |
SD |
82 |
1.3 |
TN |
145 |
2.4 |
TX |
909 |
14.9 |
UT |
99 |
1.6 |
VA |
128 |
2.1 |
VT |
20 |
0.3 |
WA |
192 |
3.1 |
WI |
67 |
1.1 |
WV |
34 |
0.6 |
WY |
77 |
1.3 |
Total |
6,103 |
100.0 |
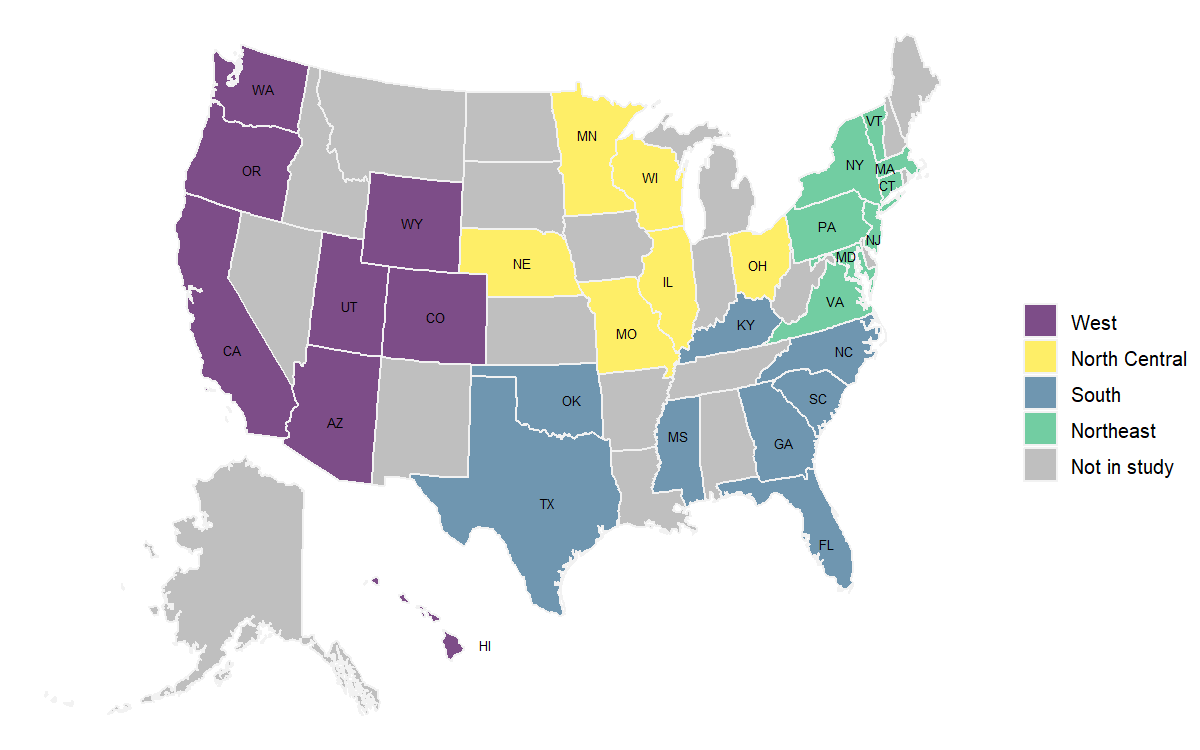
Figure A.5: Selected study States for Phase II of the study, by region.
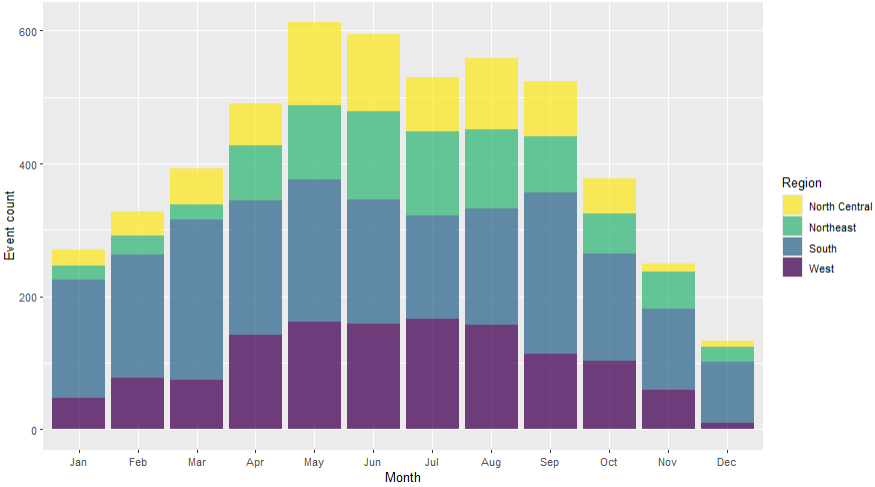
Figure A.6: Counts of events by region and by month of the year, as found during the preliminary list frame construction.
Appendix B: Expected estimates of precision
Estimates of precision are shown for proportions of 0.50, 0.25, and 0.10. None of the Phase I CV estimates exceed 20.0 percent (Tables B.1 and B.2). For Phase II (Tables B.3–B.5), the CV estimates don’t exceed 20.0 percent for proportions of 0.25 or greater, though the CV estimates for proportions of 0.10 are all below 20.0 percent except for three of the four categories when broken out by each of region and season. CV estimates for equine-level estimates of pathogen prevalence (see Table B.6) all exceed 20.0 percent except for the prevalence estimates overall.
Table B.1. Precision of estimates by region and by expected proportion, at 95 percent confidence for Phase I.
Region (states) |
Approximate overall sample size |
Proportion estimate |
Phase I CV estimate (%) |
West1 |
900 |
0.50 |
6.7 |
0.25 |
11.5 |
||
0.10 |
20.0 |
||
South2 |
896 |
0.50 |
6.6 |
0.25 |
11.5 |
||
0.10 |
19.9 |
||
North Central3 |
904 |
0.50 |
6.7 |
0.25 |
11.5 |
||
0.10 |
20.0 |
||
Northeast4 |
900 |
0.50 |
6.7 |
0.25 |
11.5 |
||
0.10 |
20.0 |
||
Total |
3,600 |
0.50 |
3.3 |
0.25 |
5.8 |
||
0.10 |
10.0 |
||
1Alaska, Arizona, California, Colorado, Hawaii, Idaho, Montana, New Mexico, Nevada, Oregon, Utah, Washington, Wyoming 2Alabama, Arkansas, Florida, Georgia, Kentucky, Louisiana, Mississippi, North Carolina, Oklahoma, South Carolina, Tennessee, Texas 3Iowa, Illinois, Indiana, Kansas, Michigan, Minnesota, Missouri, North Dakota, Nebraska, Ohio, South Dakota, Wisconsin 4Connecticut, Delaware, Massachusetts, Maryland, Maine, New Hampshire, New Jersey, New York, Pennsylvania, Rhode Island, Vermont, West Virginia, Virginia |
|||
Table B.2. Precision of estimates by operation size and by expected proportion, at 95 percent confidence for Phase I.
Operation size (number of equids) |
Approximate overall sample size |
Proportion estimate |
Phase I CV estimate (%) |
Small (5–9) |
900 |
0.50 |
5.8 |
0.25 |
10.0 |
||
0.10 |
17.3 |
||
Medium (10–19) |
896 |
0.50 |
5.7 |
0.25 |
10.0 |
||
0.10 |
17.2 |
||
Large (20 or more) |
904 |
0.50 |
5.7 |
0.25 |
9.9 |
||
0.10 |
17.2 |
||
Total |
3,600 |
0.50 |
3.3 |
0.25 |
5.8 |
||
0.10 |
10.0 |
||
|
|||
Table B.3. Precision of estimates by region and by expected proportion, at 95 percent confidence for Phase II.
Region (states) |
Approximate overall sample size |
Proportion estimate |
Phase II CV estimate (%) |
West1 |
243 |
0.50 |
6.7 |
0.25 |
11.6 |
||
0.10 |
20.1 |
||
South2 |
243 |
0.50 |
6.4 |
0.25 |
11.2 |
||
0.10 |
19.3 |
||
North Central3 |
182 |
0.50 |
7.3 |
0.25 |
12.6 |
||
0.10 |
21.8 |
||
Northeast4 |
182 |
0.50 |
7.4 |
0.25 |
12.8 |
||
0.10 |
22.1 |
||
Total |
850 |
0.50 |
3.5 |
0.25 |
6.0 |
||
0.10 |
10.5 |
||
1Arizona, California, Colorado, Hawaii, Oregon, Utah, Washington, Wyoming 2Florida, Georgia, Kentucky, Mississippi, North Carolina, Oklahoma, South Carolina, Texas 3Illinois, Minnesota, Missouri, Nebraska, Ohio, Wisconsin 4Connecticut, Maryland, Massachusetts, New Jersey, New York, Pennsylvania, Vermont, Virginia |
|||
Table B.4. Precision of estimates by season and by expected proportion, at 95 percent confidence for Phase II.
Season (months) |
Approximate overall sample size |
Proportion estimate |
Phase II CV estimate (%) |
Winter (January 2027–February 2027, December 2027) |
212 |
0.50 |
6.5 |
0.25 |
11.3 |
||
0.10 |
19.6 |
||
Spring (March 2027–May 2027) |
212 |
0.50 |
7.1 |
0.25 |
12.2 |
||
0.10 |
21.2 |
||
Summer (June 2027–August 2027) |
213 |
0.50 |
7.1 |
0.25 |
12.3 |
||
0.10 |
21.3 |
||
Fall (September 2027–November 2027) |
213 |
0.50 |
6.9 |
0.25 |
12.0 |
||
0.10 |
20.7 |
||
Total |
850 |
0.50 |
3.5 |
0.25 |
6.0 |
||
0.10 |
10.5 |
||
|
|||
Table B.5. Precision of estimates by event scope and by expected proportion, at 95 percent confidence for Phase II.
Event scope |
Approximate overall sample size |
Proportion estimate |
Phase II CV estimate (%) |
Multi-state, non-adjacent |
284 |
0.50 |
6.0 |
0.25 |
10.5 |
||
0.10 |
18.1 |
||
Multi-state, adjacent |
283 |
0.50 |
6.0 |
0.25 |
10.5 |
||
0.10 |
18.1 |
||
Single state |
283 |
0.50 |
6.0 |
0.25 |
10.5 |
||
0.10 |
18.1 |
||
Total |
850 |
0.50 |
3.5 |
0.25 |
6.0 |
||
0.10 |
10.5 |
||
|
|||
Table B.6. Precision of horse level pathogen prevalence estimates breakout variable, at 95 percent confidence for the biologics sampling.
Breakout variable |
Breakout variable level |
Approximate sample size |
Equine Level Salmonella Prevalence CV estimate (%) |
Equine Level Coronavirus Prevalence CV estimate (%) |
Equine Level EHV-1 Prevalence CV estimate (%) |
Equine Level EHV-4 Prevalence CV estimate (%) |
Region |
West1 |
1,214 |
28.4 |
28.4 |
22.0 |
35.4 |
South2 |
1,214 |
28.4 |
28.4 |
22.0 |
35.4 |
|
North Central3 |
911 |
32.8 |
32.8 |
25.4 |
40.8 |
|
Northeast4 |
911 |
32.8 |
32.8 |
25.4 |
40.8 |
|
Season (months) |
Winter (January–February 2027, December 2027) |
1,062 |
30.4 |
30.4 |
23.5 |
37.8 |
Spring (March 2027–May 2027) |
1,062 |
30.4 |
30.4 |
23.5 |
37.8 |
|
Summer (June 2027–August 2027) |
1,063 |
30.4 |
30.4 |
23.5 |
37.8 |
|
Fall (September 2027–November 2027) |
1,063 |
30.4 |
30.4 |
23.5 |
37.8 |
|
Scope |
Multi-state, non-adjacent |
1,416 |
26.3 |
26.3 |
20.3 |
32.7 |
Multi-state, adjacent |
1,417 |
26.3 |
26.3 |
20.3 |
32.7 |
|
Single state |
1,417 |
26.3 |
26.3 |
20.3 |
32.7 |
|
Total |
|
4,250 |
15.2 |
15.2 |
11.7 |
18.9 |
1Arizona, California, Colorado, Hawaii, Oregon, Utah, Washington, Wyoming 2Florida, Georgia, Kentucky, Mississippi, North Carolina, Oklahoma, South Carolina, Texas 3Illinois, Minnesota, Missouri, Nebraska, Ohio, Wisconsin 4Connecticut, Maryland, Massachusetts, New Jersey, New York, Pennsylvania, Vermont, Virginia |
||||||
Appendix C: Response rates
Table C.1. Completion counts and rates for Phase I of previous NAHMS Equine and other studies.
Study |
Modes |
Sample |
Complete |
% Complete |
NAHMS Equine 1998 |
In-person |
4,148 |
2,771 |
67.4 |
NAHMS Equine 2005 |
In-person |
4,002 |
2,874 |
71.8 |
NAHMS Equine 2005 – Events |
Phone, in-person |
367 |
252 |
68.7 |
NAHMS Equine 2015 |
In-person |
3,997 |
1,920 |
48.0 |
NAHMS Goat 2019 |
In-person |
1,840 |
4,770 |
38.6 |
NAHMS Feedlot 2021 |
Mail, web, phone |
1,025 |
5,342 |
19.2 |
NAHMS Swine 2021 Small Enterprise |
Mail, web, phone |
1,494 |
5,880 |
25.4 |
NAHMS Swine 2021 Large Enterprise |
Mail, web, phone |
585 |
2,380 |
24.6 |
NAHMS Bison 2022 |
Mail, web, phone |
460 |
2,054 |
22.4 |
|
||||
Table C.2. Completion counts and rates for biologics phases of previous NAHMS Equine and other studies.
Study |
Sample |
Complete |
% Complete |
NAHMS Equine 2015 – Blood |
329 |
231 |
70.2 |
NAHMS Equine 2015 – Fecal pathogen |
329 |
199 |
60.5 |
NAHMS Equine 2015 – Parasites fecal egg count |
380 |
210 |
55.3 |
NAHMS Equine 2015 – Parasites resistance |
210 |
80 |
38.1 |
NAHMS Equine 2015 – Tick |
329 |
228 |
69.3 |
NAHMS Goat 2019 – Blood and swab |
779 |
581 |
74.6 |
NAHMS Goat 2019 – Fecal pathogen |
779 |
188 |
24.1 |
NAHMS Goat 2019 – Parasites fecal egg count |
779 |
627 |
80.5 |
NAHMS Goat 2019 – Parasites resistance |
627 |
206 |
32.9 |
Appendix D: Burden estimates
Table D.1. Average response burden estimates for Phase I questionnaire completion from previous NAHMS Equine and other studies (in minutes).
Study |
Modes |
Burden (min) |
Pages |
NAHMS Equine 1998 |
In-person |
56 |
28 |
NAHMS Equine 2005 |
In-person |
44 |
18 |
NAHMS Equine 2015 |
In-person |
58 |
20 |
NAHMS Goat 2019 |
In-person |
115 |
36 |
NAHMS Feedlot 2021 |
Mail, web, phone |
58 |
16 |
NAHMS Swine 2021 Small Enterprise |
Mail, web, phone |
60 |
16 |
NAHMS Swine 2021 Large Enterprise |
Mail, web, phone |
60 |
20 |
NAHMS Bison 2022 |
Mail, web, phone |
53 |
24 |
|
|||
Appendix E: Phase II events list frame resources
For Phase II of the study, a list frame of equine events occurring from January 2027 through December 2027 will be constructed using the resources listed below. The list frame will be in Excel or similar software and contain the event name, State, date, and contact information for events. From the list, a stratified random sample of events will be selected, with strata defined by state, event scope, and season.
The difficulties in creating a comprehensive list of equine events in the United States stem from the vastness and variety of the equine industry. The industry is fragmented, with numerous organizations, associations, and independent event organizers at various levels, each with their own methods of event promotion. The fluid nature of the industry, with events emerging, changing, or being canceled, coupled with the prevalence of private events, further complicates the task.
The following list, organized by national, regional, and State levels, prioritizes events with a verifiable online presence or contact information, including associated websites where available; as well as events that showed dates for 2024.
The following resources might be helpful in finding information about equine events in Native American communities:
Tribal Websites: Many Tribes have their own websites or social media pages where they may list events, including rodeos, horse races, or cultural celebrations featuring horses. It's best to search directly for the specific Tribe you're interested in.
Indian Relay Racing https://www.sbtribes.com/relay-racing/
Professional Indian Horse Racing Association (PIHRA) https://www.facebook.com/p/Professional-Indian-Horse-Racing-Association-100083103622491/
Social Media: Following Native American organizations, communities, and individuals involved in equestrian activities on social media (Facebook, Instagram, etc.) is a great way to stay updated on events.
Local News Outlets: Many local news sources in areas with large Native populations often cover equine events happening in their communities. Check online news sites or newspapers from specific regions.
Word of Mouth: Reach out to people in Native communities or those involved in equine activities to inquire about upcoming events. Local tack shops, feed stores, or equestrian centers near reservations may also have information.
Here are some additional resources that might be helpful:
Indian Rodeo News: A magazine that covers Native American rodeo events and culture. While they don't have a comprehensive online calendar, their articles often mention upcoming events.
Chief Joseph Ranch: A working ranch in Montana owned by the Confederated Salish and Kootenai Tribes; they sometimes host equine events.
Please note: Finding information on equine events in Native American Nations might require some additional research and networking due to the decentralized nature of these communities. It's a good idea to start with broad searches and then narrow them down based on the specific Tribe or region you're interested in.
Additional Online Resources
US Equestrian (USEF): The official governing body for equestrian sports in the United States. Their website includes a comprehensive calendar of events across various disciplines. (https://www.usef.org/compete/competition-calendar)
The Plaid Horse Magazine: A leading publication for the hunter/jumper community, they have an extensive events calendar and trade show listing. (https://www.theplaidhorse.com/expo/)
Equine Network: Home to several equine publications (including Practical Horseman and Horse Illustrated), they offer a calendar of events and clinics. (https://www.equinenetwork.com/event)
American Horse Council: Represents the equine industry in Washington, D.C. They sometimes list major events or conferences on their website. (https://www.horsecouncil.org/)
The Chronicle of the Horse: A long-standing publication for the horse world, it features an events calendar and classifieds section. (https://www.chronofhorse.com/events/)
Horse Show Tracker: Allows you to search for specific shows and track your entries. (https://www.horseshowtracker.com/)
Equine Sports Council: A horse show sanctioning corporation, similar to USEF (https://equinesportscouncil.org/)
Facebook Groups:
Equine Events USA: A general group for sharing information about events across the country.
Horse Show Hub: Focuses on hunter/jumper shows but often includes other disciplines.
Eventing USA: Specifically for eventing enthusiasts and professionals.
Dressage Riders of America: A large community of dressage riders sharing events and training tips.
Horse Training Tips & Tricks: General horse training discussions, often including event announcements.
[Your State/Region] Horse Community: Many States and regions have their own Facebook groups for local events and training opportunities.
Instagram Hashtags:
#equinetraining: A broad hashtag for all things horse training.
#horsetraining: Similar to #equinetraining, but can be more focused on specific disciplines.
#horseshow: For general horse show announcements and photos.
#equestrianevents: Similar to #horseshow, but often includes clinics and other events.
#equestrianlife: A general hashtag for all things equestrian, including events and training.
Other Platforms:
Reddit: Subreddits like r/Horses and r/Equestrian can be good resources for finding information about events and training opportunities.
Discord: Some equestrian communities have Discord servers where they share information about events and training.
Additional Tips:
Search for Specific Disciplines: If you're interested in a specific discipline (e.g., dressage, eventing, western riding), search for groups and hashtags specific to that discipline.
Join Local Groups: Joining groups specific to your State or region can be a great way to find local events and training opportunities.
Follow Professionals: Follow trainers, riders, and organizations on social media. They often share information about upcoming events and clinics.
National
National Snaffle Bit Association (NSBA), https://www.nsba.com/
National Reined Cow Horse Association (NRCHA), https://www.nrcha.com/
National Reining Horse Association (NRHA), https://nrha.com/
National Versatility Ranch Horse Association (NVRHA), https://www.nvrha.org/
National Barrel Horse Association (NBHA), https://nbha.com/
Professional Cowboys Rodeo Association, https://www.prorodeo.com/nfr
National Senior Pro Rodeo Association, https://nationalsenior.rodeo/, https://www.facebook.com/NationalSeniorProRodeo/
International Professional Rodeo Association https://www.ipra-rodeo.com/
National Spotted Saddle Horse Association Inc. https://nssha.com/
Spotted Saddle Horse Breeders and Exhibitors Association https://www.sshbea.org/
Western Dressage Association of America https://www.westerndressageassociation.org/
HITS Hunter, Jumper, and Dressage Horse Shows https://www.hitsshows.com/
Women’s Professional Rodeo Association https://www.wpra.com/
Professional Armed Forces Rodeo Association https://www.rodeopafra.com/
Intercollegiate Horse Shows Association (IHSA) https://www.ihsainc.com/
Arabian Horse Association (AHA) arabianhorses.org
American Endurance Ride https://aerc.org/calendar/
American Ranch Horse Association https://americanranchhorse.net/
Draft horses https://drafthorsejournal.com/pages/advertise
American Paint Horse Association https://apha.com/ https://www.aphaonline.org/APHAOnline/pub/CalendarOfEvents.aspx
American Quarter Horse Association https://www.aqha.com/
National Thoroughbred Racing Association https://www.ntra.com/
Thoroughbred Owners and Breeders Assocation https://toba.org/
United States Dressage Federation https://www.usdf.org/calendar/competitions.asp
US Hunter Jumper https://www.ushja.org/ see competition tab for the events
Breed Associations
American Warmblood
American Warmblood Registry
www.americanwarmblood.comAmerican Warmblood Society
www.americanwarmblood.orgAndalusian
International Andalusian Lusitano Horse Association
www.ialha.orgAppaloosa
Appaloosa Horse Club
www.appaloosa.comInternational Colored Appaloosa Association
www.icaainc.comArabian
Arabian Horse Association
www.arabianhorses.orgNorth American Shagya-Arabian Society
www.shagya.netThe Pyramid Society
www.pyramidsociety.orgAzteca
American Azteca Horse International Association
www.americanazteca.comBelgian Warmblood
Belgian Warmblood Breeding Association/North American District
www.belgianwarmblood.comBuckskin
American Buckskin Registry Association
www.americanbuckskin.orgInternational Buckskin Horse Association
www.ibha.netCanadian Warmblood
Canadian Warmblood Horse Breeders Association
www.canadianwarmbloods.comCaspian
Caspian Horse Society of the Americas
www.caspian.orgChampagne Horse
International Champagne Horse Registry
www.ichregistry.comCleveland Bay
Cleveland Bay Horse Society of North America
www.clevelandbay.orgClydesdale
Clydesdale Breeders of the USA
www.clydesusa.comColorado Ranger
Colorado Ranger Horse Association
www.coloradoranger.comConnemara Pony
American Connemara Pony Society
www.acps.orgCream Draft
American Cream Draft Horse Association
www.acdha.orgCurly Horse
American Bashkir Curly Registry
www.abcregistry.orgInternational Curly Horse Organization/North American Curly Horse Registry
www.curlyhorses.orgCurly Sporthorse International
www.curlysporthorse.orgDales
Dales Pony Association of North America
www.dalesponies.comDartmoor
The Dartmoor Pony Registry of America
www.dartmoorpony.comDonkeys and Mules
American Donkey and Mule Society
www.lovelongears.comMiniature Donkey and Mules
American Donkey Association
https://www.americandonkeys.com/shows-events
American Mammoth Jackstock Registry
americanjackstock.orgDutch Warmblood
Dutch Warmblood Studbook in North America
kwpn-na.orgFell Pony
Fell Pony Society of North America
www.fpsna.orgFjord
Norwegian Fjord Horse Registry
www.nfhr.comFlorida Cracker
Florida Cracker Horse Association
www.floridacrackerhorseassociation.comFriesian
Friesian Horse Association of North America
www.fhana.comInternational Friesian Show Horse Association
www.friesianshowhorse.comGeorgian Grande
International Georgian Grande Horse Registry
www.georgiangrande.comGypsy Horse
Gypsy Cob & Drum Horse Association
www.gcdha.comGypsy Horse Registry of America
www.gypsyhorseregistryofamerica.orgGypsy Vanner Horse Society
vanners.orgHackney
American Hackney Horse Society
www.hackneysociety.comHaflinger
American Haflinger Registry
www.haflingerhorse.comHanoverian
American Hanoverian Society
www.hanoverian.orgHolsteiner
American Holsteiner Horse Association
www.holsteiner.comHorse of the Americas
Horse of the Americas Registry
www.horseoftheamericas.comHungarian Horse
Hungarian Horse Association of America
www.hungarianhorses.orgIcelandic Horse
United States Icelandic Horse Congress
www.icelandics.orgIrish Draught
Irish Draught Horse Society, N.A.
www.irishdraught.comLipizzan
Lipizzan Association of North America
www.lipizzan.orgUnited States Lipizzan Registry
uslipizzan.orgLusitano
International Andalusian Lusitano Horse Association
www.ialha.orgMangalarga Marchador
US Mangalarga Marchador Association
namarchador.orgMiniature Horse
American Miniature Horse Association
www.amha.orgAmerican Miniature Horse Registry/American Shetland Pony Club
www.shetlandminiature.comMissouri Fox Trotter
Missouri Fox Trotting Horse Breed Association
www.mfthba.comMorab
Purebred Morab Horse Association/Purebred Morab Horse Registry
www.puremorab.comMorgan
American Morgan Horse Association
www.morganhorse.comMorgan Sport Horse Breeders Ltd.
www.sportmorgan.comLippitt Morgan Breeders’ Association
www.lippittmorganbreedersassociation.comMorgan Single-Footing Horse Association
www.gaitedmorgans.orgMustang
BLM National Wild Horse and Burro Program
www.blm.gov/adoptahorseKiger Mesteño Association
www.kigermustangs.orgAmerican Mustang and Burro Association Inc.
www.ambainc.netSpanish Mustang Registry Inc.
www.spanishmustang.orgNational Show Horse
National Show Horse Registry
www.nshregistry.orgNew Forest Pony
New Forest Pony Association & Registry
www.newforestpony.comOldenburg
Oldenburg Horse Breeders Society
www.oldenburghorse.netInternational Sporthorse Registry and Oldenburg Registry, N.A.
www.isroldenburg.orgPaint
American Paint Horse Association
www.apha.comPalomino
Palomino Horse Association
www.palominohorseassoc.comPalomino Horse Breeders of America
www.palominohba.comPaso Fino
Paso Fino Horse Association
www.pfha.orgPercheron
Percheron Horse Association of America
www.percheronhorse.orgPeruvian Horse
North American Peruvian Horse Association
www.napha.netPinto
Pinto Horse Association of America Inc.
www.pinto.orgPony of the Americas
Pony of the Americas Club
www.poac.orgPrzewalski Horse
Foundation for the Preservation and Protection of the Przewalski Horse
www.treemail.nl/takhQuarter Horse
American Quarter Horse Association
www.aqha.comFoundation Quarter Horse Registry
www.fqhrregistry.comNational Foundation Quarter Horse Association
www.nfqha.comNational Quarter Horse Registry
www.nqhr.comAmerican Appendix Horse Association
www.americanappendix.comAmerican Quarter Pony Association
www.aqpa.comRacking Horse
Racking Horse Breeders’ Association of America
www.rackinghorse.comRocky Mountain Horse
Mountain Pleasure Horse Association
www.mtn-pleasure-horse.orgRocky Mountain Horse Association
www.rmhorse.comSaddlebred
American Saddlebred Horse Association
www.saddlebred.comSelle Français
les Haras Nationaux
www.ifce.fr/haras-nationauxShire
American Shire Horse Association
www.shirehorse.orgSpanish Barb
Spanish Barb Breeders Association
www.spanishbarb.comSpanish Norman
Spanish-Norman Horse Registry
www.spanish-norman.comSport Horse
International Sport Horses of Color
www.shoc.orgPerformance Horse Registry
usef.orgSpotted Saddle Horse
National Spotted Saddle Horse Association
www.nssha.comSpotted Saddle Horse Breeders and Exhibitors Association
www.sshbea.orgStandardbred
United States Trotting Association
www.ustrotting.comSuffolk
American Suffolk Horse Association
Swedish Warmblood
Swedish Warmblood Association of North America
www.swanaoffice.orgTennessee Walking Horse
Tennessee Walking Horse Breeders’ and Exhibitors’ Association
www.twhbea.comFriends of Sound Horses
www.fosh.infoWalking Horse Owners’ Association
www.walkinghorseowners.comWalkaloosa Horse Association
www.walkaloosaregistry.comThoroughbred
The Jockey Club
www.jockeyclub.comTrakehner
American Trakehner Association
www.americantrakehner.comWelsh Pony and Cob
Welsh Pony and Cob Society
www.welshpony.orgBe sure to look for donkey, mule, pony, and hinny events as well
Regional
Pacific Northwest Morgan Horse show, http://www.pacificnorthwestmorganhorseshows.com/
The Northwest Professional Rodeo Association (OR, WA, ID, NV, CA), https://nprarodeo.com
The Tevis Cup, Utah and California, https://teviscup.org/
Northern Rodeo Association, https://www.northernrodeo.com/
Urban Equine Events & Midstates Horse Show (NE, IA), https://www.urbanequineevents.com/
New England Dressage Association, https://neda.org/
Fieldstone Park (New England), https://www.fieldstoneshowpark.com/
Carolina Carriage Club, https://carolinacarriageclub.com/
Southern Rodeo Association, https://srarodeo.com/
Western Carolinas Arabian Horse Association, https://www.wcaha.org/
Magnolia Arabian Horse Association, https://magnoliaaha.com/
Virginia Carolinas Morgan Horse Club, https://vcmhc.org/
Southern Rodeo Company, https://www.southernrodeocompany.com/, https://www.facebook.com/SouthernRodeoCompany/
Central States Dressage and Eventing Association, https://www.csdea.org/
Great Lakes Pro Rodeo Circuit, https://www.glcprorodeo.org/
First Frontier Rodeo Circuit, https://firstfrontiercircuit.com/
States
WA (Washington)
Washington State Horsemen, (WSH), https://www.wsh.org/
Washington State Horse Park, https://www.wahorsepark.org/home
Washington State Quarter Horse Association, https://www.wsqha.com/
Cascade Horse Shows, https://www.cascadehorseshows.com/
Central Washington Dressage Society, https://centralwashingtondressage.org/
Washington State Hunter Jumper Association, https://www.wshja.org/
Arabian Heritage Horse Show, https://www.heritagearabhorse.org
Washington State Horse Events Facebook Group, https://www.facebook.com/groups/378646738874409/
Evergreen State Fairgrounds Equestrian Park, Monroe WA, https://www.evergreenfair.org/
Washington International Horse Show, https://wihs.org/
OR (Oregon)
Oregon Family Equestrian Activities (OFEA), https://www.oregonfamilyequestrian.org/show-calendar
Oregon Thoroughbred Owners and Breeders Association, [http://www.oregontoba.com/breederownereducation/historicalmagazines.html](http://www.oregontoba.com/breederownereducation/historicalmagazines.html)
Oregon Quarter Horse Association, https://oregonqha.com/
Oregon Morgan Horse Association, https://www.morganhorseoregon.com/
Oregon Dressage Society, https://oregondressage.com/home/
Oregon Equestrian Trails, https://www.oregonequestriantrails.org/
Oregon High Desert Classics, https://www.oregonhighdesertclassics.org/
Oregon State Fair Horse Shows, https://oregonstatefair.org/livestock/horse-shows/
Sisters Rodeo, https://sistersrodeo.com/
Deschutes County Fair & Expo, https://expo.deschutes.org/events/equestrian
Crooked River Roundup, https://crookedriverroundup.com/
Pendleton Roundup, https://www.pendletonroundup.com/, https://www.facebook.com/pendletonroundup/
St. Paul Rodeo, https://www.stpaulrodeo.com/
Arabian and Half Arabian Club of Oregon, https://ahaco.com/
The Oregon Horse Center, https://www.oregonhorsecenter.com/
Oregon Pinto Horse Association, https://www.oregonpinto.com/, https://www.facebook.com/oregonpinto/
Oregon Horse Council, https://www.oregonhorsecouncil.com/
CA (California)
Pacific Coast Horse Shows Association (PCHA), https://pchashows.com/, https://www.facebook.com/pchorseshows/
California Professional Horsemen's Association (CPHA), https://www.cpha.org/
Blenheim Equisports, https://theplacetojump.com/
California Dressage Society (CDS), https://www.california-dressage.org/
Desert International Horse Park, https://deserthorsepark.com/
Del Mar Horsepark, https://www.hitsshows.com/
Del Mar National Horse Show, https://www.facebook.com/delmarnational/
Sacramento International Horse Show, https://www.facebook.com/sacinternationalhorseshow/
West Palms Events, https://www.westpalmsevents.com/
Lost Angeles Equestrian Center, https://thelaec.com/, https://www.facebook.com/LosAngelesEquestrianCenter
The Horse Park and Woodside, https://www.horsepark.org/
California State Horsemen Association, https://californiastatehorsemen.org/
California Thoroughbred Breeders Association, https://ctba.com/
California Reined Cow Horse Association, https://californiacowhorse.com/
Arabian Horse Association of Northern California, http://ahanc.com/
Paso Doble Horse Park, https://pasorobleshorsepark.com/
Southern California Horsemans Council, https://schchorseshows.com/
California Cowboys Professional Rodeo Association, https://www.ccpra.com/
AZ (Arizona)
Arizona Horse Council, https://azhorsecouncil.org/
Arizona Quarter Horse Association, [https://www.azqha.org/
Arizona Thoroughbred Breeders Association, https://atba.net/
Arizona Hunter Jumper Association, https://www.ahja.org/
Arizona Cutting Horse Association, https://www.azcha.com/
Arizona Reining Horse Association, https://azrha.com/
Arabian Horse Association of Arizona, https://www.scottsdaleshow.com/
Arizona Sun Circuit, https://www.suncircuit.com/
Arizona National Livestock Show, https://www.anls.org/, https://www.facebook.com/arizonanational/
WestWorld of Scottsdale, https://www.westworldaz.com/
Arizona Fall Championship, https://azfallchampionship.com/, https://www.facebook.com/azfallchampionship/
Pima County Fair, https://pimacountyfair.com/horse-shows/
Arizona Dressage Association, https://azdressage.org/
Arizona Morgan Horse Association, http://www.arizonamorgan.com/
Arizona Paint Horse Club, https://azpaints.org/, https://www.facebook.com/p/Arizona-Paint-Horse-Club-100064556149785/
Arizona Appaloosa Association, https://www.arizonaappaloosa.com/
Grand Canyon Professional Rodeo Association, http://gcpra.net/
UT (Utah)
Utah Quarter Horse Association, https://www.uqha.com/show-schedule
Utah Dressage Society, https://www.utahdressagesociety.com/
Utah Arabian Horse Club, https://utaharabians.com/, https://www.facebook.com/UtahArabianHorseClubUAHC/
Utah State Western Riding Club Association, https://uswrca.com/events
Intermountain Reining Horse Association, https://www.irha.com/show-information, https://www.facebook.com/intermountainreininghorseassociation
Utah Barrel Racing Association, https://www.utbra.com/
Utah Summer Games, https://utahsummergames.org/
Days of '47 Rodeo, https://www.daysof47.com/
Utah State Fair, https://www.utahstatefair.com/
Ogden Pioneer Days Rodeo, https://www.ogdenpioneerdays.com/
Box Elder County Fair Draft Horse Show and Golden Spike Rodeo, https://www.boxeldercountyut.gov/tourism/page/whats-happening-box-elder-county
CO (Colorado)
Colorado Horse Council, https://coloradohorsecouncil.com/
Colorado Hunter Jumper Association (CHJA), https://chja.org/
Colorado Ranger Horse Association, http://www.coloradoranger.com/
Colorado Quarter Horse Association, https://ncqha.org/
Rocky Mountain Dressage Society, https://www.rmds.org/
Colorado Reined Cow Horse Association, https://www.facebook.com/ColoradoReinedCowhorseAssociation/
Rocky Mountain Horse Show Association, https://www.showmetheribbons.org/
National Western Stock Show, https://nationalwestern.com/
Colorado Pro Rodeo, https://www.coloradoprorodeo.com/index.php/schedule
Bally\u2019s Arapahoe Park Horse Track, https://casinos.ballys.com/arapahoe-park/
MT (Montana)
Montana Quarter Horse Association, https://montanaqha.com/
Montana Arabian Horse Association, http://www.montanaarabianhorses.com/
Montana Reining Horse Association, https://www.montanareining.com/
The Event at Rebecca Farm, https://www.rebeccafarm.org/
Montana Cutting Horse Association, https://montanacha.com/
Montana Fair, https://www.montanafair.com/
Big Sky Draft Horse Expo, https://drafthorseexpo.com/
WY (Wyoming)
Wyoming Quarter Horse Association, https://wqha.org/
Wyoming Cutting Horse Association, https://wyomingcha.org/
Wyoming All Breeds Racing Association, https://wabra.org/
Wyoming Rodeo Association, https://www.wyorodeoassociation.com/
Cheyenne Frontier Days, https://www.cfdrodeo.com/
Cody Nite Rodeo, https://www.codystampederodeo.com/
NE (Nebraska)
Nebraska Quarter Horse Association, https://www.nebraskaquarterhorseassociation.com/
Nebraska Dressage Association, https://nebraskadressage.org/
Central Plains Reining Horse Association, http://www.cprha.com/
Nebraska State Fair Equine Shows, https://www.statefair.org/ag-competitions/equine-exhibitors/, [https://www.facebook.com/nestatefairhorse/](https://www. omahaequine.com/
Nebraska Horse Clubs Association, https://nebraskahorseclubs.weebly.com/, https://www.facebook.com/nebraskahorseclubs/
Nebraska State Rodeo Association, https://nebraskastaterodeo.com/, https://www.facebook.com/NebraskaStateRodeoAssociation/
TX (Texas)
Texas Quarter Horse Association, https://www.tqha.com/
Texas Thoroughbred Association, https://texasthoroughbred.com/
Arabian Horse Association of Texas, https://arabianhorsecluboftexas.com/
Texas Hunter Jumper Association, https://www.thja.org/
Texas Reining Horse Association, https://www.texasreining.com/
Houston Livestock Show and Rodeo, https://www.rodeohouston.com/
Fort Worth Stock Show & Rodeo, https://www.fwssr.com/
Texas Rose Horse Park Events, https://www.texasrosehorsepark.com/
Great Southwest Equestrian Center Events, https://gswec.com/
Arabian Racing Series, https://www.texasarabianbreedersassociation.com/
Texas Pro Rodeo Circuit, https://texasprorodeocircuit.com/
Texas Senior Pro Rodeo Association, https://www.tspra.com/ https://www.facebook.com/p/Texas-Senior-Pro-Rodeo-Assoc-TSPRA-100064430299763/
Mustang Heritage Foundation https://mustangheritagefoundation.org/
OK (Oklahoma)
Oklahoma Quarter Horse Association, https://www.oqha.com/
Oklahoma Reining Horse Association, https://www.okrha.com/
Oklahoma Hunter Jumper Association, https://www.okhunterjumper.com/
Oklahoma State Fair Horse Shows, https://okstatefair.com/competitions/equine/
Lazy E Arena Events, https://lazye.com/
Oklahoma Rodeo Association, https://www.facebook.com/p/Oklahoma-Rodeo-Association-100064455529197/
Travel Oklahoma, https://www.travelok.com/rodeos
Thoroughbred Racing Association of Oklahoma, (TRAO) https://traoracing.com/, https://www.facebook.com/Traoracing/
Paint Horse Club of Oklahoma, https://www.okpainthorse.org/
Oklahoma Arabian Horse Club, https://www.oklahomaarabians.com/events
MO (Missouri)
Missouri Horse Council, https://missourihorsecouncil.com/
Missouri Fox Trotting Horse Breed Association (MFTHBA), https://mfthba.com/
Missouri Quarter Horse Association (MoQHA), https://www.moqha.com/
Missouri Hunter Jumper Organization, http://www.mohjo.org/ https://www.facebook.com/p/Missouri-Hunter-Jumper-Organization-MOHJO-100057050456992/
Missouri Horse Shows, http://www.mohorseshows.com/index.shtml
Southwest Missouri Reining Horse Association, https://www.facebook.com/SouthwestMissouriReiningHorseAssociation/
American Royal, https://americanroyal.com/
Missouri Rodeo Cowboy Association, http://missourirodeo.com/, https://www.facebook.com/p/Missouri-Rodeo-Cowboy-Assoc-100064932784283/
Missouri Family Rodeo Association, https://missourifamilyrodeo.com/
Ozark Quarter Horse Association, https://www.ozqha.com/ , https://www.facebook.com/ozqha/
MA (Massachusetts)
Massachusetts Horsemen’s Council, https://www.mahorsecouncil.com/
Massachusetts Morgan Horse Association, https://www.massmorgan.com/
Massachusetts Quarter Horse Association, https://massqha.com/ (https://www.facebook.com/p/Massachusetts-Quarter-Horse-Association-100063544301936/)
North Shore Horsemen Association, (https://www.nshorsemens.org/ https://www.facebook.com/profile.php?id=100064651723107
Myopia Horse Show, https://www.myopiahuntclub.com/
NJ (New Jersey)
Standardbred Breeders & Owners Association of New Jersey, https://sboanj.com/
American Saddlebred Association of New Jersey, https://www.ashanj.net/
New Jersey Pinto Horse Association, https://njptha.net/ , https://www.facebook.com/groups/649051848780800/
New Jersey Horse Shows Association (NJHSA), https://www.njhsa.org/
New Jersey Professional Horsemen’s Association, https://njpha.net/
New Jersey Equine Advisory Board, https://www.esdcta.org/
Monmouth Park, https://www.monmouthpark.com/
Freehold Raceway, http://www.freeholdraceway.com/
Meadowlands Racing and Entertainment, https://playmeadowlands.com/
Garden State Horse Show, https://www.gardenstatehorseshow.org/
Sussex County Farm and Horse Show, https://sussexcountyfairgrounds.org/
NC (North Carolina)
North Carolina Horse Council, https://www.nchorsecouncil.com/
Tryon International Equestrian Center, https://tryon.com/
Carolina Horse Park, https://www.carolinahorsepark.com/
North Carolina Quarter Horse Association, https://ncqha.com/
North Carolina Thoroughbred Association, https://ncta.com/
North Carolina Hunter Jumper Association, https://www.nchja.com/
North Carolina Dressage and Combined Training Association
Carolina International (CIC), https://carolinainternationalcci.com/, https://www.facebook.com/CarolinaInternationalCCI/
SC (South Carolina)
South Carolina Horse Council, https://www.schorsecouncil.com/
South Carolina Quarter Horse Association, https://scquarterhorse.com/
South Carolina Thoroughbred Owners and Breeders Association, http://www.sctoba.org/
South Carolina Hunter Jumper Association, http://www.schja.org/
Back Country Horsemen of South Carolina, https://sites.google.com/view/bchsc/home, https://www.facebook.com/BCHofSC/
Aiken Horse Park, https://www.aikenhorsepark.org/
South Carolina Equine Park, https://www.scequinepark.com/
The Camden Cup, https://carolinacup.org/
GA (Georgia)
Georgia Horse Council, https://georgiahorsecouncil.com/
Georgia Dressage and Combined Training Association, https://www.gdcta.org/
Georgia Quarter Horse Association, https://gqha.com/ https://www.facebook.com/groups/154979441221798/
Georgia Appaloosa Horse Club, https://www.georgia-appaloosa.com/, https://www.facebook.com/georgiaappaloosa/
Georgia Arabian Horse Association, https://www.georgia-arabian.com/, https://www.facebook.com/GeorgiaArabianHorseAssociation/
Georgia Paso Fino Horse Association, https://www.georgiapasofino.org/
Atlanta Steeplechase, https://georgiasteeplechase.org/
Georgia National Draft Horse Show, https://www.georgianationalfair.com/p/livestock/horseshows
Georgia Horse Park, https://www.georgiahorsepark.com/
Georgia National Rodeo, https://www.georgianationalrodeo.com/
FL (Florida)
Florida Quarter Horse Association, https://www.fqha.net/
Florida Thoroughbred Breeders' and Owners' Association, https://ftboa.com/
Florida Thoroughbred Horsemen’s Association, https://floridahorsemen.org/
Ocala Marion County, https://www.ocalamarion.com/things-to-do/equestrian/
Arabian Horse Association of Florida, https://www.ahaflorida.org/
Florida Pinto Horse Association, http://www.fptha.com/www.fptha.com/Welcome.html
Central Florida Hunter Jumper Association, http://www.cfhja.com/, https://www.facebook.com/centralfloridahunterjumper/
South Florida Hunter Jumper Association, http://www.sfhja.com/, https://www.instagram.com/southfloridahunterjumper/
Southwest Florida Hunter Jumper Association, https://www.swfhja.com/
South Florida Dressage Association, https://southfloridadressageassociation.org/
Northeast Florida Dressage Association, https://www.nfladressage.org/, https://www.facebook.com/groups/93930087997/
Southwest Florida Dressage Association, https://swfldressage.org/, https://www.facebook.com/SWFLDressage/
First Coast Classical Dressage Society, https://www.fccds.org/
Wellington International, https://wellingtoninternational.com/
Live Oak International, https://liveoakinternational.com/ , https://www.facebook.com/LiveOakInternational/ , https://www.instagram.com/liveoakinternational/?hl=en
MN (Minnesota)
Minnesota Horse Council, https://www.mnhorsecouncil.org/
Minnesota Quarter Horse Association, https://www.mnqha.com/
Minnesota Thoroughbred Association, https://minnesotabred.com/, https://www.facebook.com/minnesotathoroughbredassociation/
Minnesota Quarter Horse Racing Association, https://mqhra.com/
Minnesota Cutting Horse Association, https://mncuttinghorse.com/
Minnesota Hunter Jumper Association, https://mhja.org/
Minnesota Western Saddle Club Association, http://wsca.org/
Minnesota High School Equestrian Association, https://www.mhsea.org/
Minnesota Horse Expo, https://www.mnhorseexpo.org/
Minnesota Harvest Horse Show, https://minnesotaharvesthorseshow.com/ (A popular hunter/jumper show held annually in September)
Minnesota State Fair Horse Shows, https://www.mnstatefair.org/competitions/horses/
Canterbury Park Horse Racing, https://www.canterburypark.com/
Running Aces Harness Park, https://runaces.com/racing/
Minnesota Rodeo Association, https://www.mnrodeo.org/
WI (Wisconsin)
Wisconsin Horse Council (WHC), https://www.wisconsinhorsecouncil.org/
Wisconsin Quarter Horse Association, https://wqha.com/
Wisconsin Arabian Horse Association, https://wisconsinarabian.com/shows-%26-events
Wisconsin Pinto Horse Association, https://wisconsinpinto.com/
Wisconsin Morgan Horse Club, https://www.wisconsinmorganhorseclub.org/event-calendar
Western Wisconsin Horse Show Association, http://www.wwhsa.org/
Wisconsin 4-H Horse Association, https://4h.extension.wisc.edu/opportunities/projects/large-animals/horse-project/wisconsin-4-h-horse-association/
Wisconsin High School Rodeo Association, https://whsra.org/ , https://www.facebook.com/groups/2214226909/
Midwest Horse Fair, https://midwesthorsefair.com/ https://www.facebook.com/midwesthorsefair
Wisconsin State Fair Horse Show, https://wistatefair.com/competitions/open-livestock/
Wisconsin River Pro Rodeo, https://wrpr.org/
IL (Illinois)
Horsemen's Council of Illinois, https://hci.wildapricot.org/
Illinois Quarter Horse Association, https://ilqha.com/
Illinois Thoroughbred Horsemen's Association, https://www.itharacing.com/
Arabian Horse Association of Illinois, https://www.facebook.com/illinoisaha/
Northern Illinois Arabian Horse Activity Club, https://www.niahac.com/
Illinois Paint Horse Association, http://www.illinoispainthorse.com/
Illinois Dressage and Combined Training Association, https://idcta.org/
Illinois Hunter Jumper Association, https://www.ihja.com/
Northern Illinois Hunter Jumper Association, https://nihja.net/
Illinois High School Rodeo Association, https://ilrodeo.com/
Illinois State Fair Equine Events, https://statefair.illinois.gov/competitions/competitive-events/equine-events.html
Lamplight Equestrian Center Shows, https://www.hitsshows.com/hits-venues/hits-chicago/
Great Northern Illinois Pro Rodeo and Bull Riding, https://bighatrodeo.com/event/great-northern-illinois-pro-rodeo-in-belvidere-il/2024-09-07/
KY (Kentucky)
Kentucky Quarter Horse Association, https://www.kyqha.com/
American Saddlebred Horse Association, https://asha.net/
Kentucky Mountain Saddle Horse Association, https://www.kmsha.com/
Kentucky Horse Park Foundation, https://kyhorsepark.com/
Kentucky Hunter Jumper Association, http://www.khja.org/
Kentucky Dressage Association, https://www.kentuckydressageassociation.com/
Kentucky Equine Education Project (KEEP), https://horseswork.com/
Equine Breed Associations, https://horseswork.com/equine-breed-associations/
Kentucky Derby, https://www.kentuckyderby.com/
Land Rover Kentucky Three-Day Event, https://www.kentuckythreedayevent.com/ https://www.facebook.com/KentuckyThreeDayEvent/
Breeders' Cup World Championships, https://www.breederscup.com/
Kentucky Horse Park Events, https://kyhorsepark.com/
Keeneland Race Course, https://www.keeneland.com/
Churchill Downs, https://www.churchilldowns.com/
Ellis Park, https://ellisparkracing.com/
Turfway Park, https://www.turfway.com/racing/live-racing-schedule/
OH (Ohio)
World Equestrian Center, https://worldequestriancenter.com/wilmington-oh/
Ohio Harness Horsemen’s Association, https://www.ohha.com/Home
PA (Pennsylvania)
Pennsylvania Horse Breeders Association, http://www.pabred.com/
Pennsylvania Quarter Horse Association, http://www.pqha.org/
Pennsylvania Arabian Horse Association, https://www.paha.org/
Pennsylvania National Horse Show, https://panational.org/
Pennsylvania Horse Shows Association (PHSA), https://www.pennhsa.org/
Pennsylvania National Horse Show, https://panational.org/
Devon Horse Show & Country Fair, https://www.devonhorseshow.net/
Radnor Hunt Races, https://radnorhuntraces.org/
Plantation Field International Horse Trials & Country Fair, https://www.plantationfield.com/ https://www.facebook.com/PlantationFieldInternational/ https://www.instagram.com/plantationfield/?hl=en
Ludwig's Corner Horse Show, https://ludwigshorseshow.com/
Dressage at Devon, https://dressageatdevon.org/
Pennsylvania High School Rodeo Association, https://www.phsra.org/
NY (New York)
New York State Quarter Horse Association, https://www.nysqha.com/
Western New York Dressage Association (WNYDA), https://www.wnyda.org/
Hampton Classic Horse Show, https://hamptonclassic.com/
Saratoga Race Course, https://www.nyra.com/saratoga/
New York State Fair Horse Show, https://nysfair.ny.gov/venue/toyota-coliseum/
HITS Hudson Valley, NY, https://www.hitsshows.com/hits-venues/hits-hudson-valley/
Old Salem Farm Spring Horse Shows, https://oldsalemfarm.net/
Lake Placid Horse and I Love NY Horse Shows https://www.lakeplacid.com/events/lake-placid-horse-show
VT (Vermont)
Vermont Horse Council, https://vthorsecouncil.org/
Vermont Morgan Horse Association, https://vtmorganhorse.org/
Vermont Hunter Jumper Association, https://www.vhja.org/
Central Vermont Dressage Association, https://www.cvda.org/
Green Mountain Horse Association, https://www.gmhainc.org/
Vermont Equine Riding and Driving Association (VERDA), https://www.verda.org/
HITS Manchester, VT https://www.hitsshows.com/hits-events/hits-vermont-summer-festival/ https://www.facebook.com/VermontSummerFestival/
CT (Connecticut)
Connecticut Horse Council, http://www.cthorsecouncil.org/
Connecticut Morgan Horse Association, https://ctmorgans.org/
Connecticut Hunter Jumper Association, https://www.chja.net/
Connecticut Dressage Association, https://www.ctdressage.org/
Connecticut Color Breed Association, https://connecticut-color-breed-association.mailchimpsites.com/
Ox Ridge Charity Horse Show, https://www.oxridge.com/horse-shows.html
VA (Virginia)
Virginia Horse Council, https://virginiahorsecouncil.org/
Virginia Thoroughbred Association, https://virginiahorseracing.com/
Virginia Quarter Horse Association, https://myvqha.com/
Virginia Arabian Horse Association, https://www.vahaclub.com/index.html https://www.facebook.com/vahaarabians/
Virginia Paint Horse Club, https://www.virginiapainthorseclub.org/
Virginia Hunter Jumper Association, https://vhja.org/
Virginia Dressage Association, https://www.virginiadressage.org/
Virginia Horse Shows Association, http://www.vhsa.com/
Virginia Horse Center Foundation, https://vahorsecenter.org/
Virginia Gold Cup, https://vagoldcup.com/
Upperville Colt & Horse Show, https://upperville.com/
Keswick Horse Show, https://www.keswickhorseshow.com/
The Middleburg Spring Races, https://www.middleburgspringraces.com/ https://www.instagram.com/middleburgspringraces/?hl=en
1 Equids include horses, ponies, mules, burros, and donkeys.
2 Equine events include but are not limited to the following event types: Western performance events. rodeo, polo match, fair or exhibition, race, trail ride (recreational) or endurance, sale, auction, breed or discipline inspection, training clinic, draft-horse pull/shows, horse trials, dressage, 3-day eventing, hunter paces, and driving competitions.
3Arizona, California, Colorado, Connecticut, Florida, Georgia, Hawaii, Illinois, Kentucky, Massachusetts, Maryland, Minnesota, Missouri, Mississippi, North Carolina, Nebraska, New Jersey, New York, Ohio, Oklahoma, Oregon, Pennsylvania, South Carolina, Texas, Utah, Virginia, Vermont, Washington, Wisconsin, and Wyoming.
4 For more information on the methods used in the Equine 2005 study, see https://www.aphis.usda.gov/sites/default/files/equine05_dr_events.pdf.
| File Type | application/vnd.openxmlformats-officedocument.wordprocessingml.document |
| Author | cbsickles |
| File Modified | 0000-00-00 |
| File Created | 2026-01-13 |
© 2026 OMB.report | Privacy Policy