Beneficiary Report - Partners
Diaper Distribution Demonstration and Research Pilot Beneficiary Information
Instrument 2 - Beneficiary Report.xlsx
Beneficiary Report - Partners
OMB: 0970-0642
⚠️ Notice: This form may be outdated. More recent filings and information on OMB 0970-0642 can be found here:
Document [xlsx]
Download: xlsx | pdf
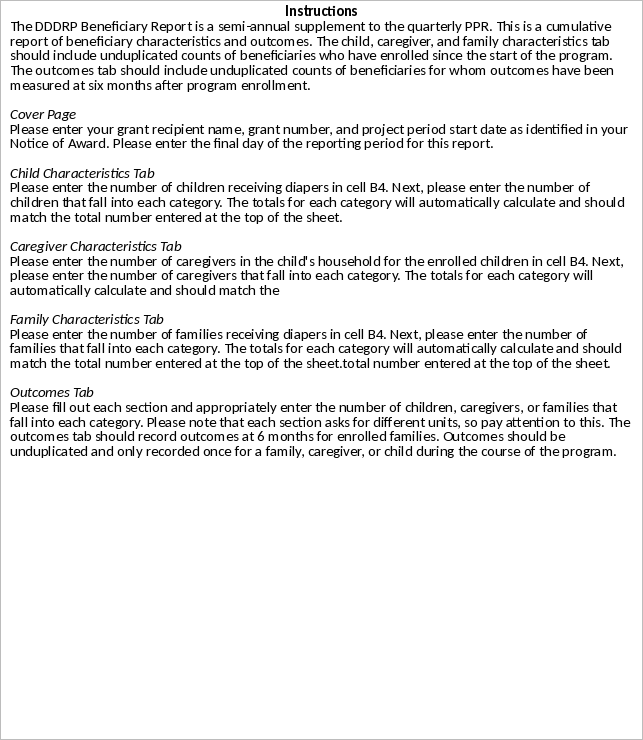
Instructions
Cover Page
Child Characteristics
Caregiver Information
Family Characteristics
Outcomes
Overview
PRA StatementInstructions
Cover Page
Child Characteristics
Caregiver Information
Family Characteristics
Outcomes
Sheet 1: PRA Statement
| THE PAPERWORK REDUCTION ACT OF 1995 (Pub. L. 104-13) Public reporting burden for this collection of information is estimated to average 4 hour per response, including the time for reviewing instructions, gathering and maintaining the data needed, and reviewing the collection of information. OMB Approval Number: 0970-XXXX Expiration Date: XX/XX/XXXX An agency may not conduct or sponsor, and a person is not required to respond to, a collection of information unless it displays a currently valid OMB control number. |
Sheet 2: Instructions
|
||||||||||
Sheet 3: Cover Page
| Name of Grant Recipient | |
| Grant Number | 90EDA____ |
| Project Start Date | |
| Report Period End Date |
Sheet 4: Child Characteristics
| Item | Total Enrolled Since Start of Program | Number of Children | |||||||
| CT | Total Number of Children: | 0 | |||||||
| Age at Enrollment | Number of Children | ||||||||
| CA1 | Not yet born | ||||||||
| CA2 | 1 - 3 months | ||||||||
| CA3 | 4 - 6 months | ||||||||
| CA4 | 7 - 9 months | ||||||||
| CA5 | 10 - 12 months | ||||||||
| CA6 | 13 - 15 months | ||||||||
| CA7 | 16 - 18 months | ||||||||
| CA8 | 19 - 21 months | ||||||||
| CA9 | 22 - 24 months | ||||||||
| CA10 | 25 - 36 months | ||||||||
| CA11 | 3 years | ||||||||
| CA12 | 4 years | ||||||||
| CA13 | 5 - 7 years | ||||||||
| CA14 | 8 - 11 years | ||||||||
| CA15 | 12 - 14 years | ||||||||
| CA16 | 15+ years | ||||||||
| CAU | Unknown | ||||||||
| CAT | TOTAL | 0 | |||||||
| Race or Ethnicity | Number of Children | ||||||||
| CR1 | American Indian or Alaskan Native | ||||||||
| CR2 | Asian | ||||||||
| CR3 | Black or African American | ||||||||
| CR4 | Hispanic or Latino | ||||||||
| CR5 | Middle Eastern or North African | ||||||||
| CR6 | Native Hawaiian or Other Pacific Islander | ||||||||
| CR7 | White | ||||||||
| CRU | Unknown | ||||||||
| CRT | TOTAL KNOWN (cell does not autosum because caregivers can select multiple race and ethnicity options.) | ||||||||
| Children with Disabilities (As told by a doctor, healthcare provider, or teacher that child in diapers has a disability) | Number of Children | ||||||||
| CD1 | Yes | ||||||||
| CD2 | No | ||||||||
| CDU | Unknown | ||||||||
| CDT | TOTAL | 0 | |||||||
| Enrolled in Early Head Start or Head Start | Number of Children | ||||||||
| CE1 | Yes | ||||||||
| CE2 | No | ||||||||
| CEU | Unknown | ||||||||
| CET | TOTAL | 0 | |||||||
| Attend Childcare | Number of Children | ||||||||
| CC1 | Yes | ||||||||
| CC2 | No | ||||||||
| CCU | Unknown | ||||||||
| CCT | TOTAL | 0 | |||||||
| Need to Provide Diapers while in Childcare | Number of Children | ||||||||
| CN1 | Provided by family | ||||||||
| CN2 | Some diapers by family, some by childcare | ||||||||
| CN3 | Childcare provides diapers | ||||||||
| CNN | Not applicable | ||||||||
| CNU | Unknown | ||||||||
| CN4 | TOTAL | 0 |
Sheet 5: Caregiver Information
| GT | Total Number of Caregivers: | 0 | ||||||||||
| Age | Number of Caregivers | |||||||||||
| GA1 | Under 18 | |||||||||||
| GA2 | 18 - 24 | |||||||||||
| GA3 | 25 - 34 | |||||||||||
| GA4 | 35 - 44 | |||||||||||
| GA6 | 45 - 64 | |||||||||||
| GA7 | 65 + | |||||||||||
| GAU | Unknown | |||||||||||
| GAT | TOTAL | 0 | ||||||||||
| Gender Identity | Number of Caregivers | |||||||||||
| GG1 | Female | |||||||||||
| GG2 | Male | |||||||||||
| GG3 | Transgender, non-binary, or another gender | |||||||||||
| GGU | Unknown | |||||||||||
| GGT | TOTAL | 0 | ||||||||||
| Race or Ethnicity | Number of Caregivers | |||||||||||
| GR1 | American Indian or Alaskan Native | |||||||||||
| GR2 | Asian | |||||||||||
| GR3 | Black or African American | |||||||||||
| GR4 | Hispanic or Latino | |||||||||||
| GR5 | Middle Eastern or North African | |||||||||||
| GR6 | Native Hawaiian or Other Pacific Islander | |||||||||||
| GR7 | White | |||||||||||
| GRU | Unknown | |||||||||||
| GRT | TOTAL KNOWN (cell does not autosum because caregivers can select multiple race and ethnicity options.) | |||||||||||
| Education Levels | Number of Caregivers | |||||||||||
| GE1 | Grades 0-8 | |||||||||||
| GE2 | Grades 9-12 or Non-Graduate | |||||||||||
| GE3 | High School Graduate, GED, or Equivalency Diploma | |||||||||||
| GE4 | 12th Grade + Some Post-Secondary | |||||||||||
| GE5 | 2 or 4 Years College Graduate | |||||||||||
| GE6 | Graduate or Other Post-Secondary School | |||||||||||
| GEU | Unknown | |||||||||||
| GET | TOTAL | 0 |
Sheet 6: Family Characteristics
| FT | Total Number of Families: | 0 | ||||||||||
| Number of adults in family household | Number of Families | |||||||||||
| FA1 | 0 | |||||||||||
| FA2 | 1 | |||||||||||
| FA3 | 2 | |||||||||||
| FA4 | 3 | |||||||||||
| FA5 | 4+ | |||||||||||
| FAU | Uknown | |||||||||||
| FAT | TOTAL | 0 | ||||||||||
| Number of children under 18 in family household | Number of Families | |||||||||||
| FC1 | 0 | |||||||||||
| FC2 | 1 | |||||||||||
| FC3 | 2 | |||||||||||
| FC4 | 3 | |||||||||||
| FC5 | 4+ | |||||||||||
| FCU | Unknown | |||||||||||
| FCT | TOTAL | 0 | ||||||||||
| Household Size | Number of Families | |||||||||||
| FH1 | 1 | |||||||||||
| FH2 | 2 | |||||||||||
| FH3 | 3 | |||||||||||
| FH4 | 4 | |||||||||||
| FH5 | 5 | |||||||||||
| FH6 | 6+ | |||||||||||
| FHU | Unknown | |||||||||||
| FHT | TOTAL | 0 | ||||||||||
| Family Structure | Number of Families | |||||||||||
| FF1 | Single Parent Female | |||||||||||
| FF2 | Single Parent Male | |||||||||||
| FF3 | Two Parent Household | |||||||||||
| FF4 | Non-Related Adults with Children | |||||||||||
| FF5 | Multigenerational Household | |||||||||||
| FF6 | Other | |||||||||||
| FFU | Unknown | |||||||||||
| FFT | TOTAL | 0 | ||||||||||
| Federal Poverty level | Number of Families | |||||||||||
| FP1 | Upt to 50% | |||||||||||
| FP2 | 51% - 75% | |||||||||||
| FP3 | 76% - 100% | |||||||||||
| FP4 | 101% - 125% | |||||||||||
| FP5 | 126% - 150% | |||||||||||
| FP6 | 151% - 175% | |||||||||||
| FP7 | 176% - 200% | |||||||||||
| FP8 | 201% - 250% | |||||||||||
| FP9 | 251% and over | |||||||||||
| FPU | Unknown | |||||||||||
| FPT | TOTAL | 0 |
Sheet 7: Outcomes
| Total Enrollment Indicators | Number of Families | |||||||||
| OT1 | Total Family Enrolled for at Least 6 Months | |||||||||
| Days in Past Month Family Had Enough Diapers | Number of Families | |||||||||
| ON1 | Days with enough diapers decreased | |||||||||
| ON2 | Days with enough diapers remained the same | |||||||||
| ON3 | Days with enough diapers increased | |||||||||
| ONT | TOTAL | 0 | ||||||||
| Use of Mitigation Strategies in Past Month Related to Diaper Need | Number of Families | |||||||||
| OM1 | Use of mitigation strategies decreased | |||||||||
| OM2 | Use of mitigation strategies remained the same | |||||||||
| OM3 | Use of mitigation strategies increased | |||||||||
| OMT | TOTAL | 0 | ||||||||
| Ability to Manage Family Expenses in Past Month | Number of Families | |||||||||
| OE1 | Improved ability to manage expenses | |||||||||
| OE2 | Ability to manage expenses remains the same | |||||||||
| OE3 | Decreased ability to manage expenses | |||||||||
| OET | TOTAL | 0 | ||||||||
| Total Enrollment Indicators | Number of Caregivers | |||||||||
| OT2 | Total Caregivers of Children Enrolled at Least 6 Months | |||||||||
| Caregiver Stress Related to Diaper Need in Past Month | Number of Caregivers | |||||||||
| OS1 | Stress decreased | |||||||||
| OS2 | Stress stayed the same | |||||||||
| OS3 | Stress increased | |||||||||
| OST | TOTAL | 0 | ||||||||
| Total Enrollment Indicators | Number of Children | |||||||||
| OT3 | Total Children Enrolled for at Least 6 Months | |||||||||
| Child Health and Well-Being in Past Month Related to Diaper Need (e.g., diaper rashes, UTI) | Number of Children | |||||||||
| OH1 | Improved health and well-being | |||||||||
| OH2 | Health and well-being remained the same | |||||||||
| OH3 | Health and well-being declined | |||||||||
| OHT | TOTAL | 0 | ||||||||
| Total Enrollment Indicators | Number of Children (no child care at enrollment) | |||||||||
| OT4 | Total Children Enrolled for at Least 6 Months NOT Enrolled in Childcare at Baseline | |||||||||
| Childcare Enrollment Among Diapered Children Not Enrolled in Childcare at Baseline | Number of Children (no child care at enrollment) | |||||||||
| OC1 | Enrolled in childcare | |||||||||
| OC2 | Did not enroll in childcare | |||||||||
| OCT | Total | 0 | ||||||||
| Total Enrollment Indicators | Number of Children (with childcare at enrollment) | |||||||||
| OT5 | Total Children Enrolled for at Least 6 Months Enrolled in Childcare at Baseline | |||||||||
| Childcare Attendance in Past Month for Children Enrolled in Childcare at Baseline | Number of Children (with childcare at enrollment) | |||||||||
| OA1 | Reduced Days of Childcare Missed | |||||||||
| OA2 | Days of Childcare Missed Remained the Same | |||||||||
| OA3 | Increased Days of Childcare Missed | |||||||||
| OAT | TOTAL | 0 |
| File Type | application/vnd.openxmlformats-officedocument.spreadsheetml.sheet |
| File Modified | 0000-00-00 |
| File Created | 0000-00-00 |
© 2026 OMB.report | Privacy Policy