PRAMS Nonresponse Bias Assessment of 2020 and 2021 Data
Attachment 19a. Nonresponse Bias Assessment of 2020 and 2021 Data.docx
[NCCDPHP] Pregnancy Risk Assessment Monitoring System (PRAMS)
PRAMS Nonresponse Bias Assessment of 2020 and 2021 Data
OMB: 0920-1273
Attachment 19a. Pregnancy Risk Assessment Monitoring System (PRAMS) Nonresponse Bias Assessment of 2020 and 2021 Data
Overview
PRAMS proposes to release all jurisdiction data, regardless of the response rate achieved by each jurisdiction based on nonresponse bias analyses described in this Attachment.
Results of the 2019 nonresponse bias analyses were previously submitted to OMB (previous Attachment 19) and suggested minimal bias in the data overall, by jurisdiction (hereafter referred to as sites) and by indicators. OMB requested that these analyses be repeated for 2020. The current report provides results from analyses of 2020 and 2021 PRAMS data. These results align with the previous 2019 results suggesting little bias in the data overall and a modest relationship between bias and response rate. An attachment describing nonresponse bias analysis for future years of PRAMS data collection will be provided as part of request for extension for OMB approval.
Due to concern for nonresponse bias and data quality, PRAMS currently implements a response rate threshold for release of data through the Automated Research File (PRAMS Data | PRAMS | CDC). Site-specific data are released through the Automated Research File and included in CDC reports if the sites reach or exceed the threshold, which since 2018 has been set at 50%. For sites whose response rate is below the threshold, data are only released to the particular site for their internal use or approval for other uses by request (such as non-response bias analyses).
Under this approach, each year PRAMS is excluding approximately one-fourth to one-third of sites from data released to researchers and used in CDC reports. The requirement to achieve a response rate threshold makes it very difficult to include data for all funded sites in analyses and to assess trends in indicators due to sites not being consistently included in the annual data release. Our partners have repeatedly requested that we remove this requirement as it limits their ability to conduct maternal and child health (MCH) research and evaluation, especially when PRAMS is the only source of data for key MCH indicators. Finally, the threshold for data release has been lowered 4 times since 2007 from 70% to the current 50%, and this is not sustainable given the current survey environment and continued declines in response rates experienced across federal surveys.
PRAMS conducted comprehensive nonresponse bias analyses examining three years of data to quantify the levels of bias observed in PRAMS indicators and examine the impact of response rates on nonresponse bias. Results indicate that the PRAMS response rate threshold did not meaningfully distinguish sites with higher versus lower levels of mean absolute bias. These results, combined with the consistently low levels of bias measured in PRAMS data for most measured indicators, provide strong evidence for removing the PRAMS response rate threshold requirement. Data for the 2023 calendar year of births (first year of Phase 9) will be released without a response rate threshold. For previous calendar years of births (Phase 8 years 2016 to 2022), data for sites that had not been released will be uploaded to the Automated Research File for use by researchers.
Response Rates
Overview
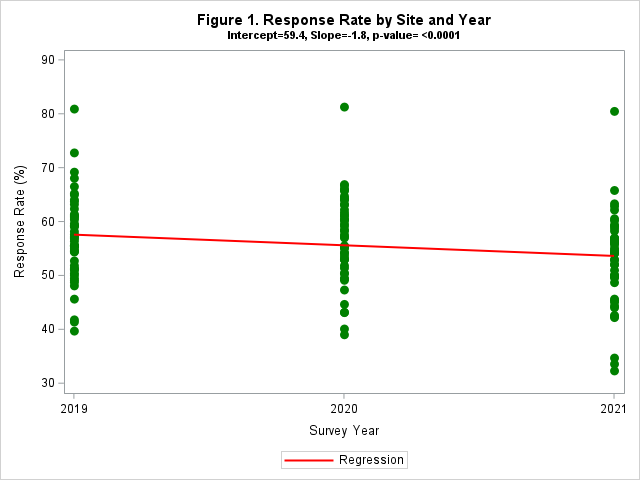
In 2019, as reported previously to OMB, weighted response rates ranged from 39.8% to 81.0% across sites, with a mean of 57.0%. In 2020, rates ranged from 39.1% to 81.3%, with a mean of 56.8%. In 2021, rates ranged from 32.4% to 80.5%, with a mean of 53.0%. A significant decline in average weighted response rates was observed across years (Figure 1), with an average decrease of 1.8% per year.
Level of Effort Analyses
Analyses shared previously with OMB using 2019 data included results from level of effort analyses. This analytical approach was not repeated with 2020 and 2021 data due to the resource-intensiveness required of the method. The level of effort analyses involved creating ‘response rate tranches’ to simulate lower response rates and allowed examination of changes in incremental average bias with decrements (or decreases) in response rate. Results indicated a linear increase in average absolute bias with increasing decrements of response rate. On average, we observed about a 0.50 percentage point increase in bias for each 10% decrease in response rates. We also conducted multi-level regression models for absolute bias for each indicator by varying response rates with 2019 data. Overall, absolute bias decreased by an average of 0.67 percentage points per 10% increase in response rate (range= 0.38 – 0.88 across indicators), which is consistent with the 0.50 percentage point decline observed from the incremental bias analysis.
True Bias Analysis
Research Questions:
What is the extent of nonresponse bias in weighted prevalence estimates calculated from PRAMS respondents when compared with “true values” of prevalence calculated from population measures available in the birth certificate?
What is the mean level of bias for each indicator, which indicators display significant bias, and does the bias show the prevalence estimates to be an under- or over-estimate of “true value”?
What is the magnitude of nonresponse bias in PRAMS within subpopulations (maternal race, maternal education, maternal age, maternal ethnicity, and maternal marital status)?
How does response rate affect bias?
Approach – Vital records birth certificate files serve as the PRAMS sampling frame, providing a rich set of auxiliary variables for this analysis. We linked the annual birth file with the PRAMS sample in 47 sites in 2019 (results provided previously) and 2020 and 46 sites in 2021 to compare population values with estimates of the population values using only PRAMS respondents and applying the analysis weights. This analysis is called a “true bias” analysis because the actual population-level prevalence is available to compare against PRAMS sample estimates. All sites, except Iowa, Texas, and Washington, gave permission for CDC to access their birth certificate file for the analysis. North Carolina participated in 2019 and 2020 but did not participate in PRAMS in 2021. Analysis weights include adjustments for nonresponse and non-coverage. We examined bias for 12 behavior, medical, and sociodemographic birth certificate variables that are similar to the topics on the PRAMS survey (Table 1).
We also examined potential nonresponse bias by comparing the prevalence estimates from the full sample, calculated using the base weights, to those from the respondents only, first using base weights and then using nonresponse-adjusted weights. This allows measurement of nonresponse bias without any sampling effects included and assessment of the effectiveness of the nonresponse adjustment weights.
Table 1. Birth Certificate Variables Examined for True Bias Analysis
Behaviors |
Medical |
Sociodemographic |
Adequacy of prenatal care (PNC) |
Gestational diabetes |
Medicaid as payment source for delivery |
Smoking before pregnancy |
Gestational high blood pressure (Hypertension) |
WIC participant* |
Smoking during pregnancy |
C-section delivery |
Previous live birth (LB) |
Breastfed in hospital |
Infertility treatment
|
|
|
Pre-pregnancy body mass index (BMI) |
|
Results
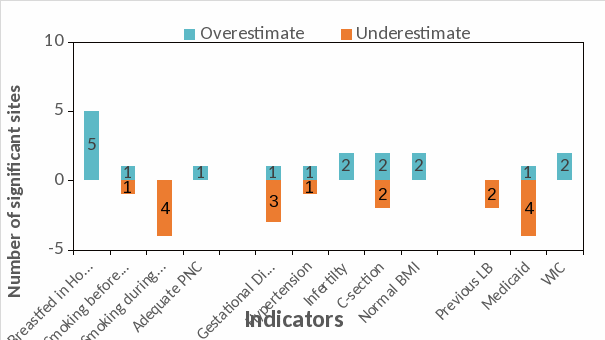
Figures 2a and 2b summarize comparisons of the population values based on birth certificate files to the sample estimates of population values from PRAMS respondents for the 12 indicators over the participating sites in 2020 and 2021, respectively. A significant difference is defined as the true population value falling outside of the 95% confidence interval (CI) for the sample estimate. Blue bars indicate the sample overestimated the population value and orange bars indicate underestimates. Given the large number of comparisons conducted (47 sites X 12 indicators = 564 comparisons), one would expect some significant differences due to random variation. Assuming alpha=0.05, one would expect 2-3 sites to exhibit significant differences for each indicator. Two indicators, breastfed in hospital and gestational diabetes, exceeded this range with significant differences in 9 and 4 sites, respectively, for 2020. For 2021, there were five indicators, breastfed in hospital, smoking during pregnancy, C-section delivery, gestational diabetes, and Medicaid recipient for delivery, with significant differences in 4-5 sites each. Positive behaviors like breastfed in hospital and adequate prenatal care were overestimated whereas health risk behaviors like smoking during pregnancy were generally underestimated.
Figure 2a. Comparison of PRAMS Sample Respondent Estimates to Population Values from Birth Certificates: Number of Significant Differences, Sample Over- and Under-estimates, 47 Sites, 2020
51
Behaviors
Medical


Figure 2b. Comparison of Respondent Estimates to Population Values: Number of Significant Differences, Sample Over- and Under-estimates, 46 Sites, 2021
When comparing the full sample to respondents, most of the nonresponse biases are nonsignificant or of minor magnitude (data not shown). For 2020, 81% of the nonresponse bias estimates were either nonsignificant or of minor magnitude (absolute bias <1.5 percentage points) prior to adjusting for nonresponse, with a maximum absolute bias of 6.7 percentage points. After implementing the nonresponse adjustment, the percentage of nonresponse bias estimates that were either nonsignificant or of minor magnitude increased to 91%, and the maximum absolute bias was reduced to 4.4 percentage points. Similar findings were observed for 2021, with 78% of the nonresponse bias estimates either nonsignificant or of minor magnitude prior to adjusting for nonresponse, and a maximum absolute bias of 7.0 percentage points. After implementing the nonresponse adjustment, the percentage of nonresponse bias estimates that were either nonsignificant or of minor magnitude increased to 91%, and the maximum absolute bias was reduced to 4.7 percentage points.
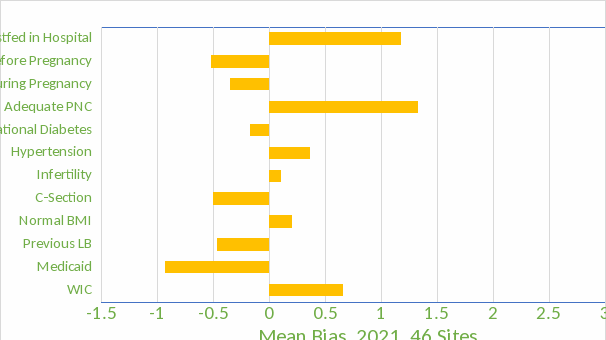
Bias by Indicator - The bias for each indicator was averaged over all sites to produce the mean bias. Figures 3a and 3b display the mean bias with CIs for each indicator for 2020 and 2021. The estimates to the right of the vertical x=0 line represent overestimates and those to the left of the vertical x=0 represent underestimates. Indicators where the 95% CI for bias overlaps the vertical x=0 line exhibit bias not significantly different from zero.
The medical indicators have the lowest levels of mean bias followed by the sociodemographic and behavior indicators. Ten of the 12 indicators have a mean bias within 1 percentage point of the population estimate for both 2020 and 2021. Only breastfed in hospital and adequate PNC have point estimates of mean bias between 1 and 2 percentage points.
Figure 3a. Mean Bias Across PRAMS Sites by Indicator, 47 Sites, 2020
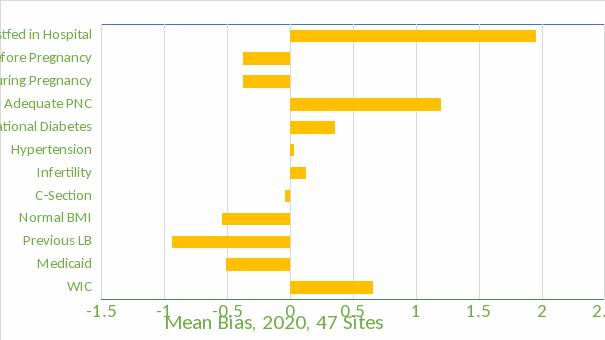
Figure 3b. Mean Bias Across PRAMS Sites by Indicator, 46 Sites, 2021

Bias by Site – We calculated the mean absolute bias across all 12 indicators for each site to examine the relationship between bias and response rates. We then computed the least squares regression line for mean absolute error as predicted by response rate. Figures 4a and 4b display the resulting scatter plots. The correlation between response rate and bias is similar across the two years, -0.52 and -0.56, respectively, indicating a modest association. Each year, 4 to 5 sites have a mean absolute bias above 2. However, as noted in the graphs, not all of these sites have a response rate below 50%. Some sites with a response rate above 50% had higher mean absolute bias than sites below the 50% threshold and vice versa. Thus, the 50% response rate threshold does not necessarily distinguish sites with higher versus lower bias.
Figures 4a and 4b. Relationship Between Mean Absolute Bias and Weighted Response Rates, 2020 and 2021
54
Correlation
between response rate and bias = -0.56
Correlation
between response rate and bias = -0.52


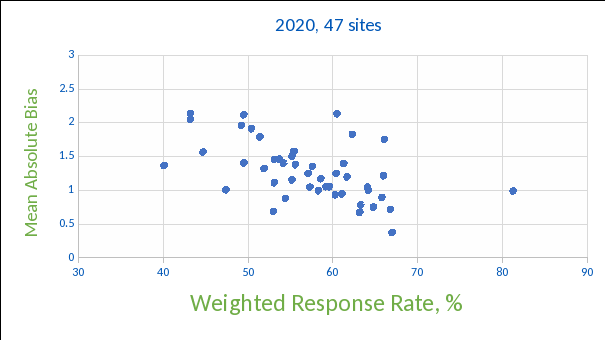
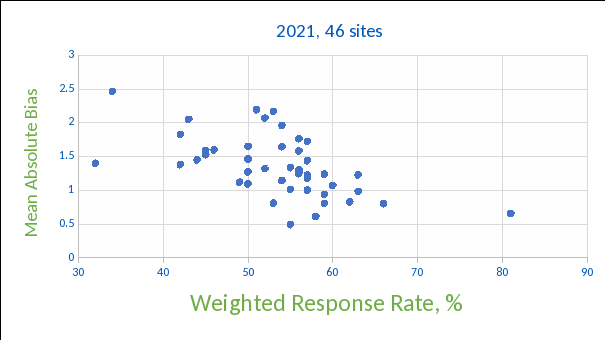
We also examined the relationship between response rates and absolute nonresponse bias for each indicator (data not shown). The results show a modest-to-weak negative correlation between response rates and absolute nonresponse bias, ranging from -0.45 to -0.11. Although a 1% reduction in average absolute nonresponse bias is associated with a 23% to 56% increase in response rates across variables, the effect size is minimal. This finding suggests that variations in response rates do not significantly affect nonresponse bias. These findings further support the argument that sites with response rates below the current PRAMS response rate threshold of 50% can produce reliable results.
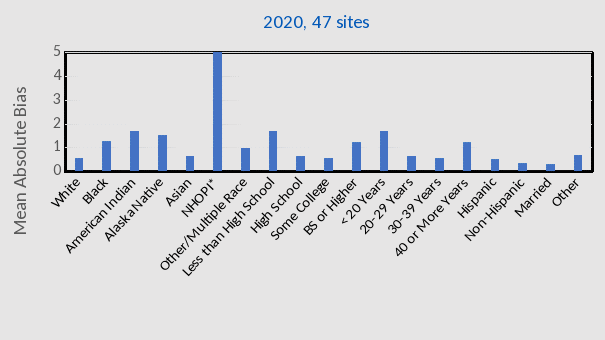
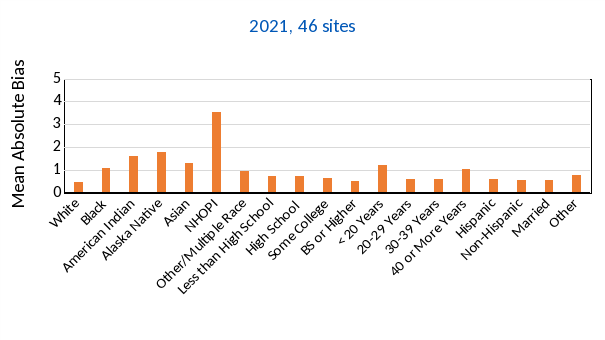
Subpopulation analysis – We also examined bias for subpopulation groups by maternal race, maternal education, maternal age, maternal ethnicity, and marital status. For this analysis, we aggregated data over all sites since some subpopulations have smaller numbers of respondents. Again, we looked at the mean absolute bias across the 12 indicators. Figures 5a and 5b display the results by subpopulation for 2020 and 2021. For all subpopulations except for Native Hawaiian/Other Pacific Islander (NHOPI), the mean absolute bias was under 2. The higher bias of 3.5 percentage points in NHOPI is likely attributed to the small number of respondents in this group.
Figures 5a and 5b. Mean Absolute Bias Across All Indicators, by Subpopulation, 2020 and 2021

Maternal
Age
Marital
Status
Maternal
Ethnicity
Maternal
Education
Maternal
Race


*NHOPI – Native Hawaiian/ Other Pacific Islander
Marital
Status
Maternal
Ethnicity

Maternal
Age
Maternal
Race
Maternal
Education


When comparing the full sample to respondents by subpopulation, we needed to pool data over three years (2019-2021) to have sufficient numbers (data not shown). Most of the nonresponse biases are predominantly nonsignificant or of minor magnitude. Before adjusting for nonresponse, 88% of the bias estimates were either nonsignificant or minor with a maximum absolute bias of 3.9 percentage points. After applying nonresponse-adjusted weights, this proportion increased to 95%, with a maximum absolute bias of 2.7 percentage points.
Summary
There was a significant decline in response rates over the years 2019 to 2021, with an average decrease of 1.8% per year. We conducted analyses assessing nonresponse bias by indicator and site for 2020 and 2021. Results were consistent with previously reported results for 2019 although mean response rates dropped from 57.0% in 2019 to 53.0% in 2021. By site, most sites (91% in 2020, 89% in 2021) had a mean absolute bias between 0.5 and 2 percentage points across the 12 birth certificate indicators we examined. By indicator, in both 2020 and 2021, 10 of 12 indicators had a mean bias < 1 percentage point across all sites. Most subpopulation estimates (74% in 2020, 84% in 2021) had mean absolute bias <1.5 percentage points. The level of effort analysis, using data from 2019, estimated a 0.5 percentage point increase in absolute bias per 10% decrease in response rates on average over many PRAMS core indicators. These results indicate low levels of bias across various dimensions. Comparisons of bias levels before and after applying the nonresponse weighting adjustment indicate the weighting adjustments performed well at reducing bias levels.
Finally, we examined the association between response rate and bias. There was a modest correlation of -0.52 in 2020 and -0.56 in 2021. Scatter plots of response rate versus mean absolute bias to assess the effectiveness of the PRAMS 50% response rate threshold revealed that the response rate did not effectively distinguish sites with higher versus lower levels of mean absolute bias. This result, combined with the low levels of bias detected in PRAMS indicators, provides strong evidence for removing the response rate threshold requirement for release of data for researchers.
| File Type | application/vnd.openxmlformats-officedocument.wordprocessingml.document |
| Author | Shulman, Holly (CDC/DDNID/NCCDPHP/DRH) |
| File Modified | 0000-00-00 |
| File Created | 2024-11-24 |
© 2026 OMB.report | Privacy Policy