Respondent-Centered Formative Research Overview
Attachment H - Respondent-Centered Formative Research Overview.docx
Annual Integrated Economic Survey
Respondent-Centered Formative Research Overview
OMB: 0607-1024
Attachment H
Department of Commerce
United States Census Bureau
OMB Information Collection Request
Annual Integrated Economic Survey
OMB Control Number 0607-XXXX
Respondent‐Centered Formative Research Overview
Purpose:
This document provides an overview of the respondent‐centered formative research conducted to support the development of the AIES. First, there is a short overview of the AIES. Then, each research project is presented, including the response size, the method of inquiry, research questions, and major findings. For more information about any of these projects, please contact Blynda Metcalf at blynda.k.metcalf@census.gov.
Contents:
Overview of the AIES
Record Keeping Study
Data Accessibility Study
Coordinated Collection Study
Survey Structure Interviewing
AIES Pilot Phase I
Planned: AIES Pilot Phase II
Planned: Usability Interviewing
Planned: Communications Testing Interviewing
Overview of the AIES
In 2015, at the request of the Census Bureau, the National Academies of Sciences convened the Panel on Reengineering the Census Bureau’s Annual Economic Surveys. This panel consisted of survey specialists, economists, and economic survey data users, and was charged to review the design, operations, and products of the Bureau’s suite of annual economic surveys of manufacturers, wholesale trade, retail trade, services, and other business activities.
The panel recommended short‐term and longer-term steps to improve the relevance and accuracy of the data, reduce respondent burden, incorporate non-survey sources of data when beneficial, and streamline and standardize Census Bureau methods and processes across surveys. One specific recommendation of the panel is the harmonization of existing economic surveys to create one integrated annual economy‐wide data collection effort. For more information, see National Academies of Sciences, Engineering, and Medicine (2018).
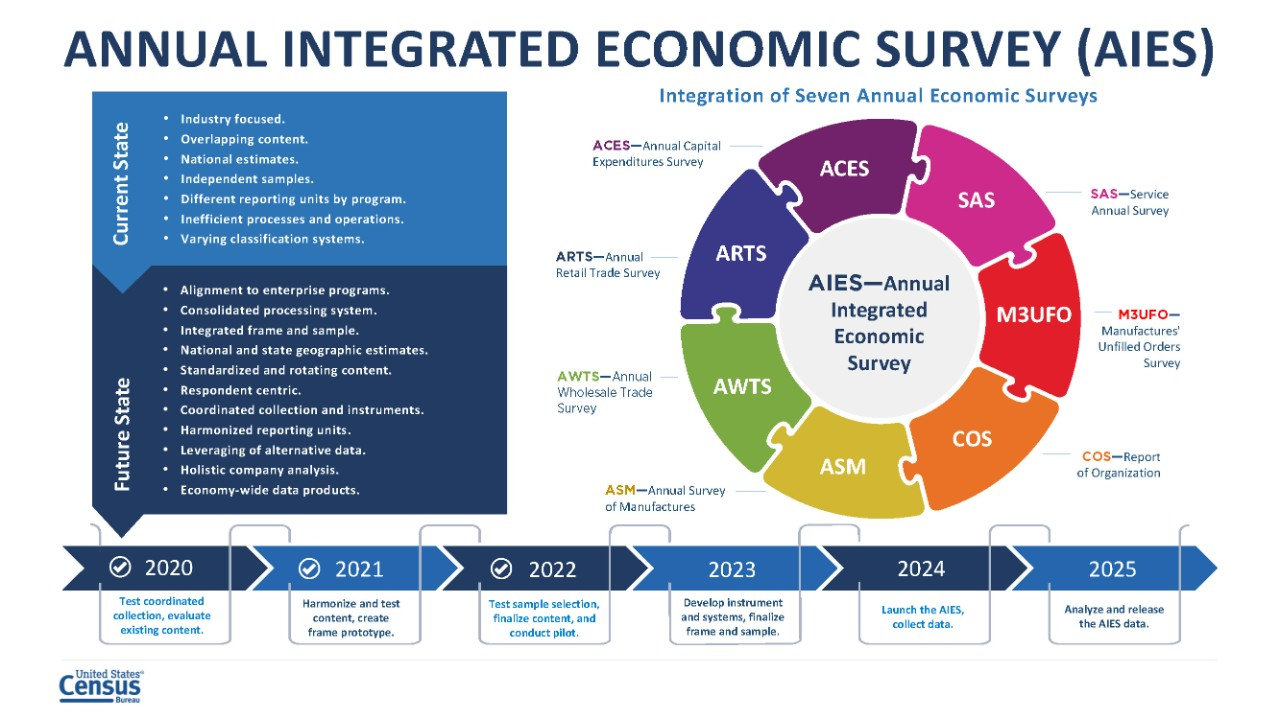
From these recommendations, the Annual Integrated Economic Survey (AIES) was conceived. The AIES represents a bringing‐together of seven annual economic surveys. These surveys use different collection units, including company‐level collection, establishment‐level collection, and industry‐level collection. They also use different collection strategies, timelines, and systems. This figure represents the integration goals, in‐scope annual surveys, and timeline for full implementation and publication.
Record Keeping Study
In the fall of 2019, Census Bureau researchers conducted 28 in depth interviews focused on how companies keep their accounts to explore the link between records and company organizational and management practices. First, interviewers asked respondents to describe in their own words what their business does or makes, and then to indicate the North American Industry Classification System (NAICS) that was most appropriate for their business. Then, researchers asked about response process for a few key variables and for Census Bureau surveys overall.
Record Keeping Study |
|
Timeline: |
Fall 2019 |
Method: |
In‐depth semi‐structured interviews of medium size companies focused on how they keep accounts and financial records |
Number of Interviews: |
28 |
Research Questions: |
|
Major Findings: |
|
Recommendations: |
|
In particular, this research was a first investigation into the ways that companies keep their accounting records so that the AIES could be designed to complement systems already in place. Researchers found that companies keep their data by a number of different units, that NAICS classifications can be unnatural or challenging for some businesses, and that for the most part, companies use their consolidated company totals as an anchor to match against any breakdowns a survey may be requesting.
For this interviewing, the interviewer protocol was built around a generic company chart of accounts. First, interviewers showed respondents a mock chart of accounts. They asked respondents to compare and contrast how their business is structured and maintains its records. They probed respondents on their chart of accounts relative to their company’s structure, industries in which the company operates, and locations, as well as the types of software used to maintain their chart of accounts.

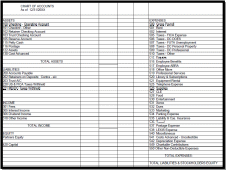
This generic chart of accounts was presented to respondents to orient them to the categories of data that may be requested by the AIES. Respondents talked about their company organization relative to this generic chart.
Once researchers had a better understanding of the company chart of accounts and record keeping practices, they could then ask follow‐up questions about specifics within their chart of accounts. Here, they were really interested in mismatches between our understanding of how records are kept and retrieved and the questions respondents encountered on Census Bureau surveys. They centered these questions around five areas as applicable to the company:
Business segments by industry (kind of business)
Sales/receipts/revenues
Inventory
Expenses, including payroll and employment
Capital expenditures.
From this research, it was recommended that the AIES take a holistic approach to surveying companies, including all parts of the business where possible. Another recommendation was that communications with respondents around units and industry classification be as clear as possible.
Data Accessibility Study
Following the Record Keeping Study, Census Bureau researchers then engaged in an additional 30 in‐depth interviews about the accessibility of their data at various levels of the business. These interviews first established definitions and equivalencies of response units. Then, respondents were asked about ‘general’ and ‘specific’ industry classifications (akin to the four‐ and six‐digit NAICS classifications). Finally, respondents used a four‐point color coded scale ranging from green (very accessible) to red (not at all accessible) to categorize data for specific topics (e.g., revenue, expenses, and payroll) at specific levels (e.g., company‐wide, by state, by establishment, or at the general and specific industry levels).
Data Accessibility Study |
|
Timeline: |
Winter 2021 |
Method: |
In‐depth semi‐structured interviews of medium size companies focused on the accessibility of their data at various levels |
Number of Interviews: |
30 |
Research Questions: |
|
Major Findings: |
|
Recommendations: |
|
This set of interviewing further detailed what data are available at what levels. Echoing the Record Keeping Study, this research found that company‐level data are the most accessible regardless of size and sector of the business, and that more granular levels of data can be increasingly challenging. At the same time, asked about the availability of data at the state level, many respondents noted that to give state‐level responses, they would need to pull the data at the establishment level and sum up to the state level.
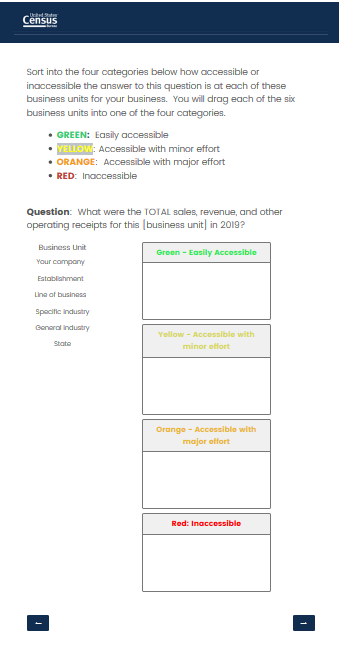
This study extended a framework put forth by Snijkers and Arentsen (2015), who developed a four‐point color coded scale as a reference for respondents when assessing the accessibility of their data at various increments, in terms of both time and organization. Census Bureau researchers operationalized the Accessibility Scale using card sort methodology by asking respondents to categorize the accessibility of data at each of the different levels of measurement by assigning each level to a color representing accessibility. The left side shows the instructions for respondents, and the right shows the interactive card sort (specifically for the question on sales, revenue, and other operating receipts). Respondents click on each unit and drag it to one of the four colors to indicate the accessibility of data at that level for revenue.

Instructions: Sort into the four
categories below how accessible or inaccessible the answer to this
question is at each of these business units for your business. You
will drag each of the six business units into one of the four
categories. Green:
Easily accessible Yellow:
Accessible with minor effort Orange:
Accessible with major effort Red:
Inaccessible

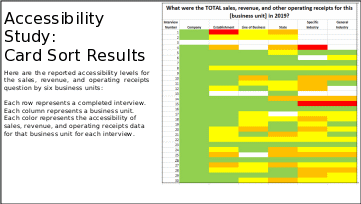
One of the benefits to conducting the card sort is that the resultant data can be displayed in compelling ways. Displayed here are the results of just the revenue question. Almost all respondents could provide data by company, the largest unit. Notice, though, as respondents move through the various units, there is less categorized as ‘green – accessible with no effort.’ At the establishment, line of business, and state levels, about half of respondents could provide revenue data with little to no effort (yellow or green), however, some respondents say that it would be a ‘major’ effort to pull these data, especially at the state level. Looking at NAICS (general and specific industry), there is a decline in the number of respondents who said that revenue data were easily accessible or accessible with minor effort.
Key:
Accessible
with
no
effort
Accessible
with
minor
effort
Accessible
with
major
effort
Not
accessible
Interview
data
uncodeable
Coordinated Collection Respondent and Non-Respondent Debriefing Interviews
In preparation for the integrated survey, staff at the Census Bureau began a program of consolidating company contacts across the current annual surveys to identify one primary contact for the AIES. To better understand how contact consolidation might impact response processes, researchers conducted two rounds of debriefing interviews. The first was 35 interviews with responding companies during which Census Bureau researchers asked questions about communication materials and challenges. The second round was 19 interviews with non‐responding companies to understand where response may have broken down.
Coordinated Collection Respondent and Non-Respondent Debriefing Interviews |
|
Timeline: |
Summer 2020 and Summer 2021 |
Method: |
Phone debriefing interviews |
Number of Interviews: |
35 respondents, 19 non-respondents |
Research Questions: |
|
Major Findings: |
|
Recommendations: |
|
From the respondent debriefing interviews, researchers noted that many respondents did not receive or do not remember receiving many of the communications that the Census Bureau but some of this may be related to the COVID‐19 global pandemic. Respondents generally evaluated Census Bureau communications positively (especially the online Respondent Portal), but that respondents’ experiences with reaching out for support from the Census Bureau can be mixed (specifically when attempting to update company contact information). Non‐respondent debriefings identified barriers to response, including company‐related issues like staffing shortages and data being decentralized, surveys that do not reflect current company structure, and communication shortfalls from the Census Bureau.
Survey Structure Interviewing
In the winter 2022, Census Bureau researchers conducted 39 interviews with companies focused on preliminary ‘mock ups’ of survey screens designed to give respondents an overview of the survey at large. Respondents were asked about their record keeping practices and preferences for reporting (e.g., using a spreadsheet or the traditional page‐by‐page response). Finally, respondents were asked to reflect on the concept of the AIES as a whole, their thoughts about the overall design, and their thoughts on its effect on their burden.
Survey Structure Interviewing |
|
Timeline: |
Winter 2022 |
Method: |
Interviews with companies in various industries using mockups of modules and survey |
Number of Interviews: |
39 |
Research Questions: |
|
Major Findings: |
|
Recommendations: |
|
Researchers noted that the AIES introduces complexities for response both at the units of collection (company, establishment, and industry) and by the various topics mixed into one survey. Respondents talked about planning their response process. Respondents indicated wanting to use a downloadable spreadsheet option to gather their data first, then enter it into the survey. Once the data was entered into the survey, they wanted to submit data across all survey sections at one time, instead of section by section. Respondents also stressed their reliance on survey previews (as PDFs or otherwise) to make a plan for data collection. Recommendations from this research include careful communications around collection unit and classification and providing a respond‐by‐spreadsheet option.
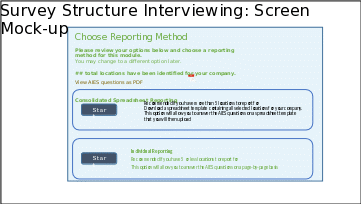
Here is an example of the type of screen mock‐up that was presented to respondents during the Survey Structure Interviewing. This screen introduces respondents to the option of responding to the survey by a spreadsheet that is downloaded, completed, and then uploaded to submit to the Census Bureau, or to respond by page‐by‐page typical survey layout. Note that this screen also contains a PDF preview of the full survey, another feature about which respondents had a positive reaction.
AIES Pilot Phase I
Census Bureau researchers determined that the next research step was to induce independent response from the field for the integrated survey. In March 2022, the AIES Pilot Phase I launched to 78 companies from across the country. In total, 62 companies (79 percent) provided at least some response data to the survey. In addition to the online survey, seven companies participated in debriefing interviews asking about response processes for the integrated instrument, 15 companies completed a Response Analysis Survey (a short survey with questions centered on real and perceived response burden).
AIES Pilot Phase I |
|
Timeline: |
Spring 2022 |
Method: |
Online survey instrument, respondent debriefing interviews, Response Analysis Survey (RAS), and contact from the field |
Number of Interviews: |
78 |
Research Questions: |
|
Major Findings: |
|
Recommendations: |
|
During the Pilot field period, researchers catalogued phone and email contact from respondents requesting additional information, asking questions, or otherwise reaching out for support for additional data on instrument performance. The Phase I Pilot was focused on understanding response process for the integrated survey. The survey was broken into four sections that corresponded to units of collection ‐ company, establishment, and industry, plus one section for newly opened or acquired establishments. In general, respondents used both response spreadsheets and screen‐by‐screen response. Some questions were asked at more than one collection unit, which added to response burden. And, respondents mentioned using communications materials to respond, like PDF survey previews.
On the question of response process, respondents noted in debriefing interviews that they are using a response process similar to the current annual surveys, mainly, relying on PDF previews and matching questions to their company records. Company level data were the most reported of any level and were reported more completely than any other level in the survey. Respondents also showed a preference to respond by page‐by‐page typical survey layout for company‐level requests, and by spreadsheet for establishment and industry‐level data.
Investigating burden, the results are mixed. A total of 15 companies that responded in full or in part to the AIES Pilot Phase I instrument also responded in full or in part to the Response Analysis Survey. Asked to estimate actual burden, respondents reported on average that the survey took about 16 hours to complete. The range is wide, from a low of 3 hours to a high of around 40 hours. At the same time, respondent reported perceived response burden is mixed, too, with some saying the pilot survey was difficult, and others saying it was easy or not difficult, and some reporting that the pilot took more time than usual annual reporting, and others saying it took less time or about the same amount of time. Researchers recommend additional response‐burden focused research.
In Progress: AIES Pilot Phase II
Beginning in the spring of 2023, a Phase II of the AIES Pilot will launch. About 900 companies will be given the Phase II pilot response spreadsheet in place of their current in‐scope annual surveys, including 62 companies that provided at least some response data to the Phase I instrument. The Phase II Pilot will duplicate the additional research methodologies of the Response Analysis Survey, respondent debriefing interviews, and cataloguing contact from the field.
Planned: AIES Pilot Phase II |
|
Timeline: |
Spring 2023 |
Method: |
Online survey instrument, respondent debriefing interviews, Response Analysis Survey (RAS), and contact from the field |
Number of Interviews: |
≈ 800 |
Research Questions: |
|
Goals: |
|
The major goals of the Phase II Pilot are to understand how respondents are interacting with the updated holistic listing spreadsheet design, and to continue to refine and tailor support documentation like walkthroughs based on these interactions. There will also be additional investigations into actual and perceive burden.
Planned: Usability Interviewing
Beginning in the spring of 2023, and spanning through the fall, researchers will conduct a series of usability interviews testing the AIES instrument. During this interviewing, respondents will be asked to complete a series of response‐related tasks, and interviewers will note the ways that respondents interact with the survey, especially in cases where task completion is unsuccessful. Goals of this testing include identifying those places on the survey where response is intuitive and non‐intuitive, and to further develop and refine response support materials, particularly focused on communicating those non‐intuitive features to respondents.
Planned: Usability Interviewing |
|
Timeline: |
Spring through Fall 2023 |
Method: |
Task-focused interviewing |
Number of Interviews: |
≈ 75 |
Research Questions: |
|
Goals: |
|
Planned: Communications Testing Interviews
Census Bureau researchers are also planning to conduct communications‐focused interviews with up to 20 businesses across various industries and characteristics. These interviews will ask respondents about recall and comprehension of communications used in the AIES Pilot Phase II, as well as identify activating messaging that may be more likely to encourage response.
Planned: Communications Testing Interviews |
|
Timeline: |
Spring through Fall 2023 |
Method: |
Communications-focused Interviewing |
Number of Interviews: |
≈ 20 |
Research Questions: |
|
Goals: |
|
Works Cited:
National Academies of Sciences, Engineering, and Medicine. 2018. Reengineering the Census Bureau’s Annual Economic Surveys. Washington, DC: The National Academies Press. doi: https://doi.org/10.17226/25098.
Snijkers, Ger and Kenneth Arentsen. 2015. "Collecting Financial Data from Large Non‐ Financial Enterprises: A Feasibility Study." Presentation at the 4th International Workshop on Business Data Collection Methodology, Bureau of Labor Statistics, Washington, DC.
Publication: February, 2023
| File Type | application/vnd.openxmlformats-officedocument.wordprocessingml.document |
| File Title | Microsoft PowerPoint - AIES report draft cidade.pptx |
| Author | cidad001 |
| File Modified | 0000-00-00 |
| File Created | 2024-11-14 |
© 2026 OMB.report | Privacy Policy