Final Supporting Statement A - NASA OSTEM Performance Measurement and Evaluation Testing (8-1-24) RENEWAL
Final Supporting Statement A - NASA OSTEM Performance Measurement and Evaluation Testing (8-1-24) RENEWAL.docx
Generic Clearance for the NASA Office of STEM Engagement Performance Measurement and Evaluation (Testing)
OMB: 2700-0159
SUPPORTING STATEMENT - PARTS A & B
Title of information collection: Generic clearance for the NASA Office of STEM Engagement performance measurement and evaluation (testing)
Type of information collection: Renewal of an Existing Collection
Summary of changes since last renewal:
Updated the listing of surveys under the clearance under Question #1 removing the old surveys we're not using
Removed 9 Information Collections
Removed the old example summaries of methodological testing results and added examples for the Internship Experience Survey and the K-12 STEM Inventory
Updated the burden (slight increases)
Abstract: NASA is committed to effectively performing the Agency’s communication function in accordance with the Space Act Section 203 (a)(3) to “provide for the widest practicable and appropriate dissemination of information concerning its activities and the results thereof,” and to enhance public understanding of, and participation in, the nation’s aeronautical and space program in accordance with the NASA Strategic Plan.
The NASA Office of Science, Technology, Engineering, and Math (STEM) Engagement (OSTEM) administers the agency's national stem engagement and education activities in support of the Space Act, including the performance assessment and evaluation of OSTEM projects, programs and NASA STEM engagement investments. This generic clearance will allow the NASA OSTEM to continue to test and pilot with subject matter experts, secondary students, higher education students, educators, and interested parties new and existing information collection forms and assessment instruments for the purposes of improvement and establishing validity and reliability characteristics of the forms and instruments. Existing information collections include the NASA Student STEM Inventory (Grades 4-12), NASA OSTEM Educator Professional Development (EPD) Pre- and Post-Workshop Learning Assessment (Surveys), NASA Internship Program Evaluation (Internship Retrospective Survey, Internship Experience Survey, and Semi-Structured Focus Group Protocol), NASA CONNECTS Evaluation Survey and Focus Group Protocol, MUREP Outcome Student Participant and Principal Investigator Focus Group Protocols. Forms and instruments to be tested include program application forms, customer satisfaction questionnaires, focus group protocols, and project activity survey instruments. Methodological testing will include focus group discussions, pilot surveys to test new individual question items as well as the complete form and instrument. In addition, test-retest and similar protocols will be used to determine reliability characteristics of the forms and instruments. Methodological testing will assure that forms and instruments accurately and consistently collect and measure what they are intended to measure and that data collection items are interpreted precisely and consistently, all towards the goal of accurate Agency reporting while improving the execution of NASA STEM Engagement activities.
Explain the circumstances that make the collection of information necessary.
Identify any legal or administrative requirements that necessitate the collection. Where applicable, attach a copy of the appropriate section of each statute and regulation mandating or authorizing the collection of information.
The National Aeronautics and Space Administration inspires the world with our exploration of new frontiers, our discovery of new knowledge, and our development of new technology in support of the vision to discover and expand knowledge for the benefit of humanity.
The NASA Office of STEM Engagement (OSTEM) supports that mission by deploying programs to advance the next generation’s educational endeavors and expand partnerships with academic communities (see Appendix A).
NASA has a long history of engaging the public and students in its mission through educational and outreach activities and programs. NASA’s endeavors in education and public outreach began early on, driven by the language in Section 203 (a) (3) of the Space Act, “to provide for the widest practicable and appropriate dissemination of information concerning its activities and the results thereof, and to enhance public understanding of, and participation in, the Nation’s space program in accordance with the NASA Strategic Plan.” NASA’s education and outreach functions aim to inspire and engage the public and students, each playing a critical role in increasing public knowledge of NASA’s work and fostering an understanding and appreciation of the value of STEM and enhancing opportunities to teach and learn. By augmenting NASA’s public engagement and communicating NASA’s work and value, the Agency contributes to our Nation’s science literacy. NASA is committed to inspiring an informed society; enabling the public to embrace and understand NASA’s work and value, today and tomorrow; engaging the public in science, technology, discovery, and exploration; equipping our employees to serve as ambassadors to the public, and providing unique STEM opportunities for diverse stakeholders.
The OSTEM Performance and Evaluation (P&E) Team supports the performance assessment and evaluation of NASA’s STEM Engagement investments executed through headquarters and across the ten Center STEM Engagement Offices. The P&E Team became lead for performance measurement and program evaluation activities within OSTEM on October 1, 2017. Responsibilities include recommending and implementing agency-wide strategy for performance measurement and evaluation; ensuring the collection of high-quality data; process documentation of NASA Education projects; formative and outcome evaluations; training and technical assistance on performance measurement and evaluation. The P&E Team’s goal is to provide support that improves education policy and decision-making, provides better education services, increase evaluation rigor and accountability, and ensures more effective administration of investments. The Educational Platform and Tools Team supports the NASA STEM Engagement community in the areas of information technology, dissemination and Web services, and communications and operations support. These two teams in collaboration support the overall performance assessment of NASA STEM Engagement investments across the agency.
The purpose of this request is to renew the clearance for methodological testing in order to continue to enhance the quality of OSTEM’s data collection instruments and overall data management through interdisciplinary scientific research, utilizing best practices in educational, psychological, and statistical measurement. OSTEM is committed to producing the most accurate and complete data within the highest quality assurance guidelines for reporting purposes by OSTEM leadership and by authority of the Government Performance and Results Modernization Act (GPRMA) of 2010 that requires quarterly performance assessment of Government programs for purposes of assessing agency performance and improvement. It is with this mission in mind, then, that this clearance package is submitted.1
Under the current clearance (2700-0159 OMB Control Number) for the NASA OSTEM Performance Measurement and Evaluation (Methodological Testing) the following information collections were approved for pilot testing.
NASA Student STEM Inventory (Grades 4-12)
NASA OSTEM Educator Professional Development (EPD) Pre- and Post-Workshop Learning Assessment (Surveys)
NASA Internship Program Evaluation (Internship Retrospective Survey, Internship Experience Survey, and Semi-Structured Focus Group Protocol)
NASA CONNECTS Evaluation Survey and Focus Group Protocol
MUREP Outcome Student Participant and Principal Investigator Focus Group Protocols
The P&E Team conducted an internal assessment of the OSTEM information collections above to determine the outcome and results of the methodological testing. Available documentation and testing technical reports provided the example summary of methodological testing results for the Internship Experience Survey and the K-12 STEM Inventory. Within each section a brief overview of the survey is provided followed by a description of the validity and reliability of the instrument.
1 The entire GPRMA of 2010 can be accessed at http://www.gpo.gov/fdsys/pkg/BILLS-111hr2142enr/pdf/BILLS- 111hr2142enr.pdf.
Internship Experience Survey – Sense of Belonging
The Internship Experience Survey is a 7-item survey that measured interns’ Sense of Belonging (Figure 1). The Internship Experience Survey was piloted with the FY24 Spring session of interns to better understand the short-term impact of the NASA OSTEM internship, specifically focused on STEM Identity and Sense of Belonging. Survey items were adapted from the existing NASA Minority University Research and Education Project (MUREP) Outcome Assessment, which was validated in FY23. The survey was conducted over a two-week period using Survey Monkey. Reminders to complete the survey were sent approximately every three days during the active survey period. A total of 329 interns were invited to participate in the survey, with 145 interns responding to the survey (44% response rate).
The seven items used for the overall Sense of Belonging score.
-
Item #
Sense of Belonging Item
1
Representatives who are part of the NASA OSTEM Internship Program notice when I am good at something. (PB1)
2
Representatives who are part of the NASA OSTEM Internship Program value my opinions. (PB2)
3
Representatives who are part of the NASA OSTEM Internship Program know I can do good work. (PB3)
4
I can really be myself in the NASA OSTEM Internship Program community. (PB4)
5
During this internship, it is likely that I will find opportunities to connect and learn more from the professional representatives within the NASA OSTEM Internship Program. (OE1)
6
During this internship, it is likely that I will attend a seminar, workshop, or professional learning opportunity as part of the NASA OSTEM Internship Program. (OE2)
7
During this internship, it is likely that I will visit the lab of a representative who is a member of the NASA OSTEM Internship Program. (OE3)
Construct Validity
The modified Sense of Belonging scale consists of a two-factor structure with items rated on a 6-point Likert scale from Strongly Disagree to Strongly Agree. Interns' scores on the Sense of Belonging scale were summed to create a composite sense of belonging score ranging from 7 to 42. Higher scores indicate a greater Sense of Belonging to the NASA OSTEM internship community.
The modified Sense of Belonging scale consists of a two-factor structure with items rated on a 6-point Likert scale from Strongly Disagree to Strongly Agree. Interns' scores on the Sense of Belonging scale were summed to create a composite sense of belonging score ranging from 7 to 42. Higher scores indicate a greater Sense of Belonging to the NASA OSTEM internship community. Confirmatory factor analysis (CFA) was conducted to examine the relationships between the two constructs of the Internship Sense of Belonging survey (Perceived Belonging and Opportunity for Engagement) and the 7 Inventory items (Table 1). The structural equation modeling approach fit measures for the model (see x) indicated a good fit overall (Hu & Bentler, 1999; Yu, 2002). The Root Mean Square Error of Approximation (RMSEA) meets fit guidelines of 0.06 or lower. The comparative fit index (CFI) is 0.99, meeting the >.95 guideline. Finally, the non-significant p-value (p > .05) for the χ2 index means the model's predictions are not significantly different from the actual data. This good model fit indicates that the observed data aligns well with the three-factor structure: the predictions closely match the actual data, and the factors explain a significant amount of the variance in the observed variables.
The CFA loadings (Figure 2) indicated strong associations between the latent constructs and their respective items, with high statistical significance. The standardized estimates ranged from moderate to strong, suggesting that the measurement model is supported by the data.
Table 1. Fit Measures for the NASA Internship Sense of Belonging survey
-
Test for Exact Fit
RMSEA 90% CI
χ²
df
p
CFI
TLI
RMSEA
Lower
Upper
13.7
13
.40
0.99
0.99
0.02
0.00
0.09

Figure 2. Path Diagram
Confirmatory Factor Analysis Loadings
Correlations among factor loadings and residuals (Table 2) across the two latent constructs, Perceived Belonging and Opportunity for Engagement suggest strong association between the latent constructs and their respective items. The findings are statistically significant, suggesting a strong factor structure.
Table 2. Factor Loadings
-
Factor Loadings
Residuals
Factor
Item
Stand. Estimate
SE
p
Stand. Estimate
SE
p
Perceived Belonging
(PrB)
PB1
.87
.08
< .001
.24
.05
< .001
PB2
.96
.07
< .001
.08
.02
< .001
PB3
.89
.06
< .001
.21
.03
< .001
PB4
.83
.07
< .001
.32
.05
< .001
Opportunity for Engagement
(OpE)
OE1
.83
.09
< .001
.32
.08
< .001
OE2
.68
.10
< .001
.53
.12
< .001
OE3
.55
.12
< .001
.70
.19
< .001
Content Validity
A panel of experts reviewed each item in the Fall of 2022 to determine their appropriateness for measuring students experience of belonging.
Reliability - Internal Consistency
Internal consistency analysis was conducted for both subscales of the NASA Internship Sense of Belonging survey. The 4-item Perceived Belonging subscale reported a Cronbach’s alpha of .93 while the Opportunity for Engagement reported an internal reliability estimate of .72.
Findings & Recommendations
Short-term impacts such as Sense of Belonging of the NASA OSTEM Internship Program were examined. The key findings from the Internship Experience Survey are:
There were no significant differences in the Sense of Belonging scores for FY24 Spring interns between subgroups such as gender, race, grade level (undergraduate or graduate), MSI status (non-MSI or MSI), and internship modality (virtual, in-person, hybrid).
On average FY24 Spring interns who completed the survey rated their belongingness at the level of “agree” or five out of six.
Recommendation for future iterations of survey administration:
This survey was piloted with one session (i.e., FY24 Spring interns). Consider administering the Internship Experience survey as a Retrospective post-then-prequestionnaire design. This design allows for a single administration but gives respondents a prompt to recall and compare before and after program experience.
NASA STEM Inventory (Grades 4-12)
A key accomplishment of the portfolio of K-12 studies has been creating and testing the NASA STEM Inventory for use with elementary, middle school, and high school-aged youth. Confirmatory factor analysis and Item Response Theory analyses confirmed the three-factor structure of STEM Interest, STEM Identity, and STEM Performance. Recommendations are offered to improve items that do not offer sufficient measurement discrimination for respondents with high levels of STEM Identity, Interest, and Performance.
In FY23, factor analysis confirmed a three-factor structure:
STEM Identity - personal and outside perceptions of self as a STEM person
STEM Interest - interest to learn and try STEM activities
STEM Performance - engagement and leadership in STEM projects
The Flesch Kincaid readability statistic (ease and grade level) places the items of the instrument at the reading level of a typical 4th grade student. The instructions for the Privacy Act Notification and Paperwork Reduction Act Statement are at the reading level of a post-high school student.
Table 3. NASA STEM Inventory (Grades 4-12) Items
-
STEM Outcomes
STEM Identity
STEM
Interest
STEM Performance
My parents or guardians think I am good at STEM (SID1)
My teachers think I am good at STEM (SID2)
My friends think I am good at STEM (SID3)
I like learning about STEM (ST1)
I like to solve STEM problems (ST2)
I get excited about doing STEM projects (ST3)
I think of STEM things to try out (ST4)
I see myself as a STEM person (ST5)
I am a good team member when I work in a group on a STEM project (SP1)
I can finish a project by its due date (SP2)
When a project does not work out, I can think of other ways to do it (SP3)
I can be the leader of a team working on a project (SP4)

Response options: Disagree a lot (1); Disagree a little (2); Agree a little (3); Agree a lot (4)
Construct Validity
Confirmatory factor analysis (CFA) was conducted to examine the relationships between the three constructs of the STEM inventory scale (STEM Identity, STEM Interest, and STEM Performance) and the 12 Inventory items. The structural equation modeling approach fit measures for the model (see Table 4) indicated a good fit overall (Hu & Bentler, 1999; Yu, 2002). The Root Mean Square Error of Approximation (RMSEA) meets fit guidelines of 0.06 or lower. The comparative fit index (CFI) is 0.97, meeting the >.95 guideline. Finally, the non-significant p-value (p > .05) for the χ2 index means the model's predictions are not significantly different from the actual data. This good model fit indicates that the observed data aligns well with the three-factor structure: the predictions closely match the actual data, and the factors explain a significant amount of the variance in the observed variables.
The CFA loadings (Figure 3) indicated strong associations between the latent constructs and their respective items, with high statistical significance. The standardized estimates ranged from moderate to strong, suggesting that the measurement model is supported by the data.
Table 4. Fit Measures
-
Test for Exact Fit
RMSEA 90% CI
χ²
df
p
CFI
TLI
RMSEA
Lower
Upper
191
51
< .001
0.97
0.96
0.06
0.06
0.07
Confirmatory Factor Analysis Loadings
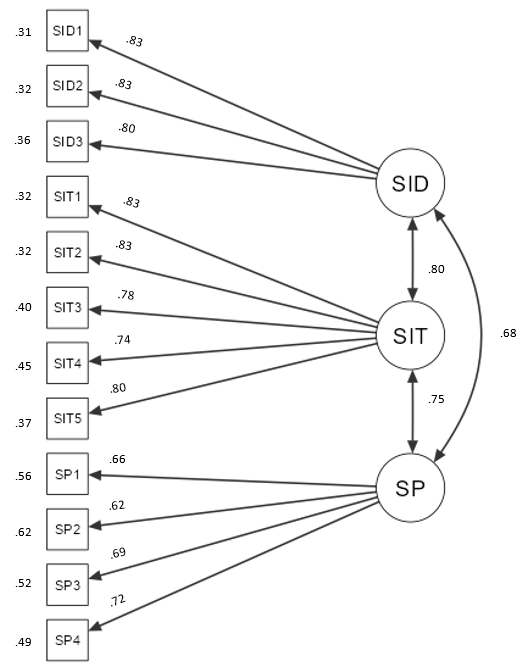
Correlations among factor loadings and residuals (Table 5) across the three latent constructs, SID (STEM Identity), SIT (STEM Interest), and SP (STEM Performance), suggest strong association between the latent constructs and their respective items. The findings are statistically significant, suggesting a strong factor structure.
Table 5. Factor Loadings
-
Factor Loadings
Residuals
Factor
Item
Stand. Estimate
SE
p
Stand. Estimate
SE
p
STEM Identity
(SID)
SID1
0.83
0.02
< .001
0.31
0.01
< .001
SID2
0.83
0.03
< .001
0.32
0.01
< .001
SID3
0.80
0.03
< .001
0.36
0.02
< .001
STEM Interest
(SIT)
SIT1
0.83
0.02
< .001
0.32
0.01
< .001
SIT2
0.83
0.03
< .001
0.32
0.02
< .001
SIT3
0.78
0.03
< .001
0.40
0.02
< .001
SIT4
0.74
0.03
< .001
0.45
0.02
< .001
SIT5
0.80
0.04
< .001
0.37
0.03
< .001
STEM Performance
(SP)
SP1
0.66
0.03
< .001
0.56
0.02
< .001
SP2
0.62
0.03
< .001
0.62
0.02
< .001
SP3
0.69
0.03
< .001
0.52
0.02
< .001
SP4
0.72
0.04
< .001
0.49
0.03
< .001
All three items of the SID construct (SID1, SID2, SID3) have strong standardized estimates (Table 6), ranging from 0.80 to 0.83. All p-values were less than 0.001, indicating high significance.
The CFA loadings show strong associations between the latent constructs and their respective items, with high statistical significance, indicating that the data supports the measurement model.
-
Factor
Stand. Estimate
SE
p
SID
SID
1.00a
SIT
0.80
0.02
< .001
SP
0.75
0.03
< .001
SIT
SIT
1.00a
SP
0.68
0.03
< .001
SP
SP
1.00a
Note. a= fixed parameter
Item Analysis Using Graded Response Model
A Graded Response (GRM) analysis was used to provide additional information about item functioning. To account for required assumptions in this statistical test, each of the STEM constructs was tested individually. Each set of findings is reported separately.”
STEM Identity Scale GRM Results
Table 7 provides response percentages for three STEM Identity scale survey items. Most respondents (over 50%) either "Agree a lot" that their parents/guardians, teachers, and friends think they are good at STEM. The highest level of agreement ("Agree a lot") is for the statement about parents/guardians believing the respondent is good at STEM, with 63.1% agreeing.
Table 7. Response Percentages for STEM Identity Scale (N = 645)
-
Item
Disagree a lot (0)
Disagree a little (1)
Agree a little (2)
Agree a lot (3)
My parents or guardians think I am good at STEM (SID1)
2.8
6.5
27.6
63.1
My teachers think I am good at STEM (SID2)
3.1
7.6
30.1
59.2
My friends think I am good at STEM (SID3)
5.7
11.2
32.6
50.5
Note. The initials in parenthesis after each ‘Item’ are the short form for the survey statement.
Table 8 reports the conversion of STEM Identity survey raw scores to ‘Agreeableness scores’ (Theta scores), the degree of agreeableness across all three survey items combined. Raw scores range from 0 to 9 and Theta scores from -2.51 to 0.87. Lower scores indicate lower agreeableness on the latent STEM Identity trait.
The standard errors (SE) vary across the Theta scores, with the largest SE (0.64) at a Theta score of .87 and the smallest SE (0.31) at Theta scores of -1.76 and -1.51. Theta score (agreeableness) estimates may be less precise at the upper end of the STEM Identity agreeableness range.
Table 8. STEM Identity Total Raw Score to Theta Score Conversion
-
Raw score
Theta
SE
0
-2.51
0.42
1
-2.05
0.32
2
-1.76
0.31
3
-1.51
0.31
4
-1.24
0.33
5
-0.97
0.34
6
-0.68
0.33
7
-0.34
0.35
8
0.09
0.40
9
0.87
0.64
Table 9 provides information on the discrimination parameters (slope), response category thresholds, and item goodness of fit for the three STEM Identity scale items (SID1, SID2, SID3). The high slope parameter for SID1 (4.22) indicates that this item differentiates among respondents with varying levels of STEM Identity.
Item goodness of fit index (S-χ2) compares GRM predictions to participants' actual response. A high value means a lack of fit for that question. SID2 and SID3 have non-significant S-χ² values, indicating a reasonable fit for these items. SID1 has a significant lack of fit (S-χ² = 29.41, P < 0.01), suggesting a poor fit for this item.
Table 9. STEM Identity Scale Slope (Discrimination) Parameters, Response Category Thresholds (Difficulty) parameters and Item Goodness of Fit index
-
Item
Slope
Response Category Thresholds
Item Goodness of Fit
Category 1
Category 2
Category 3
S-χ²
P
SID1
4.22
-2.09
-1.41
-0.36
29.41
<0.01
SID2
3.85
-2.08
-1.37
-0.26
5.30
0.92
SID3
2.81
-1.88
-1.13
-0.02
10.14
0.60
Item information curves and category response curve illustrate the amount of information each item provides in estimating STEM Identity across different agreeability levels (Theta) and the response distribution across the four response options. SID1 provides the most information between Theta -2.5 and 0. In contrast, SID3 provides the lowest information for the same Theta range.
The total information curve illustrates the amount of information the STEM Identity scale provides across different Theta scores ranging from -2.8 to 2.8. The Test Information Function values are highest at Theta scores between -2 and 0, indicating that the STEM Identity scale is most informative for respondents with low to average agreeability on the latent STEM Identity trait. The expected standard errors decrease as the Test Information Function values increase, suggesting that the precision of the Theta score estimates improves as the scale provides more information.
STEM Identity Scale Key Takeaways
The analysis revealed that the STEM Identity scale is most informative for respondents with low to average agreeability on the latent STEM Identity trait.
SID1 is the most effective item in differentiating respondents with varying levels of STEM Identity yet fit analysis revealed poor fit. Consider reviewing and potentially revising this item to improve model fit.
Consider replacing SID3 with another item that provides more information on the upper end of the Theta range because SID3 offers the least information for the same Theta range covered by SID1 and SID2.
STEM Interest Scale GRM results
Table 10 reports response percentages for the STEM Interest scale across five items, with responses ranging from "Disagree a lot" to "Agree a lot." The highest level of agreement ("Agree a lot") was reported for the statement about liking learning about STEM, with 61.5% agreeing.
Table 10. Response Percentages for STEM Interest Scale (N = 525)
-
Item
Disagree a lot (0)
Disagree a little (1)
Agree a little (2)
Agree a lot (3)
I like learning about STEM (SIT1)
3.0
4.4
31.0
61.5
I like to solve STEM problems (SIT2)
5.3
9.7
35.6
49.3
I get excited about doing STEM projects (SIT3)
4.2
8.2
29.7
57.9
I think of STEM things to try out (SIT4)
8.0
16.4
34.1
41.5
I see myself as a STEM person (SIT5)
14.5
15.4
26.5
43.6
Note. The initials in parenthesis after each ‘Item’ are the short form for the survey statement.
Table 11 reports the conversion of raw scores from the 5-item STEM Interest survey to Theta scores and standard errors (SE). The Theta scores range from -2.53 to 0.50, with lower scores indicating lower agreeableness on the STEM Interest latent trait. The Theta scores increase as the raw scores increase, indicating that higher raw scores (reflecting higher interest in STEM) correspond to higher Theta scores (indicating higher agreeableness with the latent STEM Interest trait).
Table 11. STEM Interest Total Raw Score to Theta Score Conversion
-
Raw score
Theta
SE
0
-2.53
0.43
1
-2.12
0.32
2
-1.89
0.29
3
-1.69
0.28
4
-1.51
0.28
5
-1.33
0.28
6
-1.16
0.28
7
-0.98
0.28
8
-0.81
0.28
10
-0.64
0.28
11
-0.46
0.28
12
-0.26
0.29
13
-0.05
0.30
14
0.19
0.33
15
0.50
0.38
The standard errors (SE) are relatively consistent across the range of raw scores with a slight increase at the higher end of the Theta scale, suggesting that the precision of the Theta score estimates may be slightly lower for respondents with higher agreeability on the latent STEM Interest trait.
Results from the GRM item analysis for the STEM Interest scale are presented in Table 12. The analysis includes each item's slope (Discrimination) parameters, response category thresholds (Difficulty) parameters, and the Item Goodness of Fit index.
Table 12. STEM Interest Scale Slope Parameters (Discrimination), Response Category Thresholds (Difficulty) Parameters, and Item Goodness of Fit Index
-
Item
Slope
Response Category Thresholds
Item Goodness of Fit
Category 1
Category 2
Category 3
S-χ²
P
SIT1
4.25
-2.05
-1.53
-0.32
23.17
0.23
SIT2
3.12
-1.85
-1.14
0.01
26.06
0.30
SIT3
2.87
-2.03
-1.3
-0.23
27.34
0.29
SIT4
2.6
-1.68
-0.81
0.25
35.19
0.08
SIT5
3.44
-1.16
-0.59
0.16
44.13
0.00
Note. The initials in parenthesis after each ‘Item’ are the short form for the survey statement.
The slope (Discrimination) parameters vary across the items, indicating that each item has varying effectiveness in differentiating respondents across different levels of latent STEM Interest trait. SIT1 has the highest slope (4.25), suggesting that it is the most effective item in distinguishing respondents with varying levels of agreeableness on the latent STEM Interest trait. The Item Goodness of Fit index indicates that SIT5 has a significant lack of fit (S-χ² < 0.05), suggesting that the model may not adequately describe the response patterns for these items.
The Test Information Curve for the 5-item STEM Interest scale depicts the entire scale's information about the latent trait (STEM Interest) at different agreeability (Theta) levels ranging from -2.8 to 2.8.
The Test Information Curve peaks at highest at Theta scores around -1.5 and 0, indicating that the STEM Interest survey is most informative for respondents with below average to average STEM Interest Theta scores. The standard errors decrease as the Test Information Curve increases, suggesting that the precision of the Theta score estimates improves as the scale provides more information.
STEM Interest Scale Key Takeaways
ST1 ('I like learning about STEM') reported the highest slope and is the most effective in distinguishing respondents with different agreeability levels on the latent STEM Interest trait.
Items SIT4 and SIT5 show poor fit and should be reviewed and revised to improve their performance to better discriminate respondents with Theta levels between 0 and 3, thus improving the functioning of the scale to measure respondents across the full range of the latent STEM Interest trait.
STEM Performance Scale GRM Results
Table 13 shows the distribution responses on the STEM Performance scale across the four response categories (Disagree a lot, Disagree a little, Agree a little, Agree a lot). Response percentages vary across the items, with the highest percentage of responses in the "Agree a lot" category for all items.
Table 13. Response Percentages for STEM Performance scale (N = 648)
-
STEM Performance Scale Item
Disagree a lot (0)
Disagree a little (1)
Agree a little (2)
Agree a lot (3)
I am a good team member when I work in a group on a STEM project (SP1)
2.6
4.9
36.9
55.6
I can finish a project by its due date (SP2)
3.1
8.8
28.7
59.4
When a project does not work out, I can think of other ways to do it (SP3)
3.5
7.7
40.9
47.8
I can be the leader of a team working on a project (SP4)
7.7
10.6
28.7
52.9
Note. The initials in parenthesis after each ‘Item’ are the short form for the survey statement
Table 14 reports the transformation of raw scores to Theta scores in a graded response model analysis for the STEM Performance scale. The Theta score, interpreted as agreeableness on the STEM Performance scale, is given in logit units. The higher the Theta (or logit scores), the higher the agreeableness on the STEM Performance trait. The table displays the Theta score and standard error (SE) for each possible raw score, ranging from 0 to 12.
Table 14. STEM Performance Total Raw Score to Theta Score Conversion
-
Raw score
Theta
SE
0
-2.79
0.53
1
-2.42
0.48
2
-2.14
0.46
3
-1.88
0.46
4
-1.62
0.45
5
-1.37
0.45
6
-1.12
0.46
7
-0.87
0.46
8
-0.61
0.46
9
-0.32
0.47
10
0.01
0.48
11
0.43
0.52
12
1.08
0.65
Table 15 shows the graded response model parameters for the four items (SP1, SP2, SP3, SP4) on the STEM Performance scale. The parameters include the slope (Discrimination), response category thresholds (Difficulty), and the Item Goodness of Fit index.
The slope parameter indicates the degree to which an item can distinguish between individuals with different levels of STEM Performance trait. For example, SP1 has a slope of 2.06, SP2 has a slope of 1.55, SP3 has a slope of 1.93, and SP4 has a slope of 2.43. Items with greater slopes are more effective at differentiating among respondents with varying ability levels than items with lower slope parameters.
The response category thresholds show the difficulty of endorsing each response option. These categories represent the cut-off points that separate response categories for a specific item. A test-taker with a certain ability level would be more likely to choose a response in a particular category if their ability exceeds the threshold for that category. More specifically, the reported threshold value indicates the logit score that an individual has a 50% chance of endorsing the higher category compared to the lower category. For example, the threshold for the first response category (Category 1) on SP1 is -2.64, meaning that an individual with a -2.64 logit score has a 50% chance of endorsing response options at or above Disagree a little compared to endorsing the lowest response option Disagree a lot. These thresholds yield a 50% chance of endorsing the higher response option(s) versus the lower response option(s) for each item of the STEM Performance scale. The Item Goodness of Fit index includes the S-χ² (S-chi-square) and P-values. A high S-χ² value and a low P-value indicate that the item does not fit the GRM model assumptions well. For example, SP2 has the poorest fit with a S-χ² value of 37.54 and a P-value of .03, while SP1, SP3, and SP4 show better fit with S-χ² values of 15.67, 20.95, and 11.81, respectively, and higher P-values.
Table 15. STEM Performance Scale Slope (Discrimination) Parameters, Response Category Thresholds (Difficulty) Parameters and Item Goodness of Fit Index
-
Item
Slope
Response Category Thresholds
Item Goodness of Fit
Category 1
Category 2
Category 3
S-χ²
P
SP1
2.06
-2.64
-1.89
-0.17
15.67
.62
SP2
1.55
-2.91
-1.72
-0.33
37.54
.03
SP3
1.93
-2.5
-1.6
0.08
20.95
.40
SP4
2.43
-1.75
-1.07
-0.07
11.81
.86
The item information curve and the category response curves illustrate the amount of information each item provides in estimating STEM Performance across different agreeability levels (Theta) and the response distribution across the four response options. SP1 provides most information between Theta -2.5 and 0.5. Most individuals between Theta -2 and 0 endorsed the Agree a little response option (green normal curve shape) for SP1.
The total information curve for the STEM Performance Scale illustrates the information generated across the four STEM Performance items to estimate Theta scores. The Theta score(s) corresponding with the highest peak of the Total Information curve reveal the latent trait level where the survey items offer optimal information. Theta range for the combined four items on the STEM Performance scale is more precise at measuring STEM Performance among individuals with Theta levels ranging from -2.8 to 0.
STEM Performance Scale Key Takeaways
The Test Information Curve showed that the combined four items on the STEM Performance scale are more precise at measuring STEM Performance among individuals with Theta levels ranging from -2.8 to 0, that is, not at the higher levels. Item information function values vary across latent trait levels (Theta).
The higher slopes and better fit to the GRM model of SP1, SP3, and SP4 indicate they are effective in discriminating between the agreeableness levels of the STEM Performance scale and aligning with model assumptions. SP2 has the lowest slope (1.55) and poorest fit to the GRM model, suggesting it may not be effective in discriminating between individuals with different levels of the latent trait and may need further investigation or modification. Findings suggest the need to modify SP2 to better discriminate at the higher range of “agreeability” of STEM performance.
Content Validity
An expert review panel was convened on July 26, 2024, and provided recommendations on the K-12 STEM Inventory psychometric analysis. These recommendations are currently being synthesized and will be incorporated into the final iteration of the instrument.
Reliability – Internal Consistency
Internal consistency analysis was conducted for all three subscales of the STEM Inventory. The 3-item STEM Identity subscale reported a Cronbach’s alpha of .86, the 5-item STEM Interest subscale reported a reliability estimate of .89 and the 4-item STEM Performance construct reported a reliability estimate of .76.
Findings & Recommendations
Most STEM Inventory survey items effectively measure the underlying STEM traits. Several items require review to optimize the statistical information they provide to enhance the STEM Inventory scale:
The STEM Identity Scale is most informative for respondents with below average to average STEM Identity. Revise item SID1 and replace SID3 to offer more information on the upper end of the scale.
The STEM Interest Scale is most informative for respondents with below average to average STEM InterestST1 is the most effective item in differentiating respondents with varying levels of STEM Interest. Revise items SIT4 and SIT5, which showed poor fit.
The STEM Performance Scale is most precise for respondents with below average to average STEM Performance. Items SP1, SP3, and SP4 have high slopes and a good fit to the GRM model. Revise e SP2 to improve performance.
Additional recommendations for the K-12 STEM Inventory:
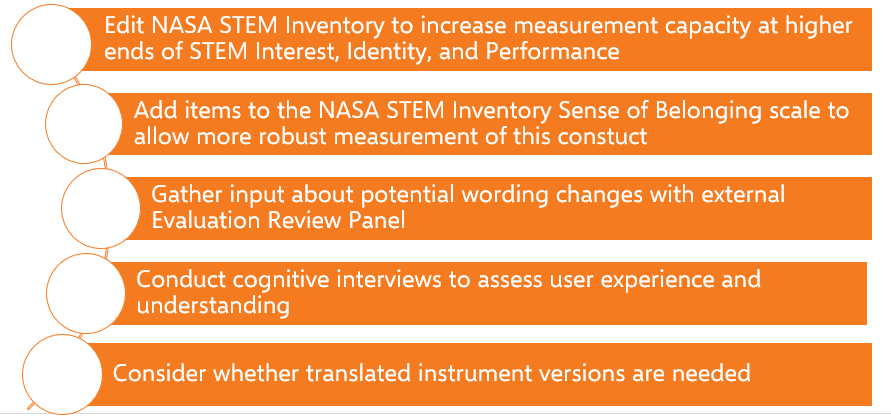
Figure 6. K-12 STEM Inventory Recommendations
Towards monitoring performance of its STEM Engagement activities, NASA Office of STEM Engagement will use rigorously developed and tested instruments administered and accessed through the approved survey management tools and/or NASA STEM Gateway system.2 Each data collection form type possesses unique challenges which can be related to respondent characteristics, survey content, or form of administration. In the absence of meticulous methods, such issues impede the effectiveness of instruments and would decrease the value of the data gathered through these instruments for both NASA Office of STEM Engagement and the Agency.
The central purpose of measurement is to provide a rational and consistent way to summarize the responses people make to express achievement, attitudes, or opinions through instruments such as achievement tests or questionnaires (Wilson, 2005, p. 5). In this particular instance, our interest lies in attitude and behavior scales, surveys, and psychological scales related to the goals of NASA STEM engagement activities. Yet, since NASA Education captures participant administrative data from activity application forms and program managers submit administrative data, P&E Team extends the definition of instruments to include electronic data collection screens, project activity survey instruments, and program application forms, as well.3 Research-based, quality control methods and techniques are integral to obtaining accurate and robust data, data of high quality to assist leaders in policy decisions.
The following research techniques and methods may be used in these studies:
Usability testing: Pertinent are the aspects of the web user interface (UI) that impact the User’s experience and the accuracy and reliability of the information Users submit (Kota, n.d.; Jääskeläinen, 2010).
2 The NASA STEM Gateway (Universal Registration and Data Management System) is a comprehensive tool designed to allow learners (i.e., students, educators, and awardee principal investigators) to register for and apply to NASA STEM engagement opportunities (e.g., internships, fellowships, challenges, educator professional development, experiential learning activities, etc.) in a single location. This web-based application enables the NASA Office of STEM Engagement to manage its participant application and data collection and reporting capabilities agency-wide. Major goals achieved through the system include 1) an enterprise solution to Registration, Application, and Data Management reducing the burden, cost and time of STEM Engagement community; 2) a structure for linking applicant information with participant information; 3) elimination of duplication and reduction in burden of student profile data (i.e., demographics and geographic distribution); 4) improvement in the overall data quality, integrity and analysis/reporting capabilities; and 5) providing a means to monitor project performance data for the purposes of determining and assessing the outputs and outcomes of STEM Engagement Investments.
3 If constituted as a form and once approved by OMB, forms will be submitted to NASA Forms Management according to NASA Policy Directive (NPD) 1420. Thus, forms used under this clearance, will have both an OMB control number and an NPD 1420 control number that also restricts access to NASA internal users only. Instruments not constituted as forms will display an OMB control number only.
Think-aloud protocols: This data elicitation method is also called ‘concurrent verbalization’, meaning subjects are asked to perform a task and to verbalize whatever comes to mind during task performance. The written transcripts of the verbalizations are referred to as think-aloud protocols (TAPs) (Jääskeläinen, 2010, p 371) and constitute the data on the cognitive processes involved in a task (Ericsson & Simon, 1984/1993).
Focus group discussion: With groups of nine or less per instrument, this qualitative approach to data collection comprises the basis for brainstorming to creatively solve remaining problems identified after early usability testing of data collection screen and program application form instruments (Colton & Covert (2007), p. 37).
Comprehensibility testing: Comprehensibility testing of program activity survey instrumentation will determine if items and instructions make sense, are ambiguous, and are understandable by those who will complete them (Colton & Covert, 2007, p. 129).
Pilot testing: Testing with a random sample of at least 200 respondents to yield preliminary validity and reliability data (Haladyna, 2004; Komrey and Bacon, 1992; Reckase, 2000; Wilson, 2005).
Large-scale statistical testing: Instrument testing conducted with a statistically representative sample of responses from a population of interest. In the case of developing scales, large-scale statistical testing provides sufficient data points for exploratory factor analysis, a “large-sample” procedure (Costello & Osborne, 2005, p. 5).
Item response approach to constructing measures: Foundations for multiple-choice testing that address the importance of item development for validity purposes, address item content to align with cognitive processes of instrument respondents, and that acknowledge guidelines for proper instrument development will be utilized in a systematic and rigorous process (DeMars, 2010).
Split-half method: This method is an efficient solution to parallel-forms or test/retest methods because it does not require developing alternate forms of a survey and it reduces burden on respondents, requiring only participation via a single test rather than completing two tests to acquire sufficient data for reliability coefficients.
The P&E Team’s goal and purpose for data collection through methodological testing is to provide support that improves education policy and decision-making, provides better STEM Engagement services, increases accountability, and ensures more effective administration within OSTEM. More in depth descriptions of techniques and methods can be found in Appendix D.
Indicate how, by whom, and for what purpose the information is to be used.
Except for a new collection, indicate the actual use the agency has made of the information received from the current collection.
The purpose of this data collection by the P&E Team is to ultimately improve our Federal data collection processes through scientific research. Theories and methods of cognitive science, in combination with qualitative and statistical analyses, provide essential tools for the development of effective, valid, and reliable data collection instrumentation.
The P&E Team’s methodological testing is expected to 1) improve the data collection instruments employed by OSTEM, 2) increase the accuracy of the data produced by execution of OSTEM project activities upon which policy decisions are based, 3) increase the ease of administering data collection instruments for both respondents and those responsible for administering or providing access to respondents, 4) increase response rates as a result of reduced respondent burden, 5) increase the ease of use of the data collection screens within the STEM Gateway system, and 6) enhance OSTEM’s confidence in and respect for the data collection instrumentation utilized by the OSTEM community.
The application of cognitive science, psychological theories, and statistical methods to data collection is widespread and well established. Neglecting accepted research practices and relying on trial and error negatively impact data quality and unfairly burden respondents and administrators of data collection instruments. For example, without knowledge of what respondents can be expected to remember about a past activity and how to ask questions that effectively aid in the retrieval of the appropriate information, researchers cannot ensure that respondents will not take shortcuts to avoid careful thought in answering the questions, or be subject to undue burden. Similarly, without investigating potential respondents’ roles and abilities in navigating electronic data collection screens, researchers cannot ensure that respondents will read questions correctly with ease and fluency, navigate electronic data screens properly or efficiently, or record requested information correctly and consistently. Hence, consequences of failing to scientifically investigate the data collection process should and can be avoided.
In light of the Administration’s call for increased sharing of federal STEM education resources through interagency collaborations, OSTEM may make available results of methodological testing to other federal STEM agencies in the form of peer-reviewed methods reports or white papers describing best practices and lessons learned. For instance, from inception NASA has supported the Federal Coordination in STEM (FC-STEM) Graduate and Undergraduate STEM Education interagency working groups’ efforts determine cross-agency, common metrics and share effective program evaluations. Coordination Objective 2: Build and use evidence based approaches calls for agencies to:
Conduct rigorous STEM education research and evaluation to build evidence about promising practices and program effectiveness, use across agencies, and share with the public to improve the impact of the Federal STEM education investment. (National Science and Technology Council, 2013, p. 45)
The methods to be employed in developing and testing data collection instruments will be methodologically sound, rigorously obtained, and will thus constitute evidence worthy of dissemination through appropriate vehicles. Data collection instruments appropriate for a participant in a postsecondary OSTEM research experience and are specific to the category of participant: undergraduate student, graduate student, mentor participant. One survey instrument explores a participant’s preparation for a research experience while its complement explores a participant’s attitudes and behaviors pre- and post-experience (undergraduate or graduate student) (Crede & Borrego, 2013.) Two non-cognitive competency scales explore a participant’s developmental levels of affect (grit and mathematics self-identity & self-efficacy) as related to participation in a NASA Education research experience (Duckworth, Peterson, Matthews, & Kelly, 2007; National Center for Education Statistics, 2009.) Lastly, the mentor survey explores a mentor’s attitudes and behaviors associated with participation as a mentor of an OSTEMresearch experience (Crede & Borrego, 2013.) Additional information collections will be submitted separately under this clearance with justification information and evidence-based methodology for methodological testing. Appendix G shows the explanatory content that will accompany each information collection for methodological testing purposes.
Describe whether, and to what extent, the collection of information involves the use of automated, electronic, mechanical, or other technological collection techniques or other forms of information technology, e.g. permitting electronic submission of responses, and the basis for the decision for adopting this means of collection.
Also describe any consideration of using information technology to reduce burden.
The P&E Team in collaboration with the Educational Platform and Tools Team will plan, conduct, and interpret field and laboratory research that contributes to the design of electronic data collection screens, project activity survey instruments, and program application forms used within the context of the OSTEM community.. These efforts are supported in two ways, by use of information technology applications and strategic efforts to improve the overall information technology data collection systems used by OSTEM.
Use of Information Technology (IT) Application
IT applications will be used to bridge the distance between the P&E Team of researchers mostly based at NASA Glenn Research Center in Cleveland, OH, and the Educational Platform and Tools Team at NASA Headquarters in Washington, DC. Multiple modes of technology may be used to bring the laboratory environment to study participants at various Center locales. In addition, data management and analyses applications have been made available to study leads to optimize data collection and analyses.
Different laboratory methods may be used in different studies depending on the aspects of the data collection process being studied. Computer technology will be used when appropriate to aid the respondents and interviewers, and to minimize burden. For instance, the P&E Team and/or contractor support may use Adobe Connect, Microsoft TEAMS, or Webex to conduct focus groups and cognitive interviews if indeed there is inadequate representation of participant populations at area NASA research centers.4,5 All of these platforms are used throughout the NASA research centers and have the potential to facilitate instrument development by providing access to appropriate study participants. The P&E Team has direct access and is also training in using other IT applications to facilitate this work as described below.
Adobe Connect: Adobe Systems Incorporated describes Adobe Connect as “a web conferencing platform for web meetings, eLearning, and webinars [that] powers mission critical web conferencing solutions end-to-end, on virtually any device, and enables organizations […] to fundamentally improve productivity.”
SurveyMonkey: This application may be used to collect non-sensitive, non-confidential qualitative responses to determine preliminary validity. This online survey software provides an electronic environment for distributing survey questionnaires.6 For the purpose of NASA Office of STEM Engagement, SurveyMonkey is a means by which feedback can be collected from a variety of participants such as from subject matter experts when in the early stages of instrument development when operationalizing a construct is vital to the process of instrument development.
4 More information on Adobe applications is available at http://www.adobe.com/products/adobeconnect.html
5 More information on WebEx applications is available at https://www.webex.com/video-conferencing
6 More information on SurveyMonkey can be found at https://www.surveymonkey.com/mp/take-a- tour/?ut_source=header.
A process referred to as operationalization is another tangible means to measure a construct since a construct cannot be observed directly (Colton & Covert, 2007, p. 66). The qualitative feedback of subject matter experts, in addition to the research literature, provides the factors or variables associated with constructs of interest. SurveyMonkey will facilitate the gathering of such information and interface with NVivo 10 for Windows qualitative software for analyses and consensus towards developing valid items and instruments.
SurveyMonkey: This application may be used to collect non-sensitive, non-confidential qualitative responses to determine preliminary validity. This online survey software provides an electronic environment for distributing survey questionnaires.6 For the purpose of NASA Education, SurveyMonkey is a means by which feedback can be collected from a variety of participants such as from subject matter experts when in the early stages of instrument development when operationalizing a construct is vital to the process of instrument development. A process referred to as operationalization is another tangible means to measure a construct since a construct cannot be observed directly (Colton & Covert, 2007, p. 66). The qualitative feedback of subject matter experts, in addition to the research literature, provides the factors or variables associated with constructs of interest. SurveyMonkey will facilitate the gathering of such information and interface with NVivo 10 for Windows qualitative software for analyses and consensus towards developing valid items and instruments.
NASA Google G-Suite (Google Form): This application may be used to collect non-sensitive, non-confidential qualitative responses to determine preliminary validity. This online survey application provides an electronic environment for distributing survey questionnaires. For the purpose of NASA Education, Google Form is a means by which feedback can be collected from a variety of participants such as from subject matter experts when in the early stages of instrument development when operationalizing a construct is vital to the process of instrument development. The NASA Google G-Suite also provides a file storage and synchronization service that allows users to store files on their servers, synchronize files across devices, and share files with NASA/non-NASA credentialed.
NVivo 10 for Windows: This software is a platform for analyzing multiple forms of unstructured data. The software provides powerful search, query, and visualization tools. A few features pertinent to instrument development include pattern based auto-coding to code large volumes of text quickly, functionality to create and code transcripts from imported audio files, and convenience of importing survey responses directly from SurveyMonkey. 7
7 More information is available at http://www.qsrinternational.com/products_nvivo.aspx
STATA SE v14: This data analysis and statistical software features advanced statistical functionality with programming that accommodates analysis, testing, and modeling from large data sets with the following characteristics: Maximum number of variables-32,767; Maximum number of right-hand variables- 10,998; and unlimited observations. These software technical specifications allow for the statistical calculations to determine and monitor over time item functioning and psychometric properties of NASA Office of Education data collection instrumentation. 8
Strategic Planning and Designing Improved Information Technology Data Collection Systems
The P&E Team has invested much time and effort in developing secure information technology applications that will be leveraged on behalf of instrument piloting and for the purposes of routine deployment that will enable large-scale statistical testing of data collection instruments. New information technology applications, the Composite Survey Builder and Survey Launcher, are in development with the new NASA STEM Gateway System. The Survey Launcher application will allow the P&E Team to reach several hundred OSTEM project activity participants via email whereas the Composite Survey Builder will allow the P&E Team to administer data collection instruments approved by the Office of Management and Budget (OMB) Office of Information and Regulatory Affairs via emailed web survey links. This same technology will be leveraged to maximize response rates for piloting and routine data collection instrument deployment.
Most recently, OSTEM has acquired a full-time SME specifically tasked with strategizing approaches to enhance the Office’s IT systems and applications to be more responsive to Federal mandates as well as to the needs of the OSTEM community. This person’s work is intended to lay the foundation for fiscally responsible IT development now and in the future.
Recall, participants in focus groups and cognitive interviews must mirror in as many characteristics as possible the sample of participants upon which the instrument will eventually be tested and then administered. Using technology to employ qualitative and quantitative methods is a means to establish validity from the onset prior to field testing and quantitative measures to determine instrument reliability and validity while monitoring and minimizing burden on study participants. Having the proper IT foundations in place for this work is a NASA OSTEM priority.
8 More information is available at http://www.stata.com/products/which-stata-is-right-for-me/#SE
Describe efforts to identify duplication.
Show specifically why any similar, already available, information cannot be used or modified.
Note: If you are aware that information is collected elsewhere by NASA (e.g., SSN) then the response should include a description of why it would be necessary to collect it from a respondent again. If another Federal agency collects similar or same information available to NASA, then explain how NASA will use their information.
Note: If the information being collected is unique to NASA, then an appropriate response might be “There is no duplication as there are no other sources available to collect this information.”
Because developing new valid and reliable data collection instrumentation is still a relatively new procedure for NASA OSTEM, many participants within our community have yet to participate in this kind of procedure. Participation in instrument development or testing is not mandatory.
Further, to reduce burden, any participant within our community recruited to participate in instrument development will only be solicited to contribute effort towards a single instrument, unless he or she volunteers for other opportunities. The P&E Team will attempt to reduce some of the testing burden by identifying appropriate valid and reliable instruments/scales through Federal resources or the educational measurement research literature.
If the collection of information impacts small businesses or other small entities, describe the methods used to minimize burden.
If the collection does not have a significant impact on small business, you may state something to the effect that “Collection of this information does not have a significant impact on small businesses.”
Not applicable. NASA OSTEM does not collect information from any small business or other small entities.
Describe the consequence to federal program or policy activities if the collection is not conducted or is conducted less frequently, as well as any technical or legal obstacles to reducing burden.
This planned collection of data will allow the P&E Team the opportunity to design appropriate valid and reliable data collection instrumentation, and the prerogative to modify and alter instruments in an on-going manner in response to changes in respondent demographics and the NASA OSTEM portfolio of activities. Because this collection is expected to be an on-going effort, it has the potential to have immediate impact on all data collection instrumentation within OSTEM. Any delay would sacrifice potential gains in development of and modification to data collection instrumentation as a whole.
Explain any special circumstances that would cause an information collection to be conducted in an exceptional manner:
Exceptions/special circumstances must be explained if the collection of information is not conducted in a manner consistent with the guidelines for PRA in 5 CFR 1320.6.
Common examples of a collection conducted in an exceptional manner include requiring respondents to:
Report information to the agency more often than quarterly
Prepare a written response to a collection of information in fewer than 30 days after receipt of it
Submit more than an original and two copies of any document
Retain records, other than health, medical, government contract, grant-in-aid, or tax records for more than 3 years in connection with a statistical survey that is not designed to produce valid and reliable results that can be generalized to the universe of study
Use a statistical data classification that has not be reviewed and approved by OMB
Swear a pledge of confidentiality that is not supported by authority established in statue or regulation, that is not supported by disclosure and date security policies that are consistent with the pledge, or which unnecessarily impedes sharing of data with other agencies for compatible confidential use
Submit proprietary trade secret(s) or other confidential information unless the agency can demonstrate that it has instituted procedures to protect the information’s confidentiality to the extent permitted by law
Not applicable. This data collection does not require any one of the reporting requirements listed.
Provide the date and page number of publication in the Federal Register for the 60-day and 30-day FNRs, soliciting comments on the information collection prior to submission to OMB.
60-day FRN: 89 FR 45028 on 5/22/2024. Comments were not received.
30-day FRN: 89 FR 68211 on 8/23/2024.
Explain any decision to provide any payment or gift to respondents, other than remuneration of contractors or grantees.
Not applicable. NASA OSTEM does not offer payment or gifts to respondents.
Describe any assurance of confidentiality provided to respondents and the basis for the assurance in statute, regulation, or agency policy.
Note: The information collection sponsor must confer with their Privacy Manager/Officer regarding the proposed information collection instrument/form/survey, etc. If NASA has unique confidentiality policies or other privacy policies apply, they should be cited and discussed in terms of what protections will be provided to respondents.
OSTEM is committed to protecting the confidentiality of all individual respondents that participant in data collection instrumentation testing. Any information collected under the purview of this clearance will be maintained in accordance with the Privacy Act of 1974, the e- Government act of 2002, the Federal Records Act, and as applicable, the Freedom of Information Act in order to protect respondents’ privacy and the confidentiality of the data collected (See Appendix E.)
The data collected from respondents will be tabulated and analyzed only for the purpose of evaluating the research in question. Laboratory respondents will be asked to read and sign a Consent form, a personal copy of which they are provided to retain. The Consent form explains the voluntary nature of the studies and the use of the information, describes the parameters of the interview (taped or observed), and provides assurance of confidentiality as described in NASA Procedural Requirements (NPR) 7100.1.9
The consent form administered will be edited as appropriate to reflect the specific testing situation for which the participant is being recruited (See Appendix C). The confidentiality statement, edited per data collection source, will be posted on all data collection screens and instruments, and will be provided to participants in methodological testing activities per NPR 7100.1 (See Appendix E.)
9 The entire NPR 7100.1 Protection of Human Research Subjects (Revalidated 6/26/14) may be found at: http://nodis3.gsfc.nasa.gov/displayDir.cfm?Internal_ID=N_PR_7100_0001_&page_name=main
Provide additional justification for any questions of a sensitive nature, such as sexual behavior and attitudes, religious beliefs, and other matters that are commonly considered private.
This justification should include the reasons why the agency considers the questions necessary, the specific uses to be made of the information, the explanation to be given to persons from whom the information is requested, and any steps to be taken to obtain their consent.
Note: It is not impossible to obtain OMB approval to collect this type of information, but the reason why is needed and how it will be used must be very sound. For information collections involving questions of race/ethnicity, the agency should ensure that the OMB classifications and two-question format found on page 20 of the 1997 “Revisions to the Standards for the Classification of Federal Data on Race and Ethnicity” are reviewed and applied as applicable. Furthermore, reflecting back to the response provided in question 4, an explanation of why the agency cannot obtain the desired information from another source should be included.
Note: If this question does not apply, a possible response would be “Questions of a sensitive nature are not found in this information collection.”
Assuring that students participating in OSTEM projects are representative of the diversity of the Nation requires OSTEM to capture the race, ethnicity, and disability statuses of its participants. Therefore, to assure the reliability and validity of its data collection instruments, the P&E Team will need to ascertain that study participants are representative of students participating in NASA STEM Engagement projects. Race and ethnicity information is collected according to Office of Management and Budget (1997) guidelines in “Revisions to the Standards for the Classification of Federal Data on Race and Ethnicity.”10 Although disclosure of race and ethnicity are not required to be considered for opportunities at NASA, respondents are strongly encouraged to submit this information. The explanation given to respondents for acquiring this information is as follows:
In order to determine the degree to which members of each ethnic and racial group are reached by this internship/fellowship program, NASA requests that the student select the appropriate responses below. While providing this information is optional, you must select decline to answer if you do not want to provide it. Mentors will not be able to view this information when considering students for opportunities. For more information, please visit http://www.nasa.gov/about/highlights/HP_Privacy.html.
Information regarding disabilities is collected according to guidelines reflected in the “Self- Identification of Disability” form SF-256 published by the Office of Personnel Management (Revised July 2010) and is preceded by the following statement:
An individual with a disability: A person who (1) has a physical impairment or mental impairment (psychiatric disability) that substantially limits one or more of such person's major life activities;
(2) has a record of such impairment; or (3) is regarded as having such an impairment. This definition is provided by the Rehabilitation Act of 1973, as amended (29 U.S.C 701 et. seq.)11
Regulations safeguarding this information is provided to study participants on the informed consent form as governed by NPR 7100.1.
10 http://www.whitehouse.gov/omb/fedreg_1997standards
11 http://www.opm.gov/forms/pdf_fill/sf256.pdf
Provide estimates of the hour burden of the collection of information.
Indicate the number of respondents, frequency of response, annual hour burden, and an
explanation of how the burden was estimated. If the hour burden on respondents is expected to vary widely because of differences in activity, size, or complexity, show the range of estimated hour burden, and explain the reasons for the variance.
The estimate of respondent burden for methodological testing is as follows (See Table 1):
Table 1: Estimate of Respondent Burden for Methodological Testing
Data Collection Sources |
Respondent Category |
Statistically Adjusted Respondents |
Frequency of Response |
Total minutes per Response |
Total Response Burden in Hours |
Public |
Students (15 and younger) |
10,000 |
1 |
15 |
2,500 hours |
Students (16 and older) |
10,000 |
1 |
15 |
2,500 hours
|
|
Educators and Parents |
8,000 |
1 |
15 |
2,000 hours
|
|
|
Total Burden for Methodological Testing |
28,000 |
|
|
7,000
|
Generally, estimates should not include burden hours for customary and usual business practices. If this request for approval covers more than one form, provide separate hour burden estimates for each form and aggregate the hour burdens in Item 13 of OMB Form 83-I.
Provide an estimate of the total annual cost burden to respondents or record keepers resulting from the collection of information.
Do not include the cost of any hour burden shown in Items 12 and 14.
The estimate of annualized cost to respondents for methodological testing is as follows (See Table 2). Annualized Cost to Respondents is calculated by multiplying Total Response Burden in Hours by Wage specific to Respondent Category (Bureau of Labor Statistics, 2014).
Table 2: Estimate of Annualized Cost to Number of Respondents Required for Methodological Testing
Data Collection Sources |
Respondent Category |
Total Response Burden in Hours |
Wage |
Annualized Cost to Respondents |
NASA STEM Gateway |
Students (15 years of age and younger) |
2,500 |
$5.36/hr |
$13,400 |
Students (16 years of age and older) |
2,500 |
$7.25/hr |
$18,125 |
|
Educators and/or Parents |
2,000
|
$25.09/hr
|
$50,180
|
|
|
Total Burden for Methodological Testing |
7,000 |
|
$81,705 |
Provide estimates of annualized costs to the Federal government.
Also, provide a description of the method used to estimate cost, which should include quantification of hours, operational expenses, and any other expense that would not have been incurred without this collection of information.
The total annualized cost estimate for this information collection is $0.7 million based on existing contract expenses that include contract staffing, staff training for data collection, data cleaning, validation, and management, and reporting relating to contract staffing for online systems including but not limited to the NASA STEM Gateway data collection suite.
Explain the reasons for any major program changes or adjustments to burden hours or annualized costs to respondents.
This is a renewal application for methodological testing of data collection instrumentation within OSTEM by the P&E Team. Adjustments to burden in Items 13 and 14 reflect new projected respondent population universe and minutes per response for testing in alignment with the OSTEM evaluation strategy including collection through the NASA STEM Gateway System and/or other survey management tools.
For collections of information whose results will be published, outline plans for tabulation and publication.
Address any complex analytical techniques that will be used. Provide the time schedule for the entire project, including beginning and ending dates of the collection of information, completion of report, publication dates, and other actions.
OSTEM may make available results of methodological testing to other federal STEM agencies in the form of peer-reviewed methods reports or white papers describing best practices and lessons learned on an as-appropriate basis determined by OSTEM leadership. Although there is no intent to publish in academic journals, standards for drafting will reflect peer-reviewed, publication-level standards of quality.
If seeking approval to not display the expiration date for OMB approval of the information collection, explain the reasons that display would be inappropriate.
NASA must display the expiration date within the required PRA Statement for all electronically collected collections and should display the expiration date on collections collected via paper submission as well. However, if you believe there would be exceptional burden to reprint paper collection devices with new expiration dates every three years, state this here along with a compelling argument as to why.
The OMB Expiration Date will be displayed on every data collection instrument, once approval is obtained.
Explain any exception to the below certification statement.
The NASA Sponsor to this information collection must address the certification below and enter their name and position title. The NASA Office of the Chief Information Officer must concur on any exceptions requested by the information collection sponsor, or the package will not be forwarded to OMB.
The proposed collection of information –
(a) is necessary for the proper performance of the functions of NASA, including that the information to be collected will have practical utility;
(b) is not unnecessarily duplicative of information that is reasonably accessible to the agency;
(c) reduces to the extent practicable and appropriate the burden on persons who shall provide information to or for the agency, including with respect to small entities, as defined in the Regulatory Flexibility Act (5 U.S.C. 601(6)), the use of such techniques as:
(1) establishing differing compliance or reporting requirements or timelines that take into account the resources available to those who are to respond;
(2) the clarification, consolidation, or simplification of compliance and reporting requirements; or
(3) an exemption from coverage of the collection of information, or any part thereof;
(d) is written using plain, coherent, and unambiguous terminology and is understandable to those who are targeted to respond;
(e) indicates for each recordkeeping requirement the length of time persons are required to maintain the records specified;
(f) has been developed by an office that has planned and allocated resources for the efficient and effective management and use of the information to be collected, including the processing of the information in a manner which shall enhance, where appropriate, the utility of the information to agencies and the public;
(g) when applicable, uses effective and efficient statistical survey methodology appropriate to the purpose for which the information is to be collected; and
(h) to the maximum extent practicable, uses appropriate information technology to reduce burden and improve data quality, agency efficiency and responsiveness to the public; and
(i) will display the required PRA statement with the active OMB control number, as validated on www.reginfo.gov
The NASA office conducting or sponsoring this information collection certifies compliance with all provisions listed above. Certifying individual must be a civil service employee.
Name: Richard L. Gilmore Jr.
Title: Performance Assessment and Evaluation Program Manager, NASA Office of STEM Engagement
Email address: richard.l.gilmore@nasa.gov
Date: 8/2/24
References
Andrich, D. (1978). A rating formulation for ordered response categories. Psycometrika, 43, 561-573. Bureau of Labor Statistics. (2014). Retrieved from http://www.bls.gov/home.htm.
Colton, D., & Covert, R. W. (2007). Designing and constructing instruments for social reserch and evaluation. San Francisco: John Wiley and Sons, Inc.
Costello, A. B., & Osborne, J. W. (2005). Best practices in exploratory factor analysis: Four recommendations for getting the most from your analysis. Practical Assessment, Research & Evaluation, 10(7), 1-9.
Crede, E., & Borrego, M. (2013). From ethnography to items: A mixed methods approach to developing a survey to examine graduate engineering student retention. Journal of Mixed Methods Research, 7(1), 62-80.
Davidshofer, K. R., & Murphy, C. O. (2005). Psychological testing: Principles and applications.
(6th ed.). Upper Saddle River, NJ: Pearson/Prentice Hall.
DeMars, C. (2010). Item response theory. New York: Oxford University Press.
Duckworth, A. L., Peterson, C., Matthews, M. D., & Kelly, D. R. (2007). Grit: Perserverance and passion for long-term goals. Journal of Personality and Social Psychology, 92(6), 1087- 1101.
Fabrigar, L. R., & Wegener, D. T. (2011). Exploratory factor analysis. New York, NY: Oxford University Press.
Haladyna, T. M. (2004). Developing and validating multiple-choice test items (3rd ed.).
Mahwah, NJ: Lawrence Erlbaum Associates, Inc.
Hu, L. T., & Bentler, P. M. (1999). Cutoff criteria for fit indices in covariance structure analysis: Conventional criteria versus new alternatives. Structural Equation Modeling: A
Multidisciplinary Journal, 6(1), 1-55.
Jaaskelainen, R. (2010). Think-aloud protocol. In Y. Gambier, & L. Van Doorslaer (Eds.),
Handbook of translation studies (pp. 371-373). Philadelphia, PA: John Benjamins.
Komrey, J. D., & Bacon, T. P. (1992). Item analysis of acheivement tests based on small numbers of examinees. Paper presented at the annual meeting of the American Educational Research Association. San Francisco.
Kota, K. (n.d.). Testing your web application: A quick 10-step guide. Retrieved from http://www.adminstrack.com/articles/testing_web_apps.pdf.
Linacre, J. M. (2002). Optimizing rating scale category effectiveness. Journal of Applied
Measurement, 3, 85-106.
Linacre, J. M. (2019). Winsteps ® (Version 4.4.0.6) [Computer Software]. Winsteps.com
Linacre, J. M. (1999). Category disordering (disordered categories) vs. threshold disordering
(disordered thresholds). Rasch Measurement Transactions, 13(1), p. 675.
National Center for Education Statistics, U. (2009). High School
Longitudinal Study of 2009, First Follow-up. OMB No: 1850-0852.
National Science and Technology Council. (2013). Federal science, technology, engineering, and mathematics (STEM) education 5 year strategic plan. Retrieved from http://www.whitehouse.gov/sites/default/files/microsites/ostp/stem_stratplan_2013.pdf.
Rasch, G. (1960/1980). Probabilistic models for some intelligence and attainment tests.
(Copenhagen, Danish Institute for Educational Research), with foreword and afterword by B.D. Wright. The University of Chicago Press.
Reckase, M. D. (2000). The minimum sample size needed to calibrate items using the three- parameter logistic model. Paper presented at the annual meeting of the American Educational Research Association. New Orleans.
Wilson, M. (2005). Constructing measures: An item response modeling approach. New York: Psychology Press.
APPENDIX A: NASA Office of STEM Engagement Goals
Section 203 (a) (3) of the Space Act, directs NASA “to provide for the widest practicable and appropriate dissemination of information concerning its activities and the results thereof, and to enhance public understanding of, and participation in, the Nation’s space program in accordance with the NASA Strategic Plan.” In support of this directive, NASA engages the public and students in its mission through a portfolio of STEM programs and activities. The 2022 NASA Strategic Plan reinforces the Agency’s commitment to inspiring an informed society; engaging the public in science, technology, discovery and exploration; and providing unique STEM opportunities for diverse stakeholders. NASA’s investments in these areas are guided by Strategic Goal 4: Advance, and Strategic Objective 4.3: Build the next generation of explorers (Engage students to build a diverse future STEM workforce). NASA’s support of U.S. industry and academia seeks to foster economic development and growth, embody American ingenuity, and serve as a magnet for the STEM workforce.
NASA is committed to defining and implementing a portfolio of STEM Engagement programs, projects, activities and products directed toward achieving the objectives and strategies above, driving a coherent and coordinated set of activities across the Agency. Ultimately, the work dedicated to this strategy will contribute to achieving NASA’s STEM Engagement vision to immerse students in NASA’s work, attract students to STEM, and inspire the next generation to explore.
Central to this effort is an architecture designed to enable relevant student contributions to NASA’s mission and work, driven by requirements from NASA’s Mission Directorates. This structure aligns appropriated STEM engagement programs, existing and emerging relevant projects, and activities and products from across the Agency, into an overarching framework and strategy. The result is an effective and coherent approach and outcomes, see Figure 1.
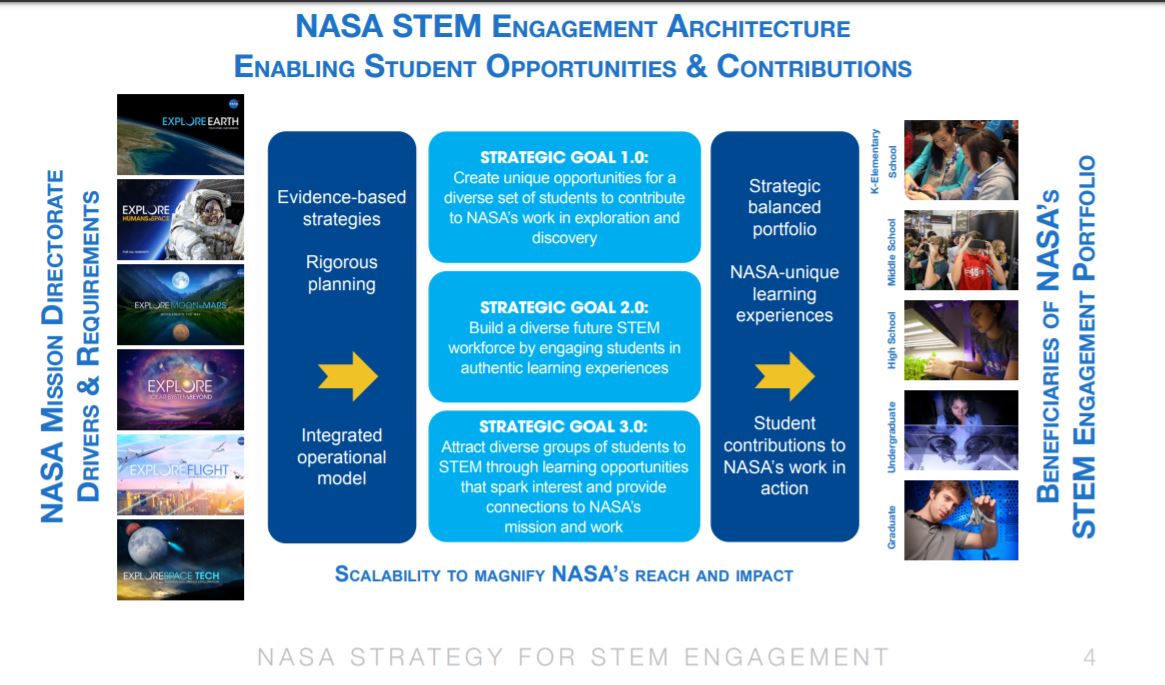
Figure 1. Office of STEM Engagement (OSTEM) architecture.
At the core of NASA’s efforts in STEM Engagement are the following goals, design principles and priority areas aligned to NASA’s 2022 Strategic Plan under Strategic Objective 4.3.
From Strategic Objective 4.3, the Agency’s goals for STEM engagement are:
Create unique opportunities for students from diverse backgrounds to contribute to NASA’s work in exploration and discovery.
2. Build a diverse future STEM workforce by engaging students in authentic learning
experiences with NASA’s people, content, and facilities.
3. Attract diverse groups of students to STEM through learning opportunities that spark
interest and provide connections to NASA’s mission and work.
Also under Strategic Objective 4.3, the planning and execution of the Agency’s STEM Engagement efforts are guided by the following five design principles:
Mission-driven authentic STEM experiences. Opportunities, activities, research
experiences, and/or products enable students to contribute to NASA’s endeavors in
exploration and discovery and address priorities critical to NASA’s mission.
Evidence-based practices – Activities are informed by research, literature reviews,
and/or evaluation to build evidence confirming program effectiveness and impact.
Diversity and inclusion – Strategies are used to attract and sustain diversity in student participation and to incorporate approaches to foster and promote inclusion.
Scalability through partnerships and metrics -- Attributes and characteristics providing opportunities to leverage partnerships and networks to magnify reach and impact are incorporated into activities.
Outcome driven -- To demonstrate success, outcomes and metrics are established and measured.
From the Agency’s Strategic Plan, Strategic Objective 4.3 and three goals outlined above, the STEM Engagement Council, led by the Office of STEM Engagement, in May 2024, adopted the NASA STEM Engagement Implementation Plan with the following four priority areas:
Advance diversity, equity, inclusion, accessibility, and belonging in opportunities to broaden participation in STEM.
Build and strengthen strategic partnerships and networks.
Create a beneficiary-focused organizational framework of opportunities and resources.
Facilitate evidence-driven, continuous improvement of NASA’s STEM engagement portfolio to ensure opportunities are responsive to evolving beneficiary needs.
NASA STEM Engagement executes a comprehensive Performance and Evaluation (P&E) Strategy, Annual Performance Plan (APP), Annual Evaluation Plan (AEP) and a Learning Agenda in alignment with federal legislation and P&E requirements. NASA continues to demonstrate and enhance the effectiveness of STEM engagement investments using these performance assessment and evaluation-driven processes to inform impacts and prioritization of investments and support budgetary, programmatic, and operational decision-making noted in individual project plans. Annually, a body of evidence (i.e., milestone accomplishments, performance and participation data, evaluation outcomes, and/or other metrics) is generated to assess progress of STEM engagement investments in achieving performance goals and success criteria and to assess outcomes.
APPENDIX B: NASA Center STEM Engagement Offices
Strategic management of the NASA STEM Engagement portfolio requires the participation of the Office of STEM Engagement (headquarters), the four Mission Directorates and all ten NASA Centers. This extensive participation provides STEM Engagement opportunities with NASA content, people and facilities. Close and effective consultation, coordination and cognizance among all entities are critical to the optimal fulfillment of NASA's objectives relative to its education investment.
OSTEM provides integration and evaluation support to the community. As such, the Educational Platform and Tools Team maintains a centralized database of all NASA OSTEM activities and investments, and supports coordination of evaluation and assessment of the Agency education portfolio. The Performance and Evaluation Team (P&E) works closely with the Office of the Chief Information Officer (OCIO) to develop Paperwork Reduction Act (PRA) guidance and training resources for Center STEM Engagement Offices. Upon improved compliance of the Center STEM Engagement Offices, all Centers will submit data collection instruments for development and clearance through the P&E Team first and then approval by the NASA OMB liaison prior to submission to OMB. This process will reduce burden on the STEM Engagement community while optimizing data collection.
Center STEM Engagement Offices are responsible for implementing NASA OSTEM programs, projects and activities for the Mission Directorates and OSTEM, as well as planning and implementing STEM Engagement projects that are unique to and funded by their Centers. Centers are responsible for execution of programs and projects and for institutional assets. The Center STEM Engagement Offices provide expertise in state standards and requirements in their area of geographic responsibility for K-12 education, and provide valuable field-based input into STEM Engagement program planning.
Locations of NASA Center STEM Engagement Offices

Ames specializes in research geared towards creating new knowledge and new technologies that span the spectrum of NASA interests.


Armstrong Flight Research Center
As the lead for flight research, Armstrong continues to innovate in aeronautics and space technology. The newest, fastest, the highest -- all have made their debut in the vast, clear desert skies over Armstrong.


Glenn Research Center develops and transfers critical technologies that address national priorities through research, technology development, and systems development for safe and reliable aeronautics, aerospace, and space applications.

 The
mission of the Goddard Space Flight Center is to expand knowledge on
the Earth and its environment, the solar system, and the universe
through observations from space.
The
mission of the Goddard Space Flight Center is to expand knowledge on
the Earth and its environment, the solar system, and the universe
through observations from space.
The Jet Propulsion Laboratory, managed by the California Institute of Technology is NASA's lead center for robotic exploration of the Solar System.

From the early Gemini, Apollo, and Sky Lab projects to today's Space Shuttle and International Space Station programs, Johnson Space Center continues to lead NASA's effort in Human Space Exploration.

Kennedy Space Center is America's Gateway to the Universe -- leading the world in preparing and launching missions around the Earth and beyond.


Langley continues to forge new frontiers in aviation and space research for aerospace, atmospheric sciences, and technology commercialization to improve the way the world lives.

Bringing people to space; bringing space to people. Marshall Space Flight Center is world leader in the access to space and use of space for research and development to benefit humanity.


Stennis is responsible for NASA's rocket propulsion testing and for partnering with industry to develop and implement remote sensing technology.
APPENDIX C: Data Instrument Collection Testing Participation Generic Consent Form12
In accordance with the Privacy Act of 1974, as amended (5 U.S.C. 552a), you are hereby notified that this study is sponsored by the National Aeronautics and Space Administration (NASA) Office of Education Performance Assessment and Evaluation Information Management (PAEIM) Team, under authority of the Government Performance and Results Modernization Act (GPRMA) of 2010 that requires quarterly performance assessment of Government programs for purposes of assessing agency performance and improvement. Your participation is important to the success of this study. The information we collect will help us improve the nature of NASA education project activities and the accuracy with which NASA Office of Education can report to the stakeholders about the project activities offered. The NASA PAEIM Team will use the information provided for statistical purposes related to data collection instrument development only and will hold the information in confidence to the full extent permitted by law. Information will be secured and removed from this server and location upon guidelines set out by the NASA Records Retention Schedule 1392, 68-69. Although the following efforts will be taken to ensure confidentiality, there remains a remote risk of personal data becoming identifiable. A non-identifying code number will be assigned to participants’ data records, which will be stored in accordance with federal regulatory procedures and accessible only to the investigator. Any use of individual data to illustrate specific assessment results will be labeled in a manner to preserve the participants’ anonymity. In no way does refusing participation in this instrument development study preclude you from eligibility for NASA education project activities now or in the future.
Introduction
This research seeks to support the mission of the NASA Office of STEM Engagement by asking you to take part in a (focus group/cognitive interview/ instrument development testing) pertaining to our interest in the ways in which NASA project activities impact outcomes for participants.13 The information we collect will help us to improve the nature of the project activity and the accuracy with which NASA Office of STEM Engagement can report to the community about the project activities it offers.
Purpose of the Study
Determine the degree to which this instrument accurately captures the ways participant outcomes are measured by this data collection instrument.
Description of Study Procedures
Participants will be asked to complete XXX.
There are no foreseeable risks to participants electing to participate in this study.
Estimation of Time Required
We estimate it will take you an average of [enter #] minutes to participate in this research (ranging from [enter #] minutes to [enter #] minutes).
12 Once approved by OMB, this form will be submitted to NASA Forms Management according to NASA Policy Directive (NPD) 1420. Thus, this form, and all others used under this clearance, will have both an OMB control number and an NPD 1420 control number that also restricts access to NASA internal users only.
13 This clearance package is to obtain permission to develop instruments to be used in testing that will be approved by OMB first for inclusion under this clearance prior to testing.
Securing Your Responses
Under no circumstances will the results of your surveys be shared with anyone without your explicit permission. The results of this research may be presented at meetings or in publications, however, your identity will not be disclosed. Presentations and manuscripts typically contain participants’ quotes, but participants are never identified by name. Your involvement in the development of this instrument is entirely voluntary and you have the right to discontinue participation at any time.
Contact Persons
If you have any additional questions concerning the research, this informed consent, or confidentiality of responses, please contact Richard L. Gilmore Jr., Evaluation Manager, at richard.l.gilmore@nasa.gov or call (216)433-5493.
~~~~~~~~~~~~~~~~~~~~~~~~~~~~~~~~~~~~~~~~~~~~~~~~~~~~~~~~~~~~~~~~~~~~~~~~
I have read and understand the contents of this study information and informed consent form and have been encouraged to ask questions. I have received answers to the questions I have asked. I give my consent to participate freely in this research. I have signed and retained a copy of the information and consent form for my records and future reference. I have signed and submitted this information and consent form for the researcher’s records.
Participant's signature Date
Participant's printed name
Researcher's signature
OMB Control Number: XXXX-XXXX Expiration Date: [enter expiration date]
HQ-Form-XXXX MM/YYYY PREVIOUS EDITIONS ARE OBSOLETE
APPENDIX D: Descriptions of Methodological Testing Techniques
Usability testing: Pertinent are the aspects of the web user interface (UI) that impact the User’s experience and the accuracy and reliability of the information Users submit. The ease with which Users navigate the data collection screens and the ease at which the User accesses the actions and functionality available during the data input process are equally important. User experience is also impacted by the look and feel of the web UI and the consistency of aesthetics from page to page, including font type, size, color scheme utilized and the ways in which screen real estate is used (Kota, n.d.). The foundation for Usability testing will be a think-aloud protocol analysis as described by Jääskeläinen (2010) that exposes distractions to accurate input of data whereas a short Likert Scale survey with qualitative questions will determine the extent of distraction and nature of the distractions that impede accurate data input.
Think-aloud protocols (commonly referred to as cognitive interviewing): This data elicitation method is also called ‘concurrent verbalization’, meaning subjects are asked to perform a task and to verbalize whatever comes to mind during task performance. The written transcripts of the verbalizations are referred to as think-aloud protocols (TAPs) (Jääskeläinen, 2010, p 371) and constitute the data on the cognitive processes involved in a task (Ericsson & Simon, 1984/1993). When elicited with proper care and instruction, think-aloud does not alter the course or structure of thought processes, except with a slight slowing down of the process. Although high cognitive load can hinder verbalization by occupying all available cognitive resources, that property is of no concern regarding the tasks under analysis that are restricted to information actively processed in working memory (Jääskeläinen, 2010, p. 371). For the purposes of NASA Education, think-aloud protocols will be especially useful towards the improvement of existing and developing of new data collection screens, which are different in purpose from online applications. Whereas an online application is an electronic collection of fields that one either scrolls through or submits, completed page by completed page, data collection screens represent hierarchical layers of interconnected information for which user training is required. Since user training is required for proper navigation, think-aloud protocols capture the user experience to incorporate it into a more user-friendly design and implementation of this kind of technology. Lastly, data from think-aloud protocols is used to ensure that user experiences are reliable and consistent towards collecting robust data.
Focus group interviews: With groups of nine or less per instrument, this qualitative approach to data collection is a matter of brainstorming to creatively solve remaining problems identified after early usability testing of data collection screen and program application form instruments (Colton & Covert, 2007, p. 37). Data from this type of research will include audiotapes obtained with participant consent, meeting minutes taken
by a subject matter expert in administration assistance, and reflective comments submitted by participants after conclusion of the focus group. Focus group interviews may be used to refine items that failed initial reliability testing for the purposes of retesting. Lastly, focus group interviews may be used with participants as a basis for a grounded theory approach to instrument development or for refining an already existing instrument to be appropriate to a specific audience.
Comprehensibility testing: Comprehensibility testing of program activity survey instrumentation will determine if items and instructions make sense, are ambiguous, and are understandable by those who will complete them. For example, comprehensibility testing will determine if items are complex, wordy, or incorporate discipline- or culturally-inappropriate language (Colton & Covert, 2007, p. 129).
Pilot testing: After program activity survey instruments have performed satisfactorily in readability and comprehensibility testing, the next phase is pilot testing with a sample of the target population that will yield statistically significant data, a random sample of at least 200 respondents (Komrey and Bacon, 1992; Reckase, 2000). The goal of pilot testing is to yield preliminary validity and reliability data to determine if items and the instrument are functioning properly (Haladyna, 2004; Wilson, 2005). Data gleaned from pilot testing will be used to fine-tune items and the instrument in preparation for more complex statistical analysis upon large-scale statistical testing.
Large-scale statistical testing: Instrument testing conducted with a statistically representative sample of responses from a population of interest. In the case of developing scales, large-scale statistical testing provides sufficient data points for exploratory factor analysis (EFA), a multivariate statistical method used to uncover the underlying structure of a relatively large set of variables and is commonly used when developing a scale, a collection of questions used to measure a particular research topic (Fabrigar & Wegener, 2011). EFA is a “large-sample” procedure where generalizable and/or replicable results is a desired outcome (Costello & Osborne, 2005, p.5). This technique is particularly relevant to examining relationships between participant traits and the desired outcomes of NASA Education project activities.
Item response approach to constructing measures: Foundations for testing that address the importance of item development for validity purposes, address item content to align with cognitive processes of instrument respondents, and that acknowledge guidelines for proper instrument development will be utilized in a systematic and rigorous process. Validity will be determined as arising from item development, from statistical study of item responses, and from exploring item response patterns via methods prescribed by Haladyna (2004) and Wilson (2005.)
Split-half method: This method for determining test reliability is an efficient solution to parallel-forms or test/retest methods. Split-half method does not require developing alternate forms of a survey and it places a reduced burden on respondents in comparison to other methods, requiring participation in a single test scenario rather than requiring retesting at a later date. This method involves administering a test to a group of individuals, dividing the test in half along odd and even item numbers, and then correlating scores on one half of the test with scores on the other half of the test (Davidshofer & Murphy, 2005).
APPENDIX E: Privacy Policies and Procedures
Information collected under the purview of this clearance will be maintained in accordance with the Privacy Act of 1974, the e-Government act of 2002, the Federal Records Act, NPR 7100.1, and as applicable, the Freedom of Information Act in order to protect respondents’ privacy and the confidentiality of the data collected.14
Data is maintained on secure NASA servers and protected in accordance with NASA regulations at 14 CFR 1212.605.
Approved security plans are in place for the Office of Education Performance Measurement (OEPM) system in accordance with the Federal Information Security Management Act of 2002 and Office of Management and Budget, Circular A-130, Management of Federal Information Resources.
Only authorized personnel requiring information in the official discharge of their duties are authorized access to records from workstations within the NASA Intranet or via a secure Virtual Private Network (VPN) connection that requires two-factor hardware token authentication.
NASA STEM Gateway resides in a certified NASA data center and has met strict requirements relating to application security, network security, and backup/recovery of the NASA Office of the Chief Information Officer’s security plan.
Data will be secured and removed from this server and location upon guidelines set out by the NRRS/1392, 68-69. Specific guidelines relevant to the STEM Gateway system include the following:
Project management records documenting basic information about projects and/or opportunities, including basic project descriptions, funding amounts and sources, project managers, and NASA Centers, will be destroyed when 10 years old or when no longer needed, whichever is longer.
Records of participants (in any format), maintained either as individual files identified by individual name or number, or in aggregated files of multiple participants identified by name or number, including but not limited to application forms, personal information supplied by the individuals, will be destroyed 5 years after the last activity with the file.
Survey responses and other feedback (in any format) from project participants and the general public concerning NASA educational programs, including interest area preferences, participant feedback, and reports of experiences in projects, will be destroyed when 10 years old or when no longer needed, whichever is longer.
14 http://www.nasa.gov/privacy/nasa_sorn_10EDUA.html
The following Confidentiality Statement and Paperwork Reduction Act (PRA) statement, edited per data collection source, will be posted on all data collection screens and instruments, and will be provided to participants in methodological testing activities per NPR 7100.1:
Privacy Act Statement: In accordance with the Privacy Act of 1974, as amended (5 U.S.C. 552a), you are hereby notified that this study is sponsored by the National Aeronautics and Space Administration (NASA) Office of Education, under authority of the Government Performance and Results Modernization Act (GPRMA) of 2010 that requires quarterly performance assessment of Government programs for purposes of assessing agency performance and improvement. Your participation is important to the success of this study. The information we collect will help us improve the nature of NASA education project activities and the accuracy with which NASA Office of Education can report to the stakeholders about the project activities offered.
Paperwork Reduction Act Statement: This information collection meets the requirements of 44 U.S.C. §3507, as amended by section 2 of the Paperwork Reduction Act of 1995. You do not need to answer these questions unless we display a valid Office of Management and Budget (OMB) control number. The OMB control number for this collection is 2700-0159 and expires 09/30/2024. Send comments to: richard.l.gilmore@nasa.gov.
APPENDIX F: Overview: NASA Office of STEM Engagement Data Collection Instrument Development Process

FROM OUTPUTS TO SCIENCE, TECHNOLOGY, ENGINEERING, AND MATHEMATICS (STEM) EDUCATION OUTCOMES MEASUREMENT: DATA COLLECTION INSTRUMENT DEVELOPMENT PROCESS
WORKING WITH THE PROJECT MANAGERS AND PROGRAM DIRECTORS
Develop a logic model
Information & training sessions to provide guidance
Facilitation of logic modeling upon request
Review and recommendations to ensure incorporation of evidence-based practice
Identify outputs and short-term outcomes from logic models for performance indicators
Identify outputs and outcomes across lines of business and projects aligned with CAP goals and FC-STEM investment priority areas
Convert outputs and outcomes into performance indicators and outcome measures, identifying required data elements and data collection methods
UNDERSTANDING THE IMPACT OF STEM EDUCATION PROJECT ACTIVITIES ON PARTICIPANTS
Develop survey instruments based on NASA STEM Engagement project performance indicators and outcome measures
Conduct a scholarly STEM education and measurement literature review (assures that the evidence base is rigorous and current)
Connect outcomes from literature review with identified outcome measures, given constraints of inputs and within the context of activities
Search the STEM education research and measurement literature for instrument candidates for adaptation (previous literature review augments this step)15
Create a draft instrument targeting a specific project activity to explore specific outcomes impacted by the quality of outputs (e.g., non-cognitive competencies associated with STEM degree attainment in the NASA Internships and Fellowships)16
15 Provides opportunity to add to the research literature while using an instrument already determined to be reliable and valid for a particular respondent population.
16 For example, reporting on STEM undergraduate attainment is much less meaningful without understanding what kinds of experiences contributed to degree attainment and the quality of their NASA experience.
Draft should be lengthy and exhaustive to allow editing down in the testing process
Draft should reflect many questions that ask the same question to allow editing down
Draft should demonstrate multiple items per construct as convergence is important
Obtain stakeholder feedback & edit instrument draft
Editing question type
Adding new constructs and items
Conduct cognitive interviews with a small number (less than 10) of appropriate respondents & edit accordingly17
Editing question language
Editing question type
DEVELOPING VALID AND RELIABLE DATA COLLECTION INSTRUMENTS
Conduct field test of an instrument draft
Provide draft to OMB to approve for testing under the NASA OSTEM methodological testing generic clearance (no official timeline associated with this informal process)
Small scale field testing18
Statistical analysis of responses
Remove items with low p-values
Large scale field testing
Determine population/universe size for respondent audience
Implement steps to enhance response rate
Remove items with low p-values
OBTAINING AND MAINTAINING OMB-APPROVED DATA COLLECTION INSTRUMENTS
Obtain clearance from OMB for tested data collection instruments
Update OMB-approved drafts according to results obtained from large scale field testing
Submit tested data collection instrument for review by OMB, in accordance with the terms of clearance set upon approval of the plan as stipulated in the generic clearance.19
17 Involves qualitative research skills and analysis using software NASA Ed has provided for this purpose.
18 Involves statistical analysis skills and analysis using software NASA Ed has procured.
19 PRA_Gen_ICRs_5-28-2010.pdf.
Accessed at https://www.whitehouse.gov/sites/default/files/omb/assets/inforeg/PRA_Gen_ICRs_5-28-2010.pdf
Reevaluate instrument function
Maintain first universe of collected responses as baseline data
On an annual basis, pool recently collected instrument responses with current data set and rerun statistical analyses
Take barely passing items back through process starting at III.f.
Integrate refreshed items into instrument and forward draft to OMB for approval under the NASA OE methodological testing generic clearance
Reevaluate alignment of data collection instruments
Maintain alignment with portfolio as updated
Maintain alignment with line of business logic model as updated
APPENDIX G: Explanatory Content for Information Collections for Testing Purposes
Information collection for the purposes of methodological testing will be prefaced by a version of the information categories, edited to be appropriate for that particular instrument and audience. Below are examples of information and a consent form describing the methods for testing that demonstrates the type of information and content that reflects the following (if applicable): 1.) Source of adaptation 2) Constructs of interest; 3) Bibliographic sources that support the particular adaption or instrument draft; 4) Instrument Introduction; 5) Purpose of the study; 6) Description of study procedures; 7) Estimate of time to complete the instrument; 8) Assurance of confidentiality; 9) Contact person’s information; 10) Privacy statement; and 11) Paperwork Reduction Act Statement with Office of Management and Budget Control Number.
NASA Intern Survey Methodological Testing
Introduction
This research seeks to support the mission of the NASA Office of STEM Engagement by asking you to take part in a instrument development testing pertaining to our interest in the ways in which the NASA Internship Program impacts outcomes for participants.20 The information we collect will help us improve the nature of the NASA Internship Program and the accuracy with which NASA Office of STEM Engagement can report on outcomes of the Internship Program.
Purpose of the Study
Test the survey for clarity and comprehensibility and determine the degree to which this instrument accurately captures the ways participant outcomes are measured by this data collection instrument.
Description of Study Procedures
NASA Intern Survey items will be placed into Survey Monkey online software, and a survey link will be distributed through email to 50 NASA Intern participants. Quantitative field tested will be conducted with an anticipated 30-50 NASA Intern participants. Rasch (1960/1980) modeling using the rating scale model (Andrich, 1978) for polytomous responses will be used for the psychometric analysis (described below). As such, this pilot sample size is minimally sufficient for providing approximately 99% confidence in measures within ±1 logit (Linacre, 1994).
Estimation of Time Required
We estimate it will take you an average of 20 minutes to complete the survey.
Securing Your Responses
Under no circumstances will the results of your surveys be shared with anyone without your explicit permission. The results of this research may be presented at meetings or in publications, however, your identity will not be disclosed. Presentations and manuscripts typically contain participants’ quotes, but participants are never identified by name. Your involvement in the development of this instrument is entirely voluntary and you have the right to discontinue participation at any time.
Contact Persons
If you have any additional questions concerning the research, this informed consent, or confidentiality of responses, please contact Richard L. Gilmore Jr., Evaluation Manager, at richard.l.gilmore@nasa.gov or call (216)433-5493.
~~~~~~~~~~~~~~~~~~~~~~~~~~~~~~~~~~~~~~~~~~~~~~~~~~~~~~~~~~~~~~~~~~~~~~~
I have read and understand the contents of this study information and informed consent form and have been encouraged to ask questions. I have received answers to the questions I have asked. I give my consent to participate freely in this research. I have signed and retained a copy of the information and consent form for my records and future reference. I have signed and submitted this information and consent form for the researcher’s records.
Participant's signature Date
Participant's printed name
Researcher's signature
Privacy
Act Notification:
The information you provide via this form is
protected from unauthorized disclosure in accordance with the
Privacy Act of 1974. It will be used by NASA for the specific
purpose of managing registrants, selecting applicants, implementing
and evaluating STEM engagement investments. Collection of the
information is authorized by the National Aeronautics and Space Act
of 1958 § 403(a)(b), 42 U.S.C. § 2473 (c)(1).
Provision of the requested information is strictly voluntary;
however, failure to provide the information may result in NASA's
inability to provide you with the information or STEM services you
desire. NASA may disclose information to NASA administrators
and managers, Office of Management and Budget officials, and members
of Congress for the purposes of accountability and tracking of
program and project efficiency and effectiveness. Elaboration
and conditions of information disclosure may be found under “Routine
Uses” of the full System of Records Notice at
https://www.govinfo.gov/content/pkg/PAI-2013-NASA/xml/PAI-2013-NASA.xml#10euda
and in Appendix B at
https://www.govinfo.gov/content/pkg/PAI-2013-NASA/xml/PAI-2013-NASA.xml#appb.
Paperwork
Reduction Act Statement:
This information collection meets the
requirements of 44 U.S.C. §3507, as amended by section 2 of the
Paperwork Reduction Act of 1995. You do not need to answer these
questions unless we display a valid Office of Management and Budget
(OMB) control number. The OMB control number for this collection is
2700-0159 and expires 09/30/2024.
| File Type | application/vnd.openxmlformats-officedocument.wordprocessingml.document |
| File Modified | 0000-00-00 |
| File Created | 0000-00-00 |
© 2026 OMB.report | Privacy Policy