Regulatory Impact Analysis
2725ria02.docx
Accidental Release Prevention Requirements: Risk Management Programs Under the Clean Air Act; Safer Communities by Chemical Accident Prevention (Final Rule)
Regulatory Impact Analysis
OMB: 2050-0226
*** E.O. 12866 Review – Draft – Do Not Cite, Quote, or Release During Review***
Clean Air Act Risk Management Program Regulations Final Rule RIA 20230920_EO 12866 Initiated
Regulatory Impact Analysis
Safer Communities by Chemical Accident Prevention
Final Rule
U.S. Environmental Protection Agency (EPA)
Office of Land and Emergency Management (OLEM)
Office of Emergency Management (OEM)
1200 Pennsylvania Avenue, NW (Mail Code 5104A)
Washington, D.C. 20460 USA
August 30, 2023
CHAPTER 1: Introduction and Background 15
1.1 History and Need for the Rule 15
1.2 Organization of the Analysis 20
CHAPTER 2: Final Rule Provisions 21
2.1 Summary of Provisions and Applicability to Private Sector Facilities 21
2.2 Applicability to Government-owned Facilities and Entities 25
2.3 Changes in the Final Rule RIA from the Proposed Rule RIA 25
CHAPTER 3: Universe of RMP Facilities and 26
3.1 Universe of RMP Facilities 26
3.2 Number and Costs of Baseline Accidents 34
CHAPTER 4: Costs of Final Rule Revisions 51
4.4 Prevention Program Provisions 53
4.7 Information Availability 63
CHAPTER 5: Total Estimated Costs of the Final Rule 66
5.3 Prevention Program Rule Provisions 68
5.6 Information Availability to the Public 74
5.7 Important Cost Uncertainties and Indirect Costs Associated with Prevention Program Provisions 75
CHAPTER 6: Total Benefits of the Final Rule 80
6.2 Benefit Categories Associated with Accident Prevention and Mitigation 87
6.3 Avoided Accident Impacts: Breakeven Analysis 93
CHAPTER 7: Regulatory Alternatives Considered 98
7.1 Lower-cost Regulatory Alternative 98
7.2 Higher Cost Regulatory Alternative 101
7.3 Summary of Regulatory Alternatives 103
CHAPTER 8: Small Entity Analysis 106
8.2 Estimating the Number of Small Entities 107
8.3 Economic Impact on Small Entities 110
CHAPTER 9: Communities with Environmental Justice Concerns 119
9.3 Results Characterizing Baseline Conditions 123
9.5 Climate Change Impacts 132
CHAPTER 10: Limitations and Conclusions 135
10.1 Limitations and Conclusions 135
CHAPTER 11: Analyses Required Under Applicable Statutes and Executive Orders 138
11.2 Unfunded Mandates Reform Act 138
11.5 Paperwork Reduction Act of 1995 142
11.6 National Technology Transfer and Advancement Act 143
11.7 Consultation and Coordination with Indian Tribal Governments 143
APPENDIX A: Cost Estimates of HF Alkylation Conversion 145
APPENDIX B: Property and Business Losses in the Petrochemical Sector 147
APPENDIX C: Small Entity Analysis Data Comparison 149
C.1 Proposed Rule Data Comparison 149
C.2 Final Rule Data Comparison 154
Acronyms
Acronym Definition
AFPM American Fuel & Petrochemical Manufacturers
API American Petroleum Institute
ASEC Annual Social and Economic Supplement
ASM Annual Survey of Manufacturers
AWWA American Water Works Association
BEA Bureau of Economic Analysis
BLS Bureau of Labor Statistics
CAA Clean Air Act
CBP County Business Patterns
CSAG Chemical Safety Advocacy Group
CSB U.S. Chemical Safety Board
DUNS Data universal numbering system
D.C. District of Columbia
E.O. Executive Order
EPA U.S. Environmental Protection Agency
EPCRA Emergency Planning and Community Right to Know Act
GDP Gross Domestic Product
FTE Full-time employee
HF Hydrofluoric acid
HHS U.S. Department of Health & Human Services
ICR Information Collection Request
ISD Inherently safer design
IST Inherently safer technology
IPAWS Integrated Public Alert and Warning System
LEPC Local Emergency Planning Committee
NAICS North American Industrial Classification System
NIPA National Income and Product Accounts
NPRM Notice of Proposed Rulemaking
NTTAA National Technology Transfer and Advancement Act
OCA Offsite Consequences Analysis
OEM Office of Emergency Management
OEWS Occupational Employment and Wage Statistics
OSWER Office of Solid Waste and Emergency Response
OLEM Office of Land and Emergency Management
OMB Office of Management and Budget
OSHA Occupational Safety & Health Administration
PHA Process Hazard Analysis
PSM Process Safety Management
RAGAGEP Recognized and Generally Accepted Good Engineering Practices
RFA Regulatory Flexibility Act
RFI Request for Information
RIA Regulatory Impact Analysis
RMP Risk Management Program
SBA Small Business Administration
SDS Safety Data Sheet
STAA Safer Technology and Alternatives Analysis
TRI Toxic Release Inventory
TQ Threshold quantity
U.S. United States
VSL Value of a statistical life
WTP Willingness to pay
Executive Summary
Introduction
To bolster resilience to the impacts of climate change and prioritize environmental justice through environmental policy and regulation in the United States, President Biden issued Executive Order (E.O.) 13990, Protecting Public Health and the Environment and Restoring Science to Tackle the Climate Crisis. The E.O. directs Federal agencies to review current regulations and take action to address these issues. To support these priorities, EPA reviewed and proposed revisions to the current Risk Management Program (RMP)1 regulation.
The purpose of the final Safer Communities by Chemical Accident Prevention (SCCAP) final rule is to make changes to the current RMP rule in order to improve safety at facilities that use and distribute hazardous chemicals. EPA believes that the RMP regulations have been effective in preventing and mitigating chemical accidents in the U.S. However, because major RMP accidents continue to occur, EPA in this final rule is taking further steps to help protect human health and the environment from chemical hazards. The final rule revisions, by giving special consideration to concerns about climate change and environmental justice and building on lessons learned from the current regulatory program, will further protect human health and the environment from chemical hazards through advancement of process safety. These revisions are informed by EPA’s review of the current RMP rule and data, information collected by EPA through oral testimonies from the summer 2021 listening sessions on June 16 and July 8, 2021, written public comments submitted in response to a request for comment published by EPA prior to the development of the proposed rule (86 FR 28828; May 28, 2021), as well as the proposal’s open written comment period and September 2022 public hearings.
The final rule revisions seek to improve chemical process safety, assist in planning, preparing for, and responding to RMP accidents, and improve public awareness of chemical hazards at regulated sources. To accomplish this, these final rule provisions include several changes to the accident prevention program requirements, enhancements to the emergency preparedness requirements, changes to increase public availability of chemical hazard information, and changes or clarifications to certain regulatory definitions or issues. Some final rule provisions target facilities in close proximity to certain other facilities and/or facilities that have had recent accidents and/or facilities using a certain hazardous process (HF alkylation).
Provisions Analyzed in this RIA
This Regulatory Impact Analysis (RIA) analyzes the following new requirements and revisions to current requirements.
Prevention Program
Safer Technology and Alternatives Analysis (STAA)— (Revisions apply to §68.3 and §68.67)
The current RMP rule does not require facilities to conduct a STAA. The final rule STAA requirement includes two parts: the initial evaluation to identify alternatives and a practicability assessment to determine the costs and assess the reasonableness of implementing technology alternatives. Under the final rule, all facilities with Program 3 processes in North American Industrial Classification System (NAICS) code 324 and 325 are required to conduct the initial evaluation. Of those facilities, facilities that have had an accident since their most recent Process Hazard Analysis (PHA) or are located within one mile of another facility with a process in NAICS code 324 or 325, also are required to conduct a practicability assessment.2 The final rule also requires that all facilities in NAICS 324 using hydrofluoric acid (HF) in an alkylation unit (approximately 45 facilities) conduct a practicability assessment to assess inherently safer alternatives to HF alkylation, regardless of accident history or proximity to another NAICS 324- or 325-regulated facility.
STAA Implementation— (Revisions apply to §68.3 and §68.67)
Under the final rule, all facilities required to conduct a STAA practicability assessment (i.e., Program 3 NAICS 324 and 325 facilities that have had an accident since their most recent PHA, with an HF unit in a NAICS 324 process, or are located within one mile of another facility with a NAICS 324 or 325 process) also are required to implement at least one passive measure at the facility, or an inherently safer technology or design, or a combination of active and procedural measures causing equivalent to or greater than the risk reduction of a passive measure. EPA is providing facilities with flexibility to choose either one or a combination of inherently safer technology (IST) or inherently safer design (ISD), passive, active, or procedural measures, provided it reduces risk at least as much as a practicable passive measure would achieve.
Root Cause Analysis— (Revisions apply to §§68.60 and 68.81)
Under the current RMP rule, facilities are required to conduct an incident investigation following an incident which resulted or reasonably could have resulted in a catastrophic release. The final rule requires facilities to conduct a root cause analysis as part of an incident investigation following an RMP-reportable accident. A root cause analysis is a formal process to identify underlying reasons for failures that led to accidental releases. These analyses require staff knowledgeable in selection and use of root cause analysis techniques. The incident investigation revisions apply to all facilities with Program 2 and 3 processes that experience an RMP-reportable accident. There are approximately 100 accidents with RMP-reportable impacts per year in the baseline (see Exhibit 3-11).
Third-Party Audits— (Revisions apply to §§68.58 and 68.79 and new §§68.59 and 68.80)
The current RMP rule requires facilities to conduct a compliance audit of Program 2 and Program 3 processes at least once every three years. This final rule, also applicable to Program 2 and Program 3 processes, requires the next required compliance audit to be a third-party audit when any one of the following conditions applies:
The facility has had an RMP-reportable accident; or
An implementing agency requires a third-party audit either due to conditions at the facility that could lead to an accidental release of a regulated substance, or due to a previous third-party audit that failed to meet the competency or independence criteria of §68.80(c).
Employee Participation— (Provisions apply to §68.83)
Under the current RMP rule, Program 3 process facilities’ employee participation plans require the owner or operator to consult with employees and their representatives on the conduct and development of process hazards analyses and on the development of the other elements of process safety management (PSM). The owner or operator must provide employees and their representatives access to process hazard analyses and to all other information required to be developed under the current rule.
The final rule revises §68.83 and other aspects of employee participation to require six new components:
Program 2 facilities must develop written employee participation plans of action, which detail employee roles in using reasonable judgment and communication procedures to identify, raise, and address safety concerns. Facilities must also develop and implement a process for employees to report on hazards and noncompliance and must provide employees and their representatives access to hazard reviews and all other information required to be developed under the rule.
The Program 3 employee participation plan must include the consultation of employees and their representatives regarding how to address, correct, resolve, document, and implement recommendations of process hazard analyses, incident investigations, and compliance audits.
The Program 3 employee participation plan must include and ensure that effective methods are in place so that employees knowledgeable in the process and their representatives have specific stop work authorities based on a potential for a catastrophic release. The specific authorities must include:
Recommending to the operator in charge of a unit that an operation or process be shut down, partially or completely, based on the potential for a catastrophic release;
Allowing a qualified operator in charge of a unit to shut down, partially or completely, an operation or process based on the potential for a catastrophic release.
Program 3 employee participation plans must include a process for employees to report on hazards and noncompliance.
Program 2 and Program 3 facilities must provide an annual written or electronic notice to employees indicating RMP information is available.
Program 2 and Program 3 facilities must provide training to inform employees, their representatives, and management involved in the process of the details of the written employee participation plan.
Backup Power for Perimeter Monitors— (Revisions apply to §§68.50 and 68.67)
The final rule requires air control or monitoring equipment associated with prevention and detection of accidental releases from RMP-regulated processes where power loss has been identified as a major hazard to have standby or backup power.
RMP Justification Hazard Evaluation Amplifications— (Revisions apply to §§68.50 and 68.67)
The final rule requires that hazard evaluations explicitly address natural hazards and the risk of power failure. EPA believes that because natural hazards and power loss continue to be factors in RMP accidents and present growing threats to process safety at RMP facilities, a requirement to evaluate and control natural hazards and power loss risks should be explicitly stated in the RMP regulation. Hazard evaluations also must explicitly define stationary source siting as inclusive of processes, equipment, buildings within the stationary source, hazards posed by proximate stationary sources, and accidental release consequences posed by proximity to the public and public receptors. The final rule requires that risk management plans explicitly include declined natural hazard, power loss, and siting evaluation recommendations and their associated justifications.
RAGAGEP gap analysis— (Revisions apply to §§68.69 and 68.175)
The final rule requires that risk management plans explicitly include declined PHA recommendations associated with adopting practices from the most recent version of RAGAGEP and their associated justifications.
Emergency Response
Community Notification of RMP Accidents— (Previsions apply to §§68.90 and 68.95)
The final rule adds a requirement to RMP facility owners and operators who designate themselves as a non-responding facility to develop and implement, as necessary, procedures for informing the public and the appropriate emergency response agencies about accidental releases of RMP-regulated substances. EPA is also requiring that responding and non-responding facilities ensure that:
A community notification system is in place;
The public is promptly notified of an RMP accident release; and
The notification provides appropriate, timely data and information to local responders with the current understanding and best estimates of the nature of the release.
Information Availability
Information Availability— (revisions apply to §68.210)
The final rule requires all facilities to disclose certain chemical hazard information to the public residing, working, or spending significant time within 6 miles3 of the facility in the language (either English or one of two other major languages used in the community) requested by the requester.4 These are new information availability requirements, not currently required. EPA is requiring owners and operators to maintain a record of requesters. The facility or its parent company, if applicable, also must provide ongoing notification through publicly accessible means regarding what information is available upon request for those members of the public, how to request that information, and where to access information on community preparedness.
Regulatory Alternatives to the Final Rule
The RIA analyzed several regulatory alternatives to the final rule. EPA considered one regulatory alternative with lower costs than the final rule costs and one with higher costs. The lower cost regulatory alternative is the same as the final rule except that it considers alternatives for three provisions: root cause analysis, third-party audits, and employee participation. The higher cost alternative applies the STAA and third-party audit provisions to a broader set of facilities but is otherwise the same as the final rule. See Chapter 7 for a description of each regulatory alternative EPA considered, estimates of the incremental costs of the alternatives relative to a baseline of no new rulemaking and breakeven analyses of those alternatives.
Universe of RMP Facilities
Recent data show that 11,740 facilities have filed current risk management plans with EPA and are potentially affected by the final rule. These facilities range from petroleum refineries and large chemical manufacturers to water and wastewater treatment systems; chemical and petroleum wholesalers and terminals; food manufacturers, packing plants, and other cold storage facilities with ammonia refrigeration systems; agricultural chemical distributors; midstream gas plants; and a limited number of other sources that use RMP-regulated substances. A table of the number of affected facilities by sector and NAICS code can be found in Exhibit 3-1.
Summary of Estimated Costs of the Final Rule
Exhibit ES-1 presents a summary of the total undiscounted, discounted, and annualized costs of the final rule. In total, EPA estimates annualized costs of $256.9 million at a 3 percent discount rate and $296.9 million at a 7 percent discount rate over a 10-year period. The provisions associated with the largest annualized cost at a 3 percent discount rate are STAA implementation ($168.7 million), STAA practicability assessment ($27.0 million), and STAA initial evaluation ($18.5 million), followed by information availability ($12.8 million), employee participation plan ($11.5 million), third-party audits ($7.5 million), rule familiarization ($5.8 million), and a community notification system ($4.0 million). The remaining provisions impose annualized costs of less than $1 million, including root cause analysis ($0.7 million), emergency backup power for perimeter monitors used to detect RMP-regulated substances ($0.3 million), and RMP justifications ($0.1 million).
Exhibit ES‑1. Summary of Estimated Costs (millions, 2022 dollars).
Cost Elements |
Total Undiscounted |
Total Discounted (3%) |
Total Discounted (7%) |
Annualized (3%) |
Annualized (7%) |
Rule Familiarization |
$50.9 |
$49.5 |
$47.6 |
$5.8 |
$6.8 |
Safer Technology Alternatives Analysis (STAA) |
|||||
Initial Evaluation |
$176.49 |
$158.2 |
$138.3 |
$18.5 |
$19.7 |
Practicability Assessment |
$256.9 |
$230.2 |
$201.0 |
$27.0 |
$28.6 |
Implementation |
$1,700.4 |
$1,438.9 |
$1,172.6 |
$168.7 |
$204.9 |
Root Cause Analysis |
$7.3 |
$6.2 |
$5.1 |
$0.7 |
$0.7 |
Third-party Audits |
$75.2 |
$64.2 |
$52.8 |
$7.5 |
$7.5 |
Employee Participation Plan |
$114.7 |
$97.9 |
$80.6 |
$11.5 |
$11.5 |
Backup Power for Perimeter Monitors |
$3.3 |
$2.8 |
$2.3 |
$0.3 |
$0.3 |
RMP Justifications |
|||||
No Backup Power |
$.2 |
$0.1 |
$0.1 |
$0.0** |
$0.0** |
Natural Hazards |
$.4 |
$0.4 |
$0.3 |
$0.0** |
$0.0** |
Facility Siting |
$.4 |
$0.4 |
$0.3 |
$0.0** |
$0.0** |
RAGAGEP |
$.3 |
$0.2 |
$0.2 |
$0.0** |
$0.0** |
Community Notification System |
$39.7 |
$33.9 |
$27.9 |
$4.0 |
$4.0 |
Information Availability |
$127.6 |
$108.8 |
$89.6 |
$12.8 |
$12.8 |
Total Cost* |
$2,554.0 |
$2,191.7 |
$1,818.9 |
$256.9 |
|
*Totals may not sum due to rounding.
** Costs are zero due to rounding. Unrounded costs are $15,798 for No Backup Power, $42,307 for Natural Hazards and Facility Siting, and $27,582 for RAGAGEP.
Exhibit ES-2 provides undiscounted yearly costs for the final rule provisions, for Years 1-10. Rule familiarization costs are incurred only in Year 1, and therefore are $0 in subsequent years.
Exhibit ES‑2. Summary of Estimated Undiscounted Yearly Costs (millions, 2022 dollars).
Cost Elements |
Year 1 |
Year 2 |
Year 3 |
Year 4 |
Year 5 |
Year 6 |
Year 7 |
Year 8 |
Year 9 |
Year 10 |
Rule Familiarization |
$50.9 |
$0 |
$0 |
$0 |
$0 |
$0 |
$0 |
$0 |
$0 |
$0 |
STAA |
||||||||||
Initial Evaluation |
$29.9 |
$29.9 |
$29.9 |
$29.9 |
$29.9 |
$5.4 |
$5.4 |
$5.4 |
$5.4 |
$5.4 |
Practicability Assessment |
$43.2 |
$43.2 |
$43.2 |
$43.2 |
$43.2 |
$8.2 |
$8.2 |
$8.2 |
$8.2 |
$8.2 |
Implementation |
$145.0 |
$150.5 |
$156.1 |
$161.7 |
$167.3 |
$172.8 |
$178.4 |
$184.0 |
$189.6 |
$195.1 |
Root Cause Analysis |
$0.8 |
$0.8 |
$0.8 |
$0.8 |
$0.8 |
$0.8 |
$0.8 |
$0.8 |
$0.8 |
$0.8 |
Third-party Audits |
$7.5 |
$7.5 |
$7.5 |
$7.5 |
$7.5 |
$7.5 |
$7.5 |
$7.5 |
$7.5 |
$7.5 |
Employee Participation Plan |
$11.5 |
$11.5 |
$11.5 |
$11.5 |
$11.5 |
$11.5 |
$11.5 |
$11.5 |
$11.5 |
$11.5 |
Backup Power for Perimeter Monitors |
$0.3 |
$0.3 |
$0.3 |
$0.3 |
$0.4 |
$0.4 |
$0.4 |
$0.4 |
$0.4 |
$0.4 |
Justifications** |
||||||||||
No Backup Power |
$0.0 |
$0.0 |
$0.0 |
$0.0 |
$0.0 |
$0.0 |
$0.0 |
$0.0 |
$0.0 |
$0.0 |
Natural Hazards |
$0.0 |
$0.0 |
$0.0 |
$0.0 |
$0.0 |
$0.0 |
$0.0 |
$0.0 |
$0.0 |
$0.0 |
Facility Siting |
$0.0 |
$0.0 |
$0.0 |
$0.0 |
$0.0 |
$0.0 |
$0.0 |
$0.0 |
$0.0 |
$0.0 |
RAGAGEP |
$0.0 |
$0.0 |
$0.0 |
$0.0 |
$0.0 |
$0.0 |
$0.0 |
$0.0 |
$0.0 |
$0.0 |
Community Notification System |
$4.0 |
$4.0 |
$4.0 |
$4.0 |
$4.0 |
$4.0 |
$4.0 |
$4.0 |
$4.0 |
$4.0 |
Information Availability |
$12.8 |
$12.8 |
$12.8 |
$12.8 |
$12.8 |
$12.8 |
$12.8 |
$12.8 |
$12.8 |
$12.8 |
Total Cost* |
$305.8 |
$260.5 |
$266.1 |
$271.7 |
$277.3 |
$223.4 |
$229.0 |
$234.5 |
$240.1 |
$245.7 |
*Totals may not sum due to rounding.
** Costs are zero due to rounding. Unrounded costs are $15,798 for No Backup Power, $42,307 for Natural Hazards and Facility Siting, and $27,582 for RAGAGEP.
Baseline Damages
Accidents and releases from RMP facilities occur every year, involving toxic vapors, fires, and explosions, and resulting in fatalities, injuries, property damage, evacuations, and more. Using data on facility-reported accident impacts from the RMP Accident Database, EPA summarizes the damages that were caused by RMP-reportable accidents during each of the five years from 2016 to 2020, the most recent five-year period for which RMP program data is available. Exhibit ES-3 summarizes reported RMP accident impacts and, when possible, monetizes them.5 During this timeframe, 488 RMP accidents with either or both onsite and offsite damages occurred at RMP facilities. The reported impacts in the RIA correspond to program requirements (40 CFR 68.42 and 68.168), but many additional accident impacts are not required to be reported and thus are not reflected in EPA’s monetized estimates.
Exhibit ES‑3. Summary of Quantified Baseline Damages 2016-2020 (millions, 2022 dollars).
|
Unit Value |
5-Year Total |
Average/Year |
Average/Accident |
Median /Accident |
Onsite |
|||||
Fatalities |
$10.4 |
$187.9 |
$37.57 |
$0.38 |
$0.00 |
Injuries |
$0.05 |
$28.75 |
$5.75 |
$0.06 |
$0.05 |
Property Damage |
|
$2,273 |
$454.58 |
$4.66 |
$0.00 |
Onsite Total |
|
$2,489.49 |
$497.90 |
$5.10 |
$0.05 |
Offsite |
|||||
Fatalities |
$10.4 |
$0.00 |
$0.00 |
$0.00 |
$0.00 |
Hospitalizations |
$0.045 |
$1.40 |
$0.28 |
$0.00 |
$0.00 |
Medical Treatment |
$0.001 |
$0.13 |
$0.03 |
$0.00 |
$0.00 |
Evacuations* |
$0.000 |
$18.99 |
$3.80 |
$0.04 |
$0.00 |
Sheltering in Place* |
$0.000 |
$12.58 |
$2.52 |
$0.03 |
$0.00 |
Property Damage |
|
$178.55 |
$35.71 |
$0.37 |
$0.00 |
Offsite Total |
|
$211.66 |
$42.33 |
$0.43 |
$0.00 |
Total** |
|
$2,701.14 |
$540.23 |
$5.54 |
$0.05 |
* The unit value is $293 for evacuations and $147 for sheltering-in place, so when expressed in rounded millions, the value represented in the table is zero.
**Totals may not sum due to rounding.
EPA monetized reported onsite and offsite damages when possible. EPA estimated total average annual onsite damages of $497.9 million. The largest monetized, average annual, onsite damage category was property damage, which resulted in average annual damage of approximately $454.58 million. The next largest impact was onsite fatalities ($37.57 million) and injuries ($5.75 million).
Again, reflecting reported impacts, EPA estimated total average annual offsite damages of $42.33 million. The largest monetized, average annual, offsite damage category was property damage, which resulted in average annual damage of approximately $35.71 million. The next largest impact was from evacuations ($3.80 million), sheltering in place ($2.52 million), hospitalizations ($0.28 million), and medical treatment ($0.03 million). In total, EPA estimated monetized damages from RMP facility accidents over the five-year period of $540.23 million per year.6
Overall, monetized damages from reported accident impacts in the RMP Accident Database from 2016 through 2020 ranged from a low of $100 to a high of $700 million, with a median accident value of $50,000 for the 488 RMP impact accidents. Median values were zero in all damage categories except for onsite (worker) injuries. While an important objective of the final rule is to reduce the probability of a major catastrophe, the baseline damages in Exhibit ES-3 do not reflect the full costs of a catastrophe. However, the baseline damages shed light on the nature and extent of existing costs from RMP facility accidents. EPA has determined that the final rule provisions will help mitigate these costs.
In addition to the monetized baseline accident damages reflecting impacts required to be reported by RMP facilities, there are many additional RMP accident impacts that EPA was unable to quantify or monetize due to a lack of data. Unquantified baseline damages include potential health risks from exposure to toxic chemicals, lost productivity, responder costs, transaction costs, negative impacts on property values, environmental damages, unquantified evacuation and shelter-in-place costs, and damages related to catastrophic releases. In some cases, these damages could be even more detrimental to society than those damages that can be quantified. These categories are discussed in detail in Chapter 6.
Summary of Benefits
EPA expects the final rule to reduce accident risks across the spectrum of RMP facilities and accident categories. The rule requirements are targeted at reducing both the probability and the magnitude of the full range of accident types regulated by the RMP program including fires, explosions, and releases of toxic vapors. Accident risks posed by the variety of RMP facilities in numerous industries (listed in Exhibit 3-1) should decrease, with larger impacts expected for P3 facilities and especially petroleum refineries and chemical manufacturers that meet the three conditions for the STAA practicability and implementation requirements. Avoided accident damages include those that are required to be reported by RMP facilities such as fatalities, injuries, property damage, hospitalizations, medical treatment, evacuations, sheltering-in-place and others. EPA also expects that the final rule provisions will reduce baseline damages that are not required to be reported such as taxpayer-funded responder costs, transaction costs for parties affected by the accident, property value reductions in neighborhoods nearby, unmonetized costs of evacuations and sheltering-in-place, the costs of potential health risks from exposure to toxic chemicals, lost productivity, and more. In addition, information benefits will be experienced due to several final rule provisions such as the community notification requirements and the back-up power for monitoring equipment. Finally, the rule will reduce the likelihood of major catastrophes. Although EPA was unable to quantify the reductions in damages that may result from the final rule provisions, EPA expects that a substantial portion of future damages will be prevented by the final rule.
Costs Relative to Benefits: A Limited Breakeven Analysis
EPA is unable to estimate quantitative benefits for the final rule because EPA has no data to project the specific contribution of each final rule provision to reductions in the frequency or severity of future accidents. As shown by accident trends, accident frequency and severity are difficult to predict. In addition, EPA does not have data to estimate the value of all categories of baseline damages that will be reduced by the final rule, nor is there data to estimate the value of improved information due to the final rule. Therefore, the incremental impact on the risk of an RMP facility release resulting from each of the revised RMP rule provisions is uncertain and the full value of reduced risks is unknown. These unknowns prevent EPA from conducting a standard benefit cost analysis.
Instead, to provide insight into the trade-off between the costs and benefits of the final rule provisions, this RIA presents a breakeven analysis limited by incomplete information. The results of this analysis should be viewed with caution. It consists of a simple comparison between the estimated annualized costs of the rule and the limited set of monetized baseline accident impacts. The annualized costs of the final rule (at a 3 percent discount rate) are estimated as $257 million, while average annual monetized accident impacts based on self-reported RMP facility data are estimated as $540 million. The many baseline accident impacts that are not reflected in the $540 million baseline accident cost estimate, yet are expected to be avoided as a benefit of the final provisions, include responder costs, transaction costs, property value reductions, unmonetized costs of evacuations and sheltering-in-place, the costs of potential health risks from exposure to toxic chemicals, and productivity losses, among others. The $540 million estimate also does not reflect the full set of baseline inefficiencies that will be improved due to the improved information offered by several of the final provisions such as the community notification requirements and the back-up power for monitors. Finally, as explained above, the baseline estimate of costs does not include major catastrophic losses. In light of these numerous unmonetized impacts, the estimate of baseline costs potentially reduced by the final rule is only partial and is a conservative estimate.
The limited breakeven analysis suggests that the final rule will need to reduce damages valued at approximately $2 billion over any number of future accidents to achieve breakeven. Alternatively, on an annual basis, given estimated annualized costs of approximately $257 million (3% discount rate) and an estimated number of annual accidents of about 100, fewer than approximately 47 accidents, each with average monetized damages of approximately $5.5 million as estimated for the most recent five-year baseline period, will need to be prevented annually by the final rule to breakeven. Breaking even with fewer than 47 will depend on whether high magnitude accidents are prevented and also on the value of the unquantified accident damages that will be avoided. As the range of monetized accident impacts suggests (from $100 to $700 million for 2016 to 2020), the variation in monetized damages is substantial. Preventing a single high cost accident annually would offset annual rule costs. In sum, when considering the rule’s likely benefits of avoiding some portion of the monetized accident impacts, as well as the additional unmonetized benefits, EPA believes the costs of the rule are reasonable in comparison to its expected benefits. When assessing the reasonableness of the benefits and burdens of various regulatory options, EPA must place weight on both preventing more common accidental releases captured in the accident history portion of the RMP database while also placing weight on less quantifiable potential catastrophic events. The Agency’s judgment as to what regulations are “reasonable” is informed by both quantifiable and unquantifiable burdens and benefits.
CHAPTER 1: Introduction and Background
1.1 History and Need for the Rule
1.1.1 Overview of the Risk Management Program
Serious chemical accidents occurring in the 1970s and 1980s, including accidents in Bhopal, India; Seveso, Italy; and Pasadena, Texas, led to a series of legislative reforms relating to chemical safety in industrialized countries.7,8 In the United States,, the Emergency Planning and Community Right to Know Act (EPCRA) was enacted in 1986 to promote community emergency planning and preparedness and provide local responders and the public with information about the chemical hazards in their community (42 U.S.C. 11002 et seq.). In 1990, sections 112(r) and 304 of the Clean Air Act (CAA) were enacted to help prevent severe chemical facility accidents. Section 304 required the Occupational Safety & Health Administration (OSHA) to publish a chemical process safety standard (Process Safety Management, or PSM standard) to prevent accidental releases of chemicals that could pose a threat to employees. Section 112(r) required the Environmental Protection Agency (EPA) to publish Accidental Release Prevention Program regulations to detect and prevent or minimize chemical releases and their consequences if they occur.
CAA section 112(r) required EPA to develop a list of at least 100 regulated substances known to cause or that may reasonably be anticipated to cause death, injury, or serious adverse effects to human health or the environment (42 U.S.C 7412(r)). EPA was also required to establish threshold quantities (TQs) for these substances that determine the applicability of rules to prevent accidental releases of these substances. Section 112(r)(7)(B) required EPA to promulgate reasonable regulations and appropriate guidance to provide, to the greatest extent practicable, for the prevention and detection of accidental releases of regulated substances and for response to such releases by the owners or operators of the sources of such releases. The section mandates that the regulations require the owner or operator of a facility “to prepare and implement a risk management plan to detect and prevent or minimize accidental releases of such substances from the facility, and to provide a prompt emergency response to any such releases in order to protect human health and the environment.” The section further mandates that the plan include:
A hazard assessment to assess the potential effects of an accidental release of any regulated substance. This assessment must include an estimate of potential release quantities and a determination of downwind effects, including potential exposures to affected populations. Such assessment must include a previous release history of the past five years, including the size, concentration, and duration of releases, and must include an evaluation of worst-case accidental releases.
A program for preventing accidental releases of regulated substances, including safety precautions and maintenance, monitoring and employee training measures to be used at the source.
A response program providing for specific actions to be taken in response to an accidental release of a regulated substance to protect human health and the environment, including procedures for informing the public and local agencies responsible for responding to accidental releases, emergency health care, and employee training measures.
Finally, section 112(r) requires the owner or operator of an affected facility to develop and file a Risk Management Plan with EPA, the U.S. Chemical Safety Board (CSB) (also established under the section), and State, and local response agencies.
OSHA adopted its PSM standard (codified at 29 CFR 1910.119) in 1992 (57 FR 6403, Feb. 24, 1992). The PSM standard requires facilities to develop and implement an integrated approach to chemical process safety and include the following elements: accurate, up-to-date diagrams of all process equipment; an analysis of the process hazards; standard operating procedures; training; maintenance; pre-startup reviews; management of change; compliance audits; incident investigation; employee participation; hot-work9 permits; contractor training; and emergency response. The applicability of the PSM standard is driven by the presence of specific chemicals in quantities above thresholds set in the standard.
EPA published its section 112(r) regulations in two stages − a list of regulated substances and TQs in 1994 (59 FR 4478, January 31, 1994), and the RMP requirements in 1996 (61 FR 31731, June 20, 1996); both are codified at 40 CFR part 68. As required by section 112(r), part 68 includes several major requirements that were not covered by the PSM standard. These include a hazard assessment consisting of an offsite consequences analysis (OCA) and five-year accident history, and the development and submission of a risk management plan that summarizes a source’s RMP. EPA also required stationary sources to develop a management system to oversee the program and included emergency response program requirements beyond those contained in the PSM standard. RMPs were first submitted to EPA in June 1999 and must be updated at least every five years. EPA has amended the rule over time to modify the list of substances, revise data requirements, and to address other issues. The primary requirements adopted in 1996, however, remain in place.
The RMP rule establishes three program levels and requires facility owners or operators to conduct hazard assessments and submit RMPs regardless of the program level. Program 1 requirements apply to processes that will not affect the public in the case of a worst-case release and with no accidents with specific offsite consequences within the past five years. Program 1 provisions impose limited hazard assessment requirements and emergency response requirements.
Program 2 provisions apply to processes not eligible for Program 1 or subject to Program 3, and impose streamlined prevention program requirements, including safety information, hazard review, operating procedures, training, maintenance, compliance audits, and incident investigation elements. Program 2 provisions also impose hazard assessment, management, and emergency response requirements. Program 2 processes are primarily agricultural chemical distributors, chemical wholesalers, and chlorine use at publicly owned water and wastewater facilities in States without OSHA-approved State Plans. To further reduce the burden on facilities with Program 2 processes, EPA developed and published several industry-specific guidance documents10 and an OCA guidance document.
Program 3 requirements apply to processes not eligible for Program 1 and that are either subject to OSHA's PSM standard, under Federal or State OSHA programs, or classified in one of ten specified NAICS codes (1997 version) listed at 40 CFR 68.10(d)(1). The ten NAICS codes are:
32211 (pulp mills)
32411 (petroleum refineries)
32511 (petrochemical manufacturing)
325181 (alkali and chlorine manufacturing)
325188 (all other basic inorganic chemical manufacturing)
325192 (cyclic crude and intermediate manufacturing)
325199 (all other basic organic chemical manufacturing)
325211 (plastics material and resin manufacturing)
325311 (nitrogenous fertilizer manufacturing)
32532 (pesticide and other agricultural chemical manufacturing)
Program 3 requirements impose elements nearly identical to those in OSHA’s PSM standard. The Program 3 prevention program includes requirements relating to the following:
Process safety information
PHA
Operating procedures
Training
Mechanical integrity
Management of change
Pre-startup review
Compliance audits
Incident investigations
Employee participation
Hot-work permits, and
Contractors.
Program 3 provisions also impose the same hazard assessment, management, and emergency response requirements that are required for Program 2.
The following flow chart demonstrates how facilities determine the program level to which they are subject:11
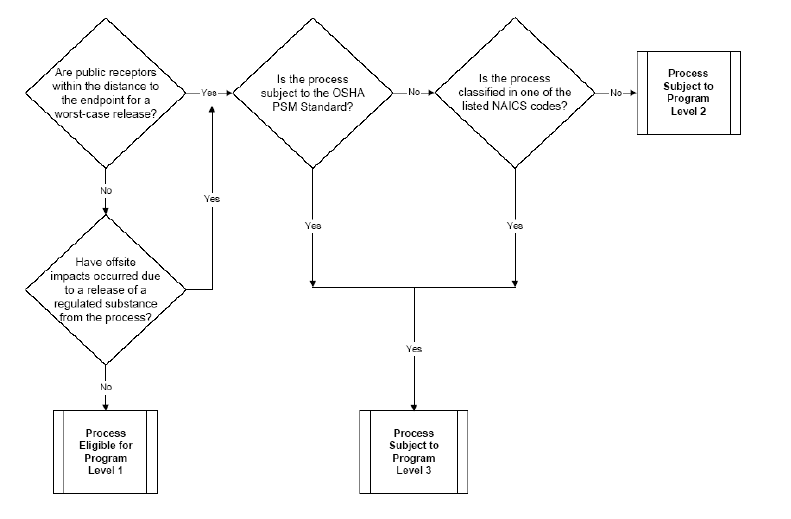
Facilities that are exempt from the OSHA PSM standard may be subject to EPA requirements under the RMP rule. This can occur for several reasons. First, the lists of substances regulated are not identical; for example, EPA lists aqueous ammonia in any solution that is 20 percent ammonia or more while OSHA covers aqueous ammonia only at concentrations of 44 percent or more. Second, because OSHA has no authority over State and local government employees, the OSHA PSM standard does not apply to publicly-owned facilities (mainly water and wastewater treatment systems) in States where OSHA implements and enforces the standard (about half the States). States with OSHA-approved workplace safety and health programs (referred to as State-Plans) must implement and enforce standards that are at least as effective as federal OSHA standards for protecting workers, and must also provide equivalent protection to State and local government employees as a condition of OSHA approval. Last, regulatory exemptions are not identical; for example, the OSHA PSM standard exempts normally unoccupied remote facilities, but the RMP rule does not.
1.1.2 Other Recent Rulemakings and Related Actions
In response to catastrophic chemical facility accidents such as the 2013 explosion at the West Texas Fertilizer Company in West, Texas and others,12 in 2013, President Obama issued E.O. 13650, entitled Improving Chemical Facility Safety and Security.13 This E.O. requires EPA and OSHA to consider whether and how to update and modernize the RMP rule and PSM standard, among other requirements. Both EPA and OSHA conducted public listening sessions14 and issued requests for information (RFIs) to seek input from the public and the regulated community on potential revisions to the rules.15 Based on feedback received from the RFIs and public listening sessions, EPA subsequently published a Notice of Proposed Rulemaking (NPRM) on March 14, 2016 (81 FR 13637). The 2017 amendments rule (Accidental Release Prevention Requirements: Risk Management Programs Under the Clean Air Act) was the result of EPA’s consideration of the public comments received on the RFI and NPRM, recommendations from the CSB, comments received during E.O. 13650 listening sessions, and information gained by EPA through inspection of RMP facilities and enforcement of the rule over the previous 17 years. The final amendments rule was published in the Federal Register on January 13, 2017 (82 FR 4594, hereafter referred to as the “2017 amendments rule”).
In response to the 2017 amendments rule, EPA received three petitions for reconsideration from stakeholders,16,17,18 expressing concerns and requesting a delay or stay in the rule’s implementation. On May 30, 2018, EPA published a proposed rule reconsidering the 2017 amendments rule. The final reconsideration rule (Accidental Release Prevention Requirements: Risk Management Programs Under the Clean Air Act) was published in the Federal Register on December 19, 2019 (84 FR 69834, hereafter referred to as the “2019 reconsideration rule”).
1.1.3 Recent Events and Rationale Leading to the Final Rule
On January 20, 2021, President Biden issued E.O. 13990, Protecting Public Health and the Environment and Restoring Science to Tackle the Climate Crisis.19 E.O. 13990 directed Federal agencies to review current regulations and take action to address priorities established by the current Administration, including bolstering resilience to the impacts of climate change and prioritizing environmental justice. The E.O. did not direct the Agency to publish a solicitation for information from the public. However, on May 28, 2021 EPA issued a notice of virtual public listening sessions and request for public comment to obtain information on the adequacy of prior revisions to the RMP regulations including the 2017 amendments and 2019 reconsideration rules. The virtual listening sessions were held on June 16 and July 8, 2021 and were attended by OSHA to foster continued coordination with EPA. Commenters discussed revisions and updates to the prevention program, emergency response requirements, information availability requirements, and regulated chemicals. Commenters also discussed the importance of incorporating climate changes risks and impacts into the RMP regulations and expanding the application of environmental justice.
The RMP regulations have contributed to the prevention and mitigation of chemical accidents in the United States. Accident histories submitted with RMPs have shown a reduction in the frequency of accidents since the beginning of the program. However, serious chemical releases from RMP-regulated processes have continued. RMP data for 2011 through 2020, the most recent 10-year period with complete information, show that each year an average124 accidents occurred with RMP-reportable impacts. RMP data for 2016 through 2020, the most recent five-year period with complete information, averaged an annual 98 accidents with RMP-reportable impacts. RMP-reportable accidents remain a significant concern to communities, particularly those located near the perimeter of the facilities, and impose significant social costs annually. EPA believes that the revisions to the RMP in this final rule will further protect human health and the environment from chemical hazards through advancement of enhanced PSM.
Facilities subject to the RMP regulation pose significant risks to the public and the environment because of the types and quantities of hazardous substances they store and use in chemical processes. These risks stem from potential accidental chemical releases which can cause fires, explosions, and harmful vapor clouds. Chemical accidents and their resulting impacts not only kill and injure people but can cause significant damage to property, goods produced, plant equipment and structures; and nearby industrial, commercial, and residential buildings, equipment, and furnishings. Damage can also occur to the natural environment and negatively affect nearby ecosystems and wildlife. Resources, such as emergency personnel and equipment, are diverted to address the fire, explosion, or vapor cloud. Residents living nearby may need to shelter-in-place or evacuate. Properties located near the accident may lose value because of the perceived risks posed by proximity to a facility that has had an accident.
EPA expects the benefits of the final rule to include reductions in the numbers of people killed, injured, and evacuated or otherwise inconvenienced by sheltering-in-place; reductions in the damage caused to property onsite and offsite including product, equipment, and buildings; reductions in damages to the environment and ecosystems; and reductions in emergency response and other resources diverted to protect people, extinguish fires, and clean up affected areas. The final rule will also provide other benefits, such as increased public information, leading to more efficient decisions in nearby property markets and regarding emergency response preparedness. The final rule provisions reduce the probability of a catastrophic release. By reducing the chance of an accidental release, the final rule also avoids expenditures on lawsuits and other transactions to address resulting accidental harms.
Some of the final rule provisions target RMP facilities in close proximity to certain other RMP facilities and/or RMP facilities that have had recent accidents. Both types of facilities increase the likelihood of exposures to nearby communities to a future accident’s offsite impacts. Because communities with environmental justice concerns are over-represented in these nearby communities, the final rule provisions will provide proportionately greater relief to historically marginalized fenceline communities than to the general population.
1.2 Organization of the Analysis
This RIA is organized as follows:
Chapter 2 describes RMP provisions that EPA is adding or revising.
Chapter 3 discusses the universe of regulated entities and the various divisions used in the analysis.
Chapter 4 discusses the basis for cost estimates for each of the provisions and alternatives and presents the unit costs.
Chapter 5 presents the total estimated costs for each provision and for all provisions combined.
Chapter 6 discusses the social benefits of the rule.
Chapter 7 discusses the regulatory alternatives analyzed.
Chapter 8 presents the small entity impacts analysis.
Chapter 9 presents the environmental justice analysis.
Chapter 10 discusses limitations of the analysis and conclusions.
Chapter 11 discusses other analyses required under applicable statutes and E.Os.
CHAPTER 2: Final Rule Provisions
This chapter presents a summary of the provisions in the final rule that EPA has determined impose new costs. Total benefits of the final rule are addressed in Chapter 6. The final provisions include additions and revisions to existing RMP requirements.
2.1 Summary of Provisions and Applicability to Private Sector Facilities
The RIA analyzed the following new requirements and revisions to current requirements:
2.1.1 New Prevention Program Provisions
New prevention program provisions include requirements for STAA, root cause analysis, third-party audits, employee participation, and backup power for perimeter monitors.
The current RMP regulations do not require facilities to conduct a STAA. The STAA requirement in the final rule includes multiple components: the initial evaluation to identify alternatives, a practicability assessment to determine the costs and assess the reasonableness of implementing technology alternatives, and in some cases, implementation of safer measures. The former two components are discussed under 2.1.1.1 and the implementation component is discussed under 2.1.1.2.
2.1.1.1 STAA— (Revisions apply to §68.3 and §68.67)
Under the final rule, all facilities with Program 3 processes in NAICS codes 324 and 325 will be required to conduct an initial evaluation of safer technologies and alternatives. Of those facilities, facilities that have had an accident since their most recent process hazard analysis or that are located within one mile of another facility with a covered process in NAICS code 324 or 325, will be required to also conduct a practicability assessment.20 The final rule also requires that all facilities in NAICS 324 using HF in an alkylation unit (approximately 45 facilities) conduct a practicability assessment to assess inherently safer alternatives to HF alkylation, regardless of accident history or proximity to another NAICS 324- or 325-regulated facility. Because EPA is requiring STAA only in sectors with the most frequent and severe documented and continuing accidents, EPA expects the total burden of the STAA provision to be lower than the total burden that would have been imposed by the 2017 amendments rule’s proposed STAA provision (but removed in the 2019 reconsideration rule), which would have applied more broadly.
2.1.1.2 STAA Implementation— (Revisions apply to §68.3 and §68.67)
Under the final rule, all facilities required to conduct a STAA practicability assessment (i.e., Program 3 NAICS 324 and 325 facilities that have had an accident since their most recent process hazard analysis, with an HF unit in a NAICS 324 process, or located within one mile of another facility with a NAICS 324 or 325 process) are required to implement at least one passive measure at the facility, or an inherently safer technology or design, or a combination of active and procedural measures equivalent to or greater than the risk reduction of a passive measure. EPA is providing facilities with flexibility to choose either one or a combination of IST/ISD, passive, active, or procedural measures, provided the choice reduces risk at least as much as a practicable passive measure would achieve.
2.1.1.3 Root Cause Analysis— (Revisions apply to §§68.60 and 68.81)
A root cause analysis is a formal process to identify underlying reasons for failures that lead to accidental releases. These analyses usually require staff trained in the technique. Under the current RMP rule, facilities are required to conduct an incident investigation following an incident that resulted or reasonably could have resulted in a catastrophic release. The final rule requires facilities to conduct a root cause analysis as part of an incident investigation following an RMP-reportable accident. The new requirement will apply to all facilities with Program 2 and 3 processes that experience an RMP-reportable accident. There are approximately 100 accidents with onsite impacts per year in the baseline (see Exhibit 3-11).
2.1.1.4 Third-Party Audits— (Revisions apply to §§68.58 and 68.79 and new §§68.59 and 68.80)
The current RMP rule requires facilities to conduct a compliance audit of Program 2 and Program 3 processes at least once every three years. The final rule, also applicable to Program 2 and Program 3 processes, requires the next required compliance audit to be a third-party audit when any one of the following conditions applies:
The facility has had an RMP-reportable accident; or
An implementing agency requires a third-party audit either due to conditions at the stationary source that could lead to an accidental release of a regulated substance, or due to a previous third-party audit that failed to meet the competency or independence criteria of §68.80(c).
EPA believes that these third-party audit provisions will help ensure that owners and operators of RMP facilities objectively and adequately explore all opportunities to prevent or minimize accidental releases of regulated substances to protect human health and the environment. EPA estimates that only a small number of facilities will be subject to the third-party audit requirement each year.
2.1.1.5 Employee Participation— (Provisions apply to §68.83)
Under the current RMP rule, Program 3 process facilities’ employee participation plans require the owner or operator to consult with employees and their representatives on the conduct and development of process hazards analyses and on the development of the other elements of PSM. The owner or operator must provide employees and their representatives access to PHAs and to all other information required to be developed under this rule.
The final rule revises §68.83 and other aspects of employee participation to require six new components:
Program 2 process facilities must develop written employee participation plans of action, which detail employee roles in using reasonable judgment and communication procedures to identify, raise, and address safety concerns. Facilities must also develop and implement a process for employees to report on hazards and noncompliance and must provide employees and their representatives access to hazard reviews and all other information required to be developed under this rule.
The Program 3 employee participation plan must include the consultation of employees and their representatives regarding how to address, correct, resolve, document, and implement recommendations of process hazard analyses, incident investigations, and compliance audits.
The Program 3 employee participation plan must include and ensure that effective methods are in place so that employees knowledgeable in the process and their representatives have specific stop work authorities based on a potential for a catastrophic release. The specific authorities must include:
Recommending to the operator in charge of a unit that an operation or process be shut down, partially or completely, based on the potential for a catastrophic release.
Allowing a qualified operator in charge of a unit to shut down, partially or completely, an operation or process, based on the potential for a catastrophic release.
Program 3 employee participation plans must include a process for employees to report on hazards and noncompliance.
Program 2 and Program 3 process facilities must provide an annual written or electronic notice to employees indicating RMP information is available.
Program 2 and Program 3 process facilities must provide training to inform employees, their representatives, and management involved in the process of the details of the written employee participation plan.
These employee participation provisions will ensure that owners and operators who have not fully developed employee participation programs have additional measures in place to prevent and minimize accidental releases of RMP-regulated substances. These new provisions will not impose a burden on facilities that already have robust employee participation programs in place.
2.1.1.6 Backup Power for Perimeter Monitors— (Revisions apply to §§68.50 and 68.67)
Currently, many facilities voluntarily have backup power installed for perimeter monitors. The final rule requires those facilities that have air control or monitoring equipment associated with prevention and detection of accidental releases from RMP-regulated processes and that have identified power loss as a major hazard, to install standby or backup power. EPA believes this will help ensure continuous monitoring so that potential exposure to chemical substances can be measured during and following a natural disaster.
2.1.2 RMP Justifications
The final rule clarifies requirements for hazard evaluations to consider natural hazards and power systems. It also requires justifications when facilities choose to decline certain recommendations.
2.1.2.1 Hazard Evaluation Amplifications— (Revisions apply to §§68.50 and 68.67)
The final rule requires that hazard evaluations explicitly address natural hazards and the risk of power failure and standby or emergency power systems. EPA believes that because natural hazards and power loss continue to be factors in RMP accidents and due to climate change present growing threats to process safety at RMP facilities, a requirement to evaluate and control natural hazards should be explicitly stated in the RMP regulation. Hazard evaluations will also have to explicitly define stationary source siting as inclusive of processes, equipment, buildings within the stationary source, hazards posed by proximate stationary sources, and accidental release consequences posed by proximity to the public and public receptors. The final rule will require that RMPs explicitly include declined natural hazard, power loss, and siting evaluation recommendations and their associated justifications.
2.1.2.2 Recognized and Generally Accepted Good Engineering Practices (RAGAGEP) gap analysis— (Revisions apply to §§68.69 and 68.175)
The final rule requires that RMPs explicitly include declined PHA recommendations associated with adopting practices from the most recent version of RAGAGEP and their associated justifications.
EPA assumes the clarifying amplifications will not impose a burden on facilities. EPA believes including these declined recommendations and associated justifications will provide useful information about potential hazards associated with a facility and will impose only a nominal burden on owners or operators.
2.1.3 Emergency Response
2.1.3.1 Community Notification of RMP Accidents— (Provisions apply to §§68.90 and 68.95)
The
final rule will add a requirement that RMP facility owners and
operators who designate themselves as a non-responding facility,
develop and implement, as necessary, procedures for informing the
public and the appropriate emergency response agencies about
accidental releases of RMP-regulated substances. Responding
facilities should already have mechanisms and procedures in place in
the baseline to notify the public through emergency response programs
or plans.
EPA is also requiring that responding and non-responding facilities ensure that:
A community notification system is in place.
The public is promptly notified of an RMP accident release.
The notification provides appropriate timely data and information to local responders with the current understanding and best estimates of the nature of the release.
EPA expects that these provisions, in combination with the currently required annual emergency coordination meetings and notification exercises, will enhance coordinated notification to the public, improve documented accountability for the notification process, and help ensure timely decisions about notification of releases, particularly those with offsite impacts. The emergency response provisions apply to facilities with Program 2 or 3 processes.
2.1.4 Information Availability
2.1.4.1 Information Availability— (revisions apply to §68.210)
The final rule requires all facilities to disclose certain chemical hazard information to the public residing, working, or spending significant time within 6 miles21 of the facility in the language (either English or one of two other major languages) used in the community as specified by the requester.22 These are new information availability requirements. EPA is requiring owners and operators to maintain a record of requestors. The facility or its parent company, if applicable, will also be required to provide ongoing notification through publicly accessible means on three items:
1) The information that is available upon request for those members of the public,
2) How to request that information, and
3) Where to access information on community preparedness.
Facilities could provide this notification on a company website, at public libraries, in local papers, or via other means appropriate for particular communities and facilities.
The information to be disclosed includes:
Names of regulated substances at the facility.
Safety Data Sheets (SDS) for all regulated substances at the facility.
Accident history information.
Declined recommendations and the justifications for declining them.
Emergency response program information.
List of scheduled exercises.
Local Emergency Planning Committee (LEPC) or local response agency contact information.
EPA believes these revised information availability provisions will improve information sharing within communities, allow affected communities to obtain information from RMP facilities, and ensure information availability in areas without LEPCs.
2.2 Applicability to Government-owned Facilities and Entities
The final rule is applicable to local governments that own and operate RMP facilities (primarily water and wastewater systems, but also some swimming pools23), to delegated agencies that implement the final rule, and to LEPCs that coordinate with facilities.
2.3 Changes in the Final Rule RIA from the Proposed Rule RIA
The final rule RIA makes several changes from the proposed rule RIA in response to more recent data availability, public comments, and differences between proposed and final regulatory requirements. The final rule RIA updates all wage and other monetary assumptions, including monetized benefits, to use the more recently available sources and presents results in 2022 dollars. The universe of facilities examined in the final rule RIA remains the same as the universe in the proposed rule RIA. The final rule RIA updates or adds costs for several provisions:
Rule familiarization costs: updated assumptions on the number of hours required for Delegating Implementing Agencies and most facilities to be consistent with LEPCs in response to public comments.
Third-party audits: Costs updated to reflect a change in the provision requiring third-party audits after any accident.
Initial Evaluation and Practicability Assessment: costs updated to reflect changes to the provision requiring STAA initial evaluation for more facilities and the practicability assessment for certain facilities that experience an accident since their most recent process hazard analysis. Updated cost estimates to account for less effort required the second time a STAA analysis is completed.
STAA Implementation: New cost for the provision now requiring certain facilities to implement one or more measures that has up-to passive measure risk reduction.
Public Disclosure: New cost added to capture translation and ID verification requirements.
Justifications: New costs added to capture four justification requirements in RMP submissions for RAGAGEP, Facility Siting, Natural Hazards, and Emergency Backup Power, which were not previously costed in the proposed rule RIA.
Emergency Backup Power for Perimeter Monitors: Updated generator cost assumptions and added recurring operation and maintenance costs in response to public comments.
Employee Participation Plan: Added a cost for training requirements in response to public comments.
CHAPTER 3: Universe of RMP Facilities and
Recent data show that 11,740 facilities have filed current RMPs with EPA and are potentially affected by the final rule. These facilities range from petroleum refineries and large chemical manufacturers to water and wastewater treatment systems; chemical and petroleum wholesalers and terminals; food manufacturers, packing plants, and other cold storage facilities with ammonia refrigeration systems; agricultural chemical distributors; midstream gas plants; and a limited number of other sources that use RMP-regulated substances. This chapter describes these facilities and how they are categorized for the purposes of the economic analysis.
3.1 Universe of RMP Facilities
Exhibit 3-1 presents the numbers of facilities according to RMP reporting as of December 31, 2020, by industrial sector and chemical use. Exhibit 3-2 presents the number of facilities in each sector in the form of a bar chart.
Exhibit 3-1: Number of Affected Facilities by Sector as of December 31, 2020.
Sector |
NAICS Codes |
Number of facilities |
Chemical Uses |
Administration of environmental quality programs (i.e., governments) |
92 |
10 |
Use chlorine and other chemicals for water treatment |
Water/sewage/other systems (i.e., government-owned water) |
2213 (Government-owned) |
1,439 |
Use chlorine and other chemicals for water treatment |
Agricultural chemical distributors/wholesalers |
11, 424 (except 4246, 4247) |
3,315 |
Store ammonia for sale; some in NAICS 111 and 115 use ammonia as a refrigerant |
Chemical manufacturing |
325 |
1,502 |
Manufacture, process, store |
Chemical wholesalers |
4246 |
317 |
Store for sale |
Food and beverage manufacturing |
311, 312 |
1,571 |
Use (mostly ammonia) as a refrigerant |
Oil and gas extraction |
211 |
719 |
Intermediate processing (mostly regulated flammable substances and flammable mixtures) |
Other |
21 (except 211), 23, 44, 45, 48, 491, 54, 55, 56, 61, 62, 71, 72, 81, 99 |
246 |
Use chemicals for wastewater treatment, refrigeration, store chemicals for sale |
Other manufacturing |
313, 314, 315, 326, 327, 33 |
375 |
Use various chemicals in manufacturing process, waste treatment |
Other wholesale |
421, 422, 423 |
39 |
Use (mostly ammonia) as a refrigerant |
Paper manufacturing |
321, 322 |
55 |
Use various chemicals in pulp and paper manufacturing |
Petroleum and coal products manufacturing |
324 |
156 |
Manufacture, process, store (mostly regulated flammable substances and flammable mixtures) |
Petroleum wholesalers |
4247 |
367 |
Store for sale (mostly regulated flammable substances and flammable mixtures) |
Utilities/water/wastewater |
221 (Non- government-owned water) |
519 |
Use chlorine (mostly for water treatment) and other chemicals |
Warehousing and storage |
493 |
1,110 |
Use (mostly ammonia) as a refrigerant |
Total |
|
11,740 |
|
Exhibit 3-2: Chart of Affected Facilities by Sector (2020).
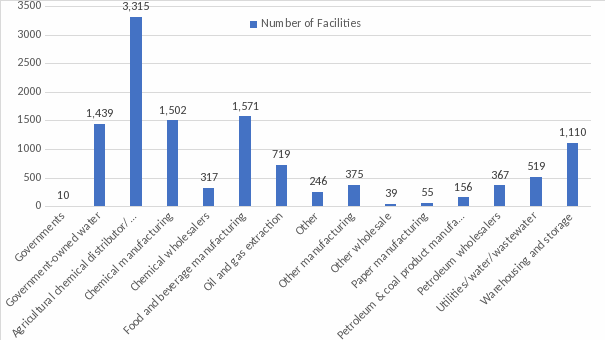
*Governments means NAICS 92 facilities involved in administration of environmental quality programs. Government-owned water means government-owned NAICS 2213 facilities involved in water, sewage, and other systems. Utilities/water/wastewater means NAICS 221 facilities (including utilities, water, and wastewater) except government-owned water.
The RMP rule applies to processes at facilities with regulated substances above threshold quantities. Processes are activities involving regulated substances including any use, storage, manufacturing, handling, or onsite movement of such substances, or combination of these activities. In general, the cost of implementing the rule provisions varies primarily by the complexity of the processes involved. Chemical manufacturers and petroleum refineries have more covered processes per facility and more complex issues to consider when evaluating hazards, designing exercises, conducting audits, investigating incidents, and explaining information to employees, responders, and the public compared to facilities that simply store or use chemicals in simple processes (e.g., refrigeration systems and water and waste treatment systems). For the purposes of the cost analysis, therefore, all facilities with NAICS 324 or 325 (petroleum and coal products manufacturing and chemical manufacturing) processes are considered complex; all other facilities are considered simple.
3.1.1 RMP Data
The facility universe analyzed in the RIA is based on the RMP Database as of August 1, 2021 and includes facilities active as of December 31, 2020.24 EPA used Microsoft Access queries and R code to pull and analyze the data. The RMP Database includes information from each RMP submission, and identifies the facility, its processes and their respective NAICS sectors and programs, any RMP-reportable accidents, as well as other information reported in the RMP.
To create the dataset of the universe of affected facilities, EPA selected from among the rows in the Facility ID table for each EPA Facility ID, the row with the highest Facility ID without a deregistration date and with a receipt date prior to 2021. This dataset was merged by Facility ID with the Processes table. To assign each facility a NAICS sector and program level, EPA matched each facility to a process corresponding to that facility, first from among the facility’s complex processes (NAICS 324 or 325) and then by its highest program level. So, if a facility has any complex processes, the facility was classified by the sector of one of those processes. Each facility was assigned the highest program level of any of its processes. So, if a facility has any Program 3 processes, the facility was classified as Program 3.
3.1.2 Manual Adjustments
While both government-owned and non-government-owned NAICS 2213 facilities perform the same functions, EPA expects that government-owned facilities will incur different burden hours than similar private facilities. Therefore, to better assess the impacts on government-owned versus non-government-owned NAICS 2213 facilities, EPA reviewed all facilities categorized as NAICS 2213 to distinguish between private and government ownership. EPA includes a category for government-owned NAICS 2213 facilities, which is separate from the category for facilities that report as NAICS 92 government administration.
For this final rule, EPA explored alternative data sources to classify NAICS 2213 facilities as private or government owned. EPA used its Facility Registry System (FRS) to crosswalk the data universal numbering system (DUNS) numbers (unique nine-digit business identifiers) reported by facilities in their RMP with their Water System ID for identification in EPA’s Safe Drinking Water Information System (SDWIS) dataset. SDWIS has information on registered water facilities and their ownership, so this crosswalk will allow EPA an alternative dataset to establish ownership type for water facilities in RMP. Completing this exercise only identified 731 facilities in SDWIS, a count that is lower than the number of facilities that identify as NAICS 2231 in their RMPs regardless of ownership. Reasons for the lower count could include DUNS numbers that are inaccurately reported in RMPs, not all DUNS numbers having matches to Water System IDs in FRS, and NAICS codes inaccurately reported in RMP submissions. Therefore, EPA relied on the manual adjustments performed during the proposed rule stage to more accurately identify the facilities that are NAICS 2213 privately-owned versus government-owned because searches using facility names provided a more accurate match.
3.1.2 Breakdowns Used in the Analysis
As explained in Section 1.1.1 Overview of the Risk Management Program, the RMP rule imposes different requirements on facilities based on program levels of the facility’s processes. Program 3 processes are those that are not eligible for Program 1 and are subject to the OSHA PSM standard or are in certain NAICS codes (refineries, a limited number of chemical manufacturers and pulp mills). Of the 4,769 processes in those NAICS codes, 4,595 processes were at facilities that self-reported that they are subject to OSHA PSM.
Exhibit 3-3: Number of Facilities by Program Level.
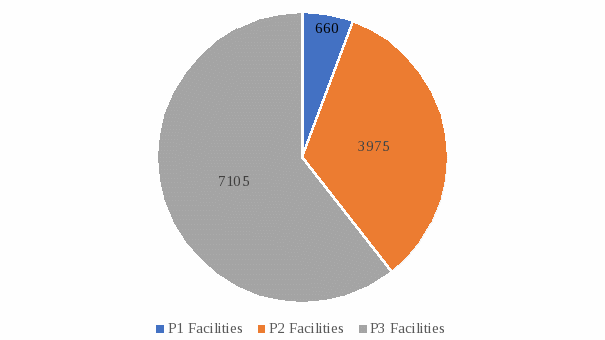
A portion of Program 2 facilities (765 of 3,975) are publicly-owned water/wastewater treatment facilities in States where OSHA (rather than the State) enforces OSHA rules.25 Because these facilities are publicly- owned, their processes are considered Program 2. This contrasts with those not under public ownership (which are Program 3), even though the processes are the same. The remaining Program 2 facilities are agricultural distribution facilities that store anhydrous ammonia, utilities that use aqueous ammonia and other facilities that store or use chemicals not subject to OSHA PSM.26
Exhibit 3-4 presents the number of facilities by sector and program level; publicly-owned water/wastewater treatment systems (NAICS 2213) are listed as government-owned water, other government facilities (NAICS 92) are listed as governments, and privately-owned and operated systems (NAICS 2213) are listed under utilities/water (NAICS 221).
Exhibit 3-4: Number of Facilities by Sector and Program Level (2020).
Sector |
NAICS Codes |
P1 |
P2 |
P3 |
Total |
Administration of environmental quality programs (i.e., governments) |
92 |
4 |
1 |
5 |
10 |
Water/sewage/other systems (i.e., government-owned water) |
2213 (Gov’t-owned) |
6 |
786 |
647 |
1,439 |
Agricultural chemical distributors/wholesalers |
11, 424 (except 4246, 4247) |
3 |
2,635 |
677 |
3,315 |
Chemical manufacturing |
325 |
54 |
63 |
1,385 |
1,502 |
Chemical wholesalers |
4246 |
8 |
86 |
223 |
317 |
Food and beverage manufacturing |
311, 312 |
3 |
3 |
1,565 |
1,571 |
Oil and gas extraction |
211 |
300 |
31 |
388 |
719 |
Other |
21, 23, 44, 45, 48, 491, 54, 55, 56, 61, 62, 71, 72, 81, 99 |
55 |
48 |
143 |
246 |
Other manufacturing |
313, 314, 315, 326, 327, 33 |
67 |
65 |
243 |
375 |
Other wholesale |
421, 422, 423 |
4 |
26 |
9 |
39 |
Paper manufacturing |
321, 322 |
1 |
1 |
53 |
55 |
Petroleum and coal products manufacturing |
324 |
13 |
1 |
142 |
156 |
Petroleum wholesalers |
4247 |
23 |
25 |
319 |
367 |
Utilities/ Water |
221 (non-Gov’t-owned water) |
40 |
129 |
350 |
519 |
Warehousing and storage |
493 |
79 |
75 |
956 |
1,110 |
Total |
All |
660 |
3,975 |
7,105 |
11,740 |
* Publicly-owned water/wastewater treatment systems (NAICS 2213) are listed as government-owned water. Other government facilities (NAICS 92) are listed as governments. And privately-owned and operated systems (NAICS 2213) are listed under utilities/water (NAICS 221).
3.1.2.1 Facilities Affected by the STAA Requirements
Applicability of the provision to conduct a STAA as part of the PHA is limited to processes in two sectors (NAICS 324 and 325). These sectors have a history of a high frequency of accidental releases and were selected because they represent complex processes that accounted for 43 percent of all RMP-reportable accidents from 2016 to 2020.27 These sectors also have more costly accidents relative to other sectors, amounting to about 80 percent of all accident costs from 2016 to 2020.
STAA is generally a process to analyze a facility’s current processes and practices to identify safer alternatives to the current process operations. These can range from small changes – such as upgrading valves – to large shifts such as substituting less toxic or volatile chemicals. Application of STAA for the final rule is divided into three activities, two of which are consistent with prior EPA rulemakings involving STAA (2017 amendments rule and 2019 reconsideration rule): the initial evaluation to identify alternatives and a practicability assessment to determine the costs and assess the reasonableness of implementing the change in light of other costs and programs. This final rule adds a third activity related to the implementation of measures identified from the STAA.
The requirement to conduct the initial evaluation of the STAA applies to all Program 3 facilities with processes in NAICS 324 and 325. This is an increase in the facilities affected by this provision from the proposed rule which proposed requiring an initial evaluation only of facilities with Program 3 regulated processes in NAICS 324 (petroleum and coal products manufacturing) and 325 (chemical manufacturing) located within one mile of another RMP-regulated facility process in NAICS 324 and 325, and all regulated facilities in NAICS 324 using HF in an alkylation unit. California regulations28 already require a hierarchy of controls analysis for refineries with HF unit processes, which is a similar, but more involved, evaluation of IST/ISD than required by the provision in this final rule. Likewise, Contra Costa County, California regulations and New Jersey regulations already require a review of IST/ISD by refineries and chemical facilities sufficient for compliance with the STAA initial and practicability assessment requirements. Therefore, EPA excludes the two California refineries with HF units, Contra Costa County’s four refineries and nine chemical manufacturing facilities, and New Jersey’s two refineries and 21 chemical manufacturing facilities from the analysis of initial evaluation costs in the final rule analysis. Exhibit 3-5 presents the number of processes and facilities by facility size for the two sectors subject to the initial evaluation of STAA.
Exhibit 3-5: Number of Processes and Facilities Subject to STAA Initial Evaluation
(Complex Program 3 facilities, excluding California refineries with HF units, Contra Costa County facilities, and New Jersey facilities) by Sector and HF Unit Presence (2020)
Sector |
NAICS |
Processes |
Facilities |
Processes per Facility |
Petroleum and Coal Products Manufacturing (no HF) |
324 |
863 |
92 |
9.4 |
Petroleum and Coal Products Manufacturing (with HF) |
324 |
672 |
42 |
16.0 |
Chemical Manufacturing |
325 |
2,799 |
1,355 |
2.1 |
Total |
|
4,363 |
1,489 |
2.9 |
The requirements to conduct a practicability assessment and implement safer technology apply only to Program 3 facilities with processes in NAICS 324 and 325 located within one mile of another facility with a NAICS 324 or 325 process, or facilities that have had an accident since their most recent process hazard analysis or have an HF alkylation unit process regardless of proximity to another NAICS 324 or 325-regulated facility. Compared to the proposed rule, this requirement adds some facilities based on having had an accident since their most recent process hazard analysis. As mentioned above, California refineries with HF units, Contra Costa County facilities, and New Jersey facilities already must meet or exceed STAA practicability assessment requirements. Therefore, EPA excluded the two California refineries with HF units, two refineries and seven chemical facilities in Contra Costa County, and two refineries and nine chemical facilities in New Jersey from the analysis of practicability assessment costs. EPA expects the cost of a STAA practicability assessment to vary by facility size, type, and number of processes. Exhibit 3-6 presents the number of processes and facilities by facility size for the two sectors subject to this provision.
Exhibit 3-6: Number of Processes and Facilities Subject to STAA Practicability Assessment
(Complex Program 3 facilities within one mile of another complex facility, with an accident,
or with an HF unit outside California, excluding Contra Costa County and New Jersey facilities) by Facility Size and Sector (2020).
Sector |
NAICS |
FTE |
Processes |
Facilities |
Processes per Facility |
Petroleum and Coal Products Manufacturing (no HF) |
324 |
0-99 |
22 |
11 |
2.0 |
Petroleum and Coal Products Manufacturing (no HF) |
324 |
100+ |
543 |
36 |
15.1 |
Petroleum and Coal Products Manufacturing (with HF) |
324 |
100+ |
672 |
42 |
16.0 |
Chemical Manufacturing |
325 |
0-99 |
417 |
293 |
1.4 |
Chemical Manufacturing |
325 |
100+ |
826 |
216 |
3.8 |
Total |
|
|
2,480 |
598 |
4.1 |
*Note: No refineries with 0-99 FTEs have an HF unit.
EPA anticipates that some facilities will conduct practicability studies to address alternatives considered in multiple initial evaluations, Therefore, EPA broke down the facilities by NAICS (324 or 325) to analyze the cost of the practicability assessment for the STAA provision. While the number of processes and facilities subject to the STAA provision may fluctuate over time and recognizing that the total number of RMP facilities has declined over the past two decades, EPA makes the simplifying assumption that the numbers of facilities subject to the provision are constant across all years in the analysis and equal to the number as of December 31, 2020.
By complying with the Contra Costa County’s more stringent requirement to implement IST/ISD measures, the county’s facilities will already meet or exceed the final rule’s STAA implementation requirement. Therefore, EPA excludes two refineries and seven chemical facilities in Contra Costa County from the analysis of STAA implementation costs. EPA expects the costs of implementation to vary by facility size, type, and number of processes. Exhibit 3-7 presents the number of processes and facilities by facility size for the two sectors subject to the provision.
Exhibit 3-7: Number of Processes and Facilities Subject to STAA Implementation
(Complex Program 3 facilities within one mile of another complex facility, with a recent accident,
or with an HF unit, excluding Contra Costa County facilities) by Facility Size and Sector (2020).
Sector |
NAICS |
FTE |
Processes |
Facilities |
Processes per Facility |
Petroleum and Coal Products Manufacturing (no HF) |
324 |
0-99 |
22 |
11 |
2.0 |
Petroleum and Coal Products Manufacturing (no HF) |
324 |
100+ |
557 |
37 |
15.1 |
Petroleum and Coal Products Manufacturing (with HF) |
324 |
100+ |
702 |
45 |
15.6 |
Chemical Manufacturing |
325 |
0-99 |
425 |
300 |
1.4 |
Chemical Manufacturing |
325 |
100+ |
830 |
218 |
3.8 |
Total |
|
|
2,536 |
611 |
4.2 |
*Note: No refineries with 0-99 FTEs have an HF unit. The 702 processes at the 45 refineries with HF units and 557 processes at 37 refineries with 100+ FTEs without HF units (excluding processes at two Contra Costa County refineries) add up to 1,259 processes at 82 refineries with 100+ FTEs (excluding processes at two Contra Costa County refineries).
3.1.2.2 Facility Universe Breakdown for Provisions that Apply After an RMP-Reportable Accident
The root cause analysis requirement will apply to P2 and P3 facilities as part of an incident investigation following an RMP-reportable accident. The third-party audit analysis requirement will apply to P2 and P3 facilities that have had an RMP-reportable accident since the last audit or when an implementing agency requires a third-party audit due to certain criteria at the facility.
For the purposes of this analysis, EPA analyzed only the RMP-reportable accidents, which are those accidents with reported impacts29, between 2016 and 2020. Because accidents are low probability but high-cost events, EPA used five-year annual averages to smooth over year-to-year fluctuations to estimate the number of facilities that EPA expects to conduct third-party audits and root cause analyses. EPA uses average annual accident estimates throughout the analysis. Exhibit 3-8 presents the five-year average annual number of RMP-reportable accidents for the 2016-2020 period by program level and facility sector. These annual average accidents for Program 2 and Program 3 facilities represent the numbers of annual root cause analyses EPA expects to be required under the final rule for RMP-reportable accidents. EPA estimates the cost of the root cause analysis to differ by type of facility, so the number of accidents is presented by facility type.
Exhibit 3-8: RMP-Reportable Accidents by Sector for Root Cause Analysis (2016-2020).
Average Annual RMP-Reportable Accidents by Program Levels and Facility Type (2016-2020) |
||||
|
Accidents |
|||
Program Level |
Simple (Non-gov’t) |
Complex 324 |
Complex 325 |
Government |
1 |
2.4 |
0.6 |
0.2 |
0.0 |
2 |
10.2 |
0.0 |
0.2 |
2.6 |
3 |
38.4 |
10.8 |
30.4 |
1.8 |
The third-party audit provision will apply to all P2 and P3 facilities that have had an accident or when an implementing agency requires it. Exhibit 3-9 presents the five-year average annual number of RMP-reportable accidents at P2 and P3 RMP facilities for the 2016-2020 period. These annual average accidents for Program 2 and Program 3 facilities represent the numbers of annual third-party audits for RMP-reportable accidents EPA expects to be required under the final rule. EPA expects the cost of a third-party audit to vary by facility size and type, and therefore separates the number of accidents by the facility’s number of FTEs, whether the facility has complex processes, and whether the facility is government-owned.
Exhibit 3-9: RMP Facilities with RMP-Reportable Accidents and Subject to Third-party Audits (2016-2020).
Average Annual RMP-Reportable Accidents at P2 and P3 Facilities 2016-2020 by Facility Type and Size |
|||
|
Facility Type |
||
FTEs |
Complex |
Simple (non-gov’t) |
Government |
0-19 |
1.6 |
15.4 |
1.8 |
20-99 |
7.6 |
8.0 |
1.2 |
100+ |
32.2 |
26.0 |
0.6 |
3.1.2.3 Universe Breakdown for Perimeter Monitors without Backup Power
The current RMP rule requires Program 2 facilities to perform a Hazard Review every five years and Program 3 facilities to perform a more formal PHA (relative to Program 2) every five years. EPA is amplifying power loss as a hazard in the regulatory text for PHAs/Hazard Reviews. The final rule will require facilities that already have installed perimeter monitors and have identified power loss as a major hazard but have not installed backup power for the monitors, to add backup power. Exhibit 3-10 provides the numbers of those facilities.
Exhibit 3-10: Facilities Requiring Backup Power for Perimeter Monitors by Program Level.
Program Level |
Number of Facilities |
P2 |
18 |
P3 |
374 |
3.1.3 Government Entities Affected by the Rule
The final rule will affect State and local government entities including entities that own RMP facilities and 2,473 LEPCs and 13 State- and county-delegated implementing agencies. The final rule will impose both direct and indirect costs. Direct costs are associated with activities required by RMP facilities owned by government entities. Indirect costs are associated with 1) RMP facilities owned by government entities, LEPCs, and delegated implementing agencies reviewing the final rule, and 2) LEPCs coordinating with facilities regarding community notifications.
Most government-owned facilities affected are water or wastewater treatment facilities, but some large swimming pools will be covered as well. Most of the government entities are cities, but the universe includes larger special districts (e.g., the Metropolitan Water District of Southern California) as well as some Federal facilities. Of the 1,111 government entities directly affected, 905 have one RMP facility, 125 have two RMP facilities, 43 have 3 facilities, 19 have 4 facilities, and 19 have 5 or more. Not all facilities owned by a government entity are located in the entity’s geographic region. There are fewer than 1,200 “parent” entities listed for publicly-owned systems. Because facilities do not always list the owner or they list variations of the owner’s name, it is not possible to develop an accurate estimate of the number of public entities affected by the rule. However, clearly, some larger cities and counties have many facilities. For example, the City of El Paso, Texas, owns and operates at least 16 facilities.
3.2 Number and Costs of Baseline Accidents
Owners or operators of facilities subject to the RMP rule must submit certain information on accidents that occurred over the previous five years if they resulted in onsite or offsite deaths, injuries, or property damage, or if they led to an evacuation, shelter-in-place event, or offsite environmental damage. Due to a lack of alternative data describing accident impacts more comprehensively, EPA reviewed the impacts reported to the RMP facility database for accidents during 2016 through 2020 (the last year with complete data) to develop baseline accident cost information.30 This five-year period was chosen to reflect the most recent trends regarding RMP accidents.
As a representation of baseline accident impacts and costs, these data are less than complete. Many accident costs are not required to be reported and thus are not reflected in the data. These are discussed in detail in Chapter 6 and include responder costs, transaction costs, property value reductions, unmonetized costs of evacuations and sheltering-in-place, the costs of potential health risks from exposure to toxic chemicals, and productivity losses, among others. In addition, some accidents that occurred at RMP facilities during the five-year period were not reported to EPA because the facility either closed after the accident, decommissioned the process, or removed the regulated substance from the process involved in the accident before it was required to submit a report to the RMP Database. For example, the Philadelphia Energy Solutions Refining and Marketing LLC facility in Philadelphia, PA had a fire and explosions in the PES Girard Point refinery HF alkylation unit on June 21, 2019, which resulted in the release of HF.31 This facility deregistered the affected process before the deadline for their subsequent RMP report. Due to the omission of such accidents and the omission of the cost categories listed in the beginning of this paragraph, the five-year baseline may under-represent the number and magnitude of RMP chemical accidents.
The RMP accident database contains information on the initiating event and contributing factors for each accident. The accident reporting instructions are that the impacts reported should be attributable to, or resulting from, direct exposure to toxic concentrations, radiant heat, or overpressures from accidental releases or from indirect consequences of a vapor cloud explosion from the accidental release. EPA reviewed RMP-reportable accidents based on industry information and other resources, such as reports by the CSB, to attempt to ensure that only impacts attributable to the release of a regulated substance were included in the analysis of baseline damages.
3.2.1 Two Damage Cases
To illustrate the nature of damages from accidents at RMP facilities, this section describes the impacts of two recent RMP-reportable accidents. To compile the following descriptions, EPA reviewed a variety of sources including media reports and final U.S CSB reports.
Philadelphia Energy Solutions (PES) Refinery Fire and Explosions
On Friday June 21, 2019, at approximately 4:00 AM, a release occurred at the Philadelphia Energy Solutions (PES) refinery in Philadelphia, Pennsylvania. Propane and toxic hydrofluoric acid (HF) vapor had escaped from a ruptured pipe in the PES refinery alkylation unit. The vapor found an ignition source and caused a fire and three explosions. Three fragments of a large vessel flew into the air with a 19-ton piece flying across the Schuylkill River and landing on its bank. Two other very large fragments landed on the refinery property. An estimated 5,239 pounds of HF were released during the incident, with 1,968 pounds contained with water spray within the unit and 3,271 pounds released into the atmosphere.32
HF is an extremely toxic chemical that is lethal at 30 ppm. HF can travel for miles and cause blindness, serious burns, permanent injuries, or death. It is covered by the RMP when more than 1,000 pounds are used in a process. The HF alkylation process at the PES Refinery was covered by the RMP Program at the time of the incident.
Three field operators were in the alkylation unit when the incident occurred; two were in a blast resistant local control room and one was just outside the room. Upon seeing the vapor cloud ignite soon after the release, one worker opened the door to the local control room, which blew the field operator back into the room and to the floor. Flames entered the doorway and then were extinguished. Ultimately, the operators opened the door and escaped. The fire was extinguished the following day, June 22.33 Hazardous materials crews remained on the scene until the incident was declared under control on September 24, 2019.34
A population of 117,000 lived within one mile of the PES refinery. Figure 3-1 shows the neighborhoods (including parts of downtown Philadelphia) within one, three, and five miles of the facility.35
Figure 3-1: The image is from an overhead satellite. The facility is outlined in blue. (Google, annotated by CSB) (Source: CSB. 2022a., p. 31)
The social costs of this incident included costs internal and external to the refinery. Costs were imposed on nearby residents, emergency responders, the city of Philadelphia, and refinery employees and owners, among others. While this list is not exhaustive, EPA has identified the following social costs:
Five workers experienced minor injuries.36
Nearby residents reported feeling their homes shake due to the explosions, saw black smoke, and smelled “terrible odors”.37
Costs were imposed on the city of Philadelphia and regional emergency responders. Fire fighters from the Philadelphia Fire Department and the local Industrial Firefighting Group responded to the incident, as well as a PES emergency response team. More than 120 firefighters and more than 50 pieces of equipment supplied by the Philadelphia Fire Department were used in the response. One firefighter reported breathing problems and received treatment. The Philadelphia Department of Public Health Air Management Services Lab collected and tested air samples. Hazardous materials crews were at the site through September 24. The following year in April 2020, bankrupt PES publicly stated that it would reimburse the city $1.8 million for the costs of the emergency response.38,39,40
Residents living east of the fire were asked to shelter in place starting at 5:41AM on the morning of the release. Shortly after, the shelter-in-place area was narrowed to nearby neighborhoods east, north, and south of the refinery. The order was lifted at 7:07AM.41
Portions of Interstate 76 and Philadelphia’s Platt Bridge were temporarily closed.42,43
The HF alkylation unit was severely damaged. Marsh Specialty (2022) estimated the total losses faced by the refinery from property damage, debris removal, and cleanup at $300 million at the time of the loss. This estimate does not include losses due to “business interruption, extra expenses, workforce injuries or fatalities, and any liability claims.” 44
In a state legislative committee hearing several weeks after the incident, there was testimony that an inspector from the Philadelphia Health Department measured an elevated level of HF gas near the refinery during the incident but dismissed the reading as false. Written testimony by a Drexel University environmental engineering professor asserted that the measurement was cause for additional protective measures for nearby residents and yet no actions such as requesting that residents shelter-in-place for a longer period, were taken. In response, the city’s health department testified that the gas meter was not properly calibrated and that both the refinery and the US EPA checked the test and confirmed that no HF was in the air.45
The refinery never re-opened and instead, declared bankruptcy and shut down. A proposal to redevelop the property as a warehousing and “life sciences” hub was recently being considered with assurances to the community of a safer facility.46,47,48
As a result of the incident, the CSB issued recommendations that EPA develop a program prioritizing and emphasizing inspections of HF alkylation units and that EPA revise the RMP program to require a safer technology and alternatives analysis of HF alkylation units to evaluate the practicability of inherently safer technologies.49
Texas Petroleum Chemical (TPC) Group Chemical Plant Explosions and Fire
On November 27, 2019, the TPC Group Chemical Plant Butadiene Unit in Port Neches, Texas experienced a series of explosions caused by a release of butadiene, a highly flammable chemical. The release was tied to an out-of-service pump in the butadiene process unit and an accumulation of popcorn polymer. The polymer expanded exponentially, increasing pressure, and ultimately caused piping to rupture. Once the butadiene was released, it ignited and caused an explosion followed by multiple subsequent explosions. The blast was felt up to 30 miles away. The explosions propelled process towers through the air that landed on site. Fires burned for weeks afterward.50
Butadiene is a hazardous chemical due not only to its flammability, but also its toxicity and reactivity. High concentrations of butadiene vapor can affect the central nervous system, in extreme cases potentially causing unconsciousness, respiratory depression, and death. It is covered by the RMP when 10,000 pounds or more are used in a process. The TPC Group Chemical Plant was covered by the RMP Program at the time of the incident.51
Three workers were present in the butadiene process unit at 12:54 AM on November 27, 2019, two of whom witnessed a pipe rupture that allowed butadiene to escape. They exited the unit immediately following the release of butadiene. At 12:56 AM, the vapor cloud ignited, causing an explosion that caused severe damage to piping and equipment in the unit and multiple fires. Known subsequent explosions occurred at 2:40 AM and at 1:48 PM. Workers manually isolated areas of the facility, containing initial fires. Smaller contained fires burned for more than a month. On January 4, 2020, the TPC Port Neches Operation Incident Command reported that all fires were extinguished.52
Approximately 18,000 people lived within one mile of the TPC Group Chemical facility. Figure 3-2 shows the neighborhoods within one, three, and five miles from the facility.53
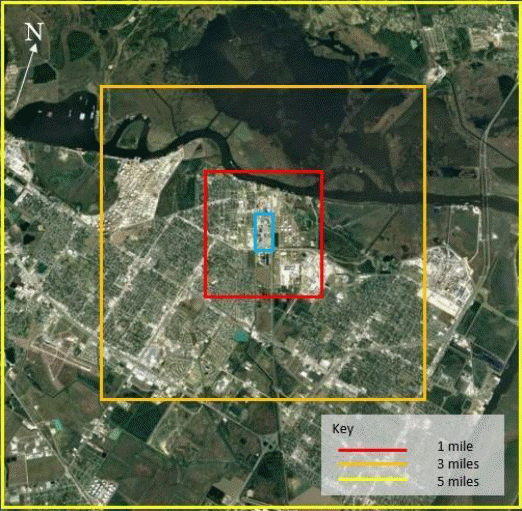
Figure 3-2: The image is from an overhead satellite. The facility is outlined in blue. (Google, annotated by CSB) (Source: CSB 2022c, p. 17)
The social costs of the incident included damages sustained by the nearby community as well as the facility itself. Affected parties included workers; nearby residents, businesses, and schools; ships and other users of the Sabine-Neches Waterway; emergency responders; Jefferson County; and facility owners, among others. EPA has identified the following, not necessarily exhaustive, list of social costs:
Federal EPA personnel responded.56
Firefighters from local agencies including the Port Neches Fire Department and from industry including TPC Port Neches Operations fire team, sprayed water on the blaze to keep nearby equipment cool until the fire “burned itself out.”57,58
Texas Commission on Environmental Quality responded to the initial explosion and conducted handheld air monitoring. They stated that volatile organic compounds were released and could be harmful in high concentrations.59
Three workers (two TPC employees and one contractor) were briefly hospitalized and experienced minor injuries.60
Five nearby residents reported injuries mostly related to shattered glass.61,62
A mandatory evacuation was ordered at 3:28 pm on the day of the incident for a four-mile radius around the facility, affecting over 50,000 residents of the cities of Port Neches, Groves, Nederland, and Port Arthur. This was the afternoon prior to Thanksgiving Day - Thursday, November 28th. There was also a curfew set between 10PM and 6AM. Both orders were lifted on November 29th.63,64,65 Prior to the evacuation orders, shelter-in-place orders had been issued for a smaller area near the plant.66
State law enforcement officers enforced the mandatory evacuation and curfew.67
Residents were warned not to touch any debris that they might discover as it could be from the explosions and could contain asbestos and/or be potentially contaminated. Residents were asked to contact TPC who would test it, remove it and dispose of it.68
The explosion reduced the use of the Sabine-Neches Waterway which carries the third largest volume of cargo in the nation. The US Coast Guard issued a Marine Safety Information Bulletin on Nov 27th that established a safety zone on the river from which vessels and people were prohibited from entering without special permission. The prohibition ran from Nov 27th to Nov 29th.69
The large plumes of smoke from the fire were potential sources of respiratory irritation according to Troy Monk, TPC’s safety director.70
Local, state, and Red Cross officials opened shelters and sent in supplies for the evacuees.71
Port Neches schools did not reopen as scheduled following their Thanksgiving vacation because they were cleaning, inspecting, and repairing buildings and having debris removed. School opening was delayed by a week, from Dec 2nd to Dec 9th.72
A shelter-in-place was ordered at 6PM on Dec 4th by the Port Neches Fire Chief for the 50,000 residents of the City of Port Neches. This was followed by a voluntary evacuation order. The orders were in response to concerns over air quality after elevated levels of butadiene were detected. Health effects of concern included dizziness, nausea, headaches, or throat and eye irritation. Both orders were lifted on December 5th.73,74
Environmental damage included fish or animal kills, water contamination and soil contamination.75
Onsite property damage was estimated at $380m to $450m.76,77
Offsite property damage occurred to nearby homes and businesses, including blown out windows and doors and ripped -off roofing shingles of nearby homes and other buildings. Damages were estimated at $150m.78,79
During the incident, Brent Roy of the United Steelworkers Union, which represented workers in the facility, stated that if the tanks closest to the fire overheated, they would feed the ongoing fire and that other nearby tanks posed yet more serious threats. The direction of the wind affected that threat.80 Jeff Branick of the Jefferson County Office of Emergency Management explained that the blast that propelled a tower “like a missile” led to concerns that if another large piece of debris were to go into the facility’s tank farm, the results could lead to catastrophe, hence the order to evacuate.81
On June 1, 2022, TPC filed for Chapter 11 bankruptcy.82 The processing units are no longer operating and instead the facility is in operation as a terminal.83
3.2.2 Onsite RMP-reportable Accidents in the Five-year Baseline
Exhibit 3-11 presents the five-year data (2016 to 2020), by year, for onsite impacts of accidents. Deaths and injuries are either to employees, public responders, or the public.
Exhibit 3-11: Onsite Impacts by Year: 2016-2020.
Year |
Impact Accidents |
Employee Deaths |
Employee Injuries |
Public Responder Deaths |
Public Responder Injuries |
Public Injuries |
Public Deaths |
Value of Property Damage (millions, 2022 dollars) |
2016 |
127 |
4 |
136 |
0 |
3 |
0 |
0 |
$505.15 |
2017 |
109 |
3 |
108 |
6 |
1 |
20 |
0 |
$262.24 |
2018 |
92 |
2 |
140 |
0 |
0 |
0 |
0 |
$862.33 |
2019 |
100 |
1 |
110 |
0 |
1 |
0 |
0 |
$611.00 |
2020 |
60 |
2 |
56 |
0 |
0 |
0 |
0 |
$32.16 |
Annual Average |
97.6 |
2.4 |
110 |
1.2 |
1 |
4 |
0 |
$454.58 |
Total RMP-Reportable |
488 |
12 |
550 |
6 |
5 |
20 |
0 |
$2,272.89 |
* Property damage values were obtained from the EPA RMP Database of self-reported information from regulated facility owners or operators and adjusted to 2022 dollars. All other values were also obtained from the EPA RMP Database.
Twelve onsite employee fatalities occurred over the five-year analysis period, which is an annual average of 2.4 employee fatalities. Each accident with a fatality resulted in a single employee fatality, while the 6 public responder fatalities were from one accident. No deaths among the public occurred during this five-year period.
The current RMP rule does not require facilities to disaggregate reported onsite injuries by severity. However, under the RMP accident history requirements, an RMP-reportable accident injury means “any effect on a human that results either from direct exposure to toxic concentration; radiant heat; or overpressure from accidental releases or from the direct consequences of a vapor cloud explosion (such as flying glass, debris, or other projectiles) from an accidental release and that requires medical treatment or hospitalization.”
Medical treatment means “treatment, other than first aid, administered by a physician or registered professional personnel under standing orders from a physician” (40 CFR 68.3). For some accidents for which accident reports could be located from other sources, serious injuries (i.e., those requiring hospitalization) ranged from none (e.g., SGL Carbon LLC July 2017 and East Dubuque Nitrogen Fertilizers June 2017 where all workers were treated and released) to at least 29 reported injuries (Tyson Fresh Meats 2018); in the largest of that sample of accidents (Valero Benicia Refinery 2017), 68 civilians received medical treatment.84 Injuries described in reports varied from those that were treated with first aid alone at the scene, to severe burns and disability. Although the RMP rule limits RMP-reportable injuries to those that require medical treatment other than first aid, in some accidents, minor injuries treated with first aid have been reported. Onsite property damage reports include a variety of damages including to buildings, machinery, equipment and other plant infrastructure. Approximately $0.4 billion of the $2.3 billion in property damage reported occurred in accidents that had no other RMP-reportable impacts onsite or offsite.
3.2.3 Offsite RMP-Reportable Impacts in the Five-year Baseline
Exhibit 3-12 presents the reported offsite impacts for the baseline including members of the public or emergency responders who were injured or killed offsite, were required to evacuate or shelter-in-place, or who incurred property damage as a result of the accidents. Of the 488 RMP-reportable accidents, 133 had RMP-reportable offsite impacts.
Exhibit 3-12: Offsite Impacts by Year: 2016-2020.
Year |
Impact Accidents with Offsite Impacts |
Number of Deaths |
Hospital Visits |
People Undergoing other Medical Treatment |
Number of People Evacuated |
Number of People Sheltered in Place |
Value of Property Damage (millions, 2022 dollars) |
2016 |
27 |
0 |
11 |
3 |
1,668 |
13,430 |
$4.67 |
2017 |
31 |
0 |
6 |
94 |
7,866 |
32,011 |
$0.06 |
2018 |
30 |
0 |
4 |
19 |
3,942 |
469 |
$0.35 |
2019 |
27 |
0 |
6 |
15 |
51,002 |
38,284 |
$173.33 |
2020 |
18 |
0 |
4 |
3 |
261 |
1,614 |
$0.14 |
Annual Average |
26.6 |
0 |
6.2 |
26.8 |
12,948 |
17,162 |
$35.71 |
Total RMP-Reportable |
133 |
0 |
31 |
134 |
64,739 |
85,808 |
$178.55 |
In the five-year baseline, the total number of offsite individuals evacuated as well as the value of property damage are skewed by a single accident in 2019 in Port Neches, TX, the second damage case described above in Section 3.2.1. Two years show high numbers for sheltering-in-place. Two accidents in 2019 with approximately 12,000 people sheltering apiece accounted for the high 2019 number. The accident at Benicia, CA in 2017 accounted for 28,000 of that year’s shelter-in-place numbers as well.85
3.2.4 Distribution of Accident Impacts Across Sectors
In the five-year baseline, fatal accidents occurred primarily in the petroleum refining and chemical manufacturing sectors, which accounted for eight of the 12 employee fatalities. The number of accidents per facility is highest in these three sectors. Exhibit 3-13 presents a breakdown of RMP-reportable accidents, deaths, and injuries by sector, including accidents with no impacts. Accidents with no impacts are included in the exhibit because RMP requirements can also help prevent and mitigate non-RMP-reportable accidents (see Chapter 6). The food and beverage manufacturers and warehouses are generally ammonia refrigeration systems, and the agricultural chemical distributors store ammonia for use as a fertilizer. The right-most column of Exhibit 3-13 shows the number of facilities by NAICS code that had more than one RMP-reportable accident between 2016 and 2020.
Exhibit 3-13: Number of RMP-reportable and Non-reportable Accidents,
and Numbers of Fatalities and Injuries by Sector, 2016-2020.
Sector (NAICS) |
Total 5-Year Accidents (Reportable and Non-Reportable) |
Average Number of Accidents per Facility |
Onsite Worker or Public Responder Fatalities |
Onsite Worker or Public Responder Injuries |
Onsite Public Injuries |
Number of Facilities with >1 Accident |
324: Petroleum and Coal Products Manufacturing |
137 |
0.88 |
2 |
59 |
0 |
14 |
325: Chemical Manufacturing |
316 |
0.21 |
2 |
177 |
0 |
29 |
311, 312: Food/Beverage Manufacturers |
158 |
0.10 |
6 |
147 |
0 |
3 |
322: Paper Manufacturing |
38 |
0.70 |
0 |
30 |
0 |
5 |
313, 314, 315, 326, 327, 33: Other Manufacturing |
45 |
0.12 |
1 |
19 |
0 |
6 |
11, 42491: Agriculture and Agricultural Chemical Wholesale |
102 |
0.03 |
0 |
17 |
0 |
3 |
4246: Chemical Wholesale |
36 |
0.11 |
0 |
10 |
0 |
2 |
4247: Petroleum Wholesale |
7 |
0.02 |
0 |
1 |
0 |
0 |
4244, 4245: Other Agricultural Wholesale |
7 |
0.03 |
0 |
1 |
0 |
0 |
493: Warehouse |
33 |
0.03 |
2 |
28 |
0 |
2 |
211: Oil/Gas exploration |
45 |
0.03 |
0 |
22 |
20 |
3 |
2213: Water/POTW |
81 |
0.11 |
4 |
13 |
0 |
6 |
2211, 2212: Electric and Gas Utilities |
5 |
0.04 |
1 |
2 |
0 |
0 |
Other |
143 |
0.06 |
0 |
29 |
0 |
0 |
Total |
1,023 |
0.09 |
18 |
555 |
20 |
70* |
* Adding Number of Facilities with >1 Accident for each sector equals 73, which exceeds the Total of 70 because some facilities were counted in multiple sectors.
3.2.5 Monetized Costs of Chemical Accidents
While the RMP Database provides values of property damage, it includes only counts of fatalities, non-fatal injuries, evacuations, and the number of people required to shelter-in-place. EPA estimated the values of these impacts to better understand the magnitude of reported accident impacts during the five-year baseline. To monetize fatalities, EPA applied the value of statistical life (VSL) recommended in EPA’s Guidelines for Preparing Economic Analysis (2010) (hereafter the Guidelines). For non-fatal injuries, EPA gathered data on hospital costs from the U.S. Department of Health & Human Services (HHS) Agency for Healthcare and Research and Quality Data (2020).86 Finally, for evacuations and shelter-in-place events, a value of labor time was estimated using data from the Bureau of Labor Statistics (BLS) (2022) and the U.S. Census (2022).87
3.2.5.1 Fatalities and Injuries
Fatalities were valued using the Guideline’s VSL of $7.4 million (2006 dollars) inflated to $10.4 million (2022 dollars). In principle, valuation of injuries includes multiple components. The Guidelines explain that the willingness to pay (WTP) to reduce the risk of experiencing an illness is the preferred measure of value for morbidity effects and cites Freeman (2003). As described in Freeman (2003), WTP consists of four components:
“Averting costs” to reduce the risk of illness.
“Mitigating costs” for treatments such as medical care and medication.
Indirect costs such as lost time from paid work, maintaining a home, and pursuing leisure activities.
Less easily measured, but equally real, costs of discomfort, anxiety, pain, and suffering88.
EPA had available data to estimate only the components identified in the second bullet, “Mitigating costs” for treatments such as medical care and medication. The cost categories in bullets 1, 3 and 4 are not included in EPA’s estimates of the value of injuries and therefore, may result in an underestimate of monetized accident costs. To value onsite injuries and offsite hospitalizations, the analysis reviewed the accident data to determine the percentages of the accidents that involved explosions and fires, and the release of toxics. The analysis then transferred the HHS data on the current costs for hospitalizations for poisoning (other than by medicinal substances) to injuries from toxic releases; for burns to injuries from fire; and for open wounds, to injuries from explosions. Because the costs for open wounds and poisoning were close ($49,430 and $44,820, respectively), the analysis used the average of these two values for onsite injuries from toxic releases and explosions; the cost for burns was $96,000. The analysis then created a weighted value of an onsite injury based on the percentage of burn-related injury versus other impacts (fires were involved in 8 percent of the injury incidents; open wounds were assumed to be the remainder of injury costs). This weighted value was approximately $50,000.
The analysis used the cost of hospitalization for poisoning (rounded to $45,000) for hospitalizations associated with offsite injuries because in the five-year baseline, these injuries were usually related to exposure to toxic chemicals. For medical treatment other than hospitalization (offsite), the analysis used an estimate of $1,000, which is above the $750 per person paid to the 14,000 people who sought medical treatment from the Richmond refinery fire, and below the average emergency room charge.89 Offsite treatments that do not involve hospitalization for exposure to fumes usually involve relatively low-cost treatments (e.g., oxygen, eye washes, skin washes).
The $50,000 total cost estimate for onsite injuries has several limitations. As mentioned above for all injuries, hospital costs are only one of four categories of social costs incurred. Due to a lack of data, costs could not be estimated for the other categories which could be substantial including the value of lost time from work and the value of discomfort, anxiety, pain and suffering. However, as an estimate of hospital costs, it is an over-estimate for an unknown percentage of the injuries onsite that did not require hospitalization and may not involve any medical costs or for injuries and toxic exposures that led to hospitalization and were minor enough that the person was released within a day (the HHS cost estimates are based on a 3-day stay for poisonings and injuries and an 8-day stay for burns). In the opposite direction, however, the $50,000 cost estimate is an underestimate for those workers who were severely injured and for whom the medical costs will certainly have involved lengthy hospital stays or more than hospitalization, e.g., costs associated with further medical treatment as well as physical and occupational therapy or nursing home care.
3.2.5.2 Evacuations and Shelter-in-Place Events
The five-year baseline data do not provide any basis for estimating the time involved in the average evacuation or sheltering-in-place. EPA assumes sheltering-in-place is less disruptive than an evacuation. To estimate costs for evacuations and sheltering in place, the analysis assumed the value of time of $36.66 per hour,90 that sheltering required 4 hours91, and that evacuations required 8 hours.92
3.2.5.3 Summary of Monetized Accident Impacts
The dominant monetized element of RMP facility RMP-reportable accidents for the most recent 5 years of data is onsite property damage, followed by offsite property damage. The total monetized five-year cost of the accidents is around $2.7 billion. Of that amount, $2.5 billion was caused by onsite impacts largely attributed to property damage and fatalities. The offsite property damage derived largely from the damage case described above that occurred in Port Neches, TX in 2019 causing $153 million of offsite property damage.
Exhibit 3-14: Average Impacts per Year and Accident: 2016-2020.
|
5-Year Total |
Average/Year |
Average/Accident |
Onsite |
|||
Fatalities |
18 |
3.6 |
0.037 |
Injuries |
575 |
115 |
1.178 |
Property Damage |
$2.3 billion |
$454.6 million |
$4.66 million |
Offsite |
|||
Fatalities |
0 |
0 |
0 |
Hospitalizations |
31 |
6.2 |
0.064 |
Medical Treatment |
134 |
26.8 |
0.275 |
Evacuations |
64,739 |
12,948 |
132.662 |
Sheltering in Place |
85,808 |
17,162 |
175.836 |
Property Damage |
$179 million |
$35.7 million |
$0.37 million |
The monetized cost of accidents shown in Exhibit 3-15 for the period 2016 to 2020 should be viewed in the context of monetized costs of RMP accidents for other time periods. EPA analyses for two prior RMP rulemakings, the 2017 amendments rule and the 2019 reconsideration rule, estimated monetized baseline damages using the same categories as were used for Exhibit 3-15. For those analyses, EPA estimated monetized baseline damages for the 10-year period from 2004 to 2013 and for the three-year period from 2014 to 2016. EPA has re-estimated unit damage costs for these prior time periods.93 The new estimates apply the same set of assumptions used for the current final rule analysis. However, the underlying RMP data on property damages and reportable accidents is subject to being updated with more recent data years after an accident has occurred. The higher values for the monetized costs of accidents from 2004 to 2013 and 2014 to 2016 compared to the 2017 amendments rule and 2019 reconsideration rule reflect these changes in data. Most notably, subsequent adjustments to the value of property damages primarily drove the higher costs of accidents. The estimates for the two prior time horizons are presented in 2022 dollars and appear in Exhibit 3-16.94
Exhibit 3-15: Monetized Accident Costs including Average per Year and per Accident for
2016-2020 (millions, 2022 dollars).
|
Unit Value |
5-Year Total |
Average/Year |
Average/Accident |
Median/Accident |
Onsite |
|||||
Fatalities |
$10.4 |
$187.9 |
$37.57 |
$0.38 |
$0.00 |
Injuries |
$0.050 |
$28.75 |
$5.75 |
$0.06 |
$0.05 |
Property Damage |
|
$2,273 |
$454.58 |
$4.66 |
$0.00 |
Onsite Total |
|
$2,489.49 |
$497.90 |
$5.10 |
$0.05 |
Offsite |
|||||
Fatalities |
$10.4 |
$0.00 |
$0.00 |
$0.00 |
$0.00 |
Hospitalizations |
$0.045 |
$1.40 |
$0.28 |
$0.0029 |
$0.00 |
Medical Treatment |
$0.001 |
$0.13 |
$0.03 |
$0.0003 |
$0.00 |
Evacuations* |
$0.000 |
$18.99 |
$3.80 |
$0.0389 |
$0.00 |
Sheltering in Place* |
$0.000 |
$12.58 |
$2.52 |
$0.0258 |
$0.00 |
Property Damage |
|
$178.55 |
$35.71 |
$0.37 |
$0.00 |
Offsite Total |
|
$211.66 |
$42.33 |
$0.43 |
$0.00 |
Total |
|
$2,701.14 |
$540.23 |
$5.54 |
$0.05 |
*The unit values (cost per person) are $293 for evacuations and $147 for sheltering-in place, so when presented in rounded $ millions, the value in the table is zero.
** Large offsite property damage is influenced by high offsite consequences reported from the 2019 TPC Group Explosion and Fire in Port Neches, TX (see: https://www.csb.gov/tpc-group-explosion-and-fire/ .
Exhibit 3-16: Monetized Accident Costs including Average per Year and per Accident
for 2004-2013 and 2014-2016 (millions, 2022 dollars)
|
2004-2013 |
2014-2016 |
|||||
|
Unit Value |
10-Year Total |
Average per Year |
Average per Accident |
3-Year Total |
Average per Year |
Average per Accident |
Onsite |
|||||||
Fatalities |
$10.4 |
$741.0 |
$74.1 |
$0.4 |
$135.7 |
$45.2 |
$0.33 |
Injuries |
$0.05 |
$109.9 |
$11.0 |
$0.07 |
$33.2 |
$11.1 |
$0.08 |
Property Damage |
|
$3,767.9 |
$376.8 |
$2.3 |
$1,136.9 |
$379.0 |
$2.7 |
Onsite Total |
|
$4,618.7 |
$461.9 |
$2.8 |
$1,305.8 |
$435.3 |
$3.1 |
Offsite |
|||||||
Fatalities |
$10.4 |
$10.4 |
$1.0 |
$0.006 |
$0 |
$0 |
$0 |
Hospitalizations |
$0.045 |
$10.3 |
$1.0 |
$0.006 |
$1.1 |
$0.4 |
$0.003 |
Medical Treatment |
$0.001 |
$15.9 |
$1.59 |
$0.010 |
$0.03 |
$0.01 |
$0.0001 |
Evacuations* |
$0.0 |
$11.6 |
$1.2 |
$0.007 |
$2.2 |
$0.7 |
$0.01 |
Sheltering-in- Place* |
$0.0 |
$60.4 |
$6.0 |
$0.04 |
$5.7 |
$1.9 |
$0.01 |
Property Damage |
|
$15.1 |
$1.5 |
$0.01 |
$10.4 |
$3.5 |
$0.0 |
Offsite Total |
|
$113.3 |
$11.3 |
$0.07 |
$19.4 |
$6.5 |
$0.0 |
Total |
|
$4,732.0 |
$473.2 |
$2.9 |
$1,325.1 |
$441.7 |
|
*The unit value is $293 for evacuations and $147 for sheltering in place, so expressed in rounded millions, the value in the table is $0.
The estimates of monetized accident damages for the two prior time periods are somewhat lower than for the most recent five-year period; for example, the average per year is $473.2 million for 2004 to 2013 and is $441.7 million for 2014 to 2016. The average per accident is $2.9 million for 2004 to 2013 and is $3.2 million for 2014 to 2016. In total over the 2004 to 2020 time period the average per year is $482.8 and the average per accident is $3.2 million. Contributing factors to the higher values appearing in Exhibit 3-15 estimated for the most recent five-year period are the high property damage and number of evacuations from the TPC Group Chemical Plant explosion and fire in Port Neches, TX in 2019.
3.2.6 Unquantified and Unmonetized Baseline Damages
Building on the accident impacts required to be reported by RMP facilities, EPA has monetized some of the baseline costs of chemical accidents. However, there are many other important impact and cost categories of accidents that EPA was unable to monetize. These include:
Damages related to major catastrophic releases
Potential health risks from exposure to toxic chemicals
Lost productivity at affected facilities
Emergency response costs
Transactions costs from potential subsequent legal battles
Property value losses in nearby neighborhoods
Environmental damage
Unquantified costs of evacuation and sheltering-in-place events.
Each of the categories listed above is explained in detail in Chapter 6, Section 6.2.
3.3 Limitations
While it is standard practice for EPA to assume that every facility subject to the RMP rule has registered with EPA and filed an RMP, EPA recognizes that assumption may not be accurate. EPA and delegated implementing agencies search for and occasionally identify RMP facilities that have failed to submit RMPs. Historically, relatively few of these “non-filers” have been found, but EPA is unable to determine the full extent of non-compliance. In addition, EPA recognizes that the RMP Database may include facilities that are no longer operational after December 31, 2020, but failed to follow the requirements to deregister.
The numbers of RMP facilities and processes are expected to change over the period of analysis because firms will grow, shrink, close, or open in the near or distant future. Despite these expected changes and other limitations, the analysis relies on the number and nature of RMP facilities and processes in the RMP Database as of December 31, 2020, using the August 1, 2021, RMP Database as a constant estimate of future RMP facilities/processes. EPA selected this database version to reflect the most recent information about RMP facility numbers and characteristics and because facilities are required to report accidents within six months; therefore, a cutoff date of August 1, 2021, should include all facilities reporting accidents as of December 31, 2020. However, some facilities may have not reported their accidents as they are required to do.
CHAPTER 4: Costs of Final Rule Revisions
This chapter outlines the assumptions EPA used to estimate the incremental costs of the final rule revisions to the RMP. This RIA does not estimate the baseline costs incurred to comply with the current RMP regulations. Baseline costs are not necessary to estimate incremental costs for this rule. Baseline costs include costs to comply with the current RMP regulations and have been accounted for in previous RMP RIAs and therefore have not been repeated here.95
The Agency has quantified and monetized incremental costs of the final SCCAP rule where possible. The time frame of analysis is 10 years. As several of the rule elements are required once in a five-year period, EPA included a time span long enough to capture two five-year periods. Specific cost assumptions are outlined for each rule provision below. The analysis employs a model facility approach in which representative facility categories were developed to reflect a variety of features expected to influence costs (e.g., process complexity, number of FTEs, etc.). Cost assumptions were developed for each model facility type and addressed factors such as number of staff hours involved in implementing a provision, equipment costs, and fixed costs for contractor involvement. Prevailing wage rates were used to estimate per facility costs for rule provisions. With a model facility approach, the unit cost estimates represent averages that cover a wide variation in expected costs even within a single sector.
4.1 Analysis Baseline
This analysis estimates only the incremental impacts of the final rule for those provisions that impose new costs. Components of the Hazards Evaluation Amplification and the Emergency Response provisions impose no new burden because they codify existing industry practice or RMP requirements. The final rule revises regulatory text for Program 2 and Program 3 hazard evaluations to explicitly address both natural hazards and standby or emergency power systems. The revised regulatory text for Program 2 and Program 3 hazard evaluations also explicitly defines stationary source siting as inclusive of the placement of processes, equipment, and buildings within the facility, the hazards posed by proximate facilities, and the accidental release consequences posed by proximity to the public and public receptors. These requirements reflect existing industry practice, and therefore, EPA assumes that these hazard evaluation amplifications will impose no new costs.
The final rule also revises emergency response provisions. The additional provision revises regulatory text to require facilities to develop and implement, as necessary, procedures for informing the public and the appropriate emergency response agencies about accidental releases of RMP-regulated substances. Under current regulatory requirements, responding and non-responding facilities should already have mechanisms and procedures in place to notify the public through their emergency response programs or plans, or through coordination with local responders. Therefore, EPA does not estimate any new costs associated with these components of the emergency response provisions. EPA does quantify the cost to ensure that a community notification system is in place to warn the public within the area threatened by a release. Further discussion can be found later in this chapter.
4.2 Wage Rates
The Agency used the BLS May 2022 Occupational Employment and Wage Statistics (OEWS)96 to construct a weighted wage rate for different occupational categories that will be affected by the final rule. For all rule provisions, labor hours were assumed to be distributed across six general labor categories: Management, Corporate Management, Attorneys, Engineers, Production Staff, and Local Responders. The analysis updates wages rates used in the proposed rule RIA which were based on BLS May 2020 OEWS. The weighted wage rates for complex facilities (NAICS 324 and 325) were estimated separately from simple facilities because wages paid by these facilities are higher than in wholesale and government sectors, which dominate the simple facilities category. For each of the NAICS codes representing sectors in the simple facilities category that are affected by the rule provisions (Food and Beverage, Agricultural Facilities, etc.), standardized BLS Occupation Titles were identified to correspond to the six general labor categories. BLS wages were then adjusted to account for fringe benefits and overhead. Fringe benefits include payments to cover items such as paid leave, supplemental pay, insurance, and retirement. Overhead includes resources to cover items such as office space and administrative personnel issues. Applying the December 2022 national average benefit ratio of 0.4597 and an overhead cost ratio not inclusive of benefits of 0.3, the Agency multiplied the wage rates for each BLS Occupation Title by a factor of 1.75 to create a fully loaded wage rate.98 After loaded wage rates were established for each industry, they were combined to form a weighted average based on the prominence of each industry within its universe of facilities, either simple or complex. Exhibit 4-1 presents the wage rates EPA used in the analysis.
Exhibit 4-1: Weighted-Average Loaded Hourly Wage Rates (2022 Dollars).
Labor Category |
Simple Facilities |
Complex Facilities |
Management |
$110.70 |
$137.52 |
Corporate Management |
$102.02 |
$136.70 |
Attorneys |
$150.79 |
$205.84 |
Engineers |
$74.33 |
$99.12 |
Production Staff |
$43.21 |
$66.71 |
Local Responders |
$72.30 |
$72.30 |
Source: https://www.bls.gov/oes/2022/may/oes_nat.htm and http://www.bls.gov/news.release/ecec.nr0.htm.
4.3 Rule Familiarization
RMP facility staff will spend time to review the final rule and determine which provisions apply to their facility. Most of the final rule provisions revise current requirements rather than introducing completely new provisions. Many provisions apply only after an RMP-reportable accident, e.g., root cause analysis. Still Others, such as the STAA, are expected to take time to understand; although they apply to a limited number of facilities. As such, EPA has adopted a methodology that assigns labor hour estimates based on facility types to reflect that certain facilities will have to dedicate more time to familiarize themselves with rule provisions that apply only to them.
EPA projects that the time facilities spend to review the final rule and determine which provisions apply will be consistent with the time they spent to review the 2017 amendments rule because the number and content of provisions are similar. EPA projects that all facilities with simple processes will need five hours to review the rule as will the few complex facilities in Program 1 and Program 2. Complex facilities in Program 3 are projected to spend 292 hours reviewing the rule. LEPCs and delegated State and local implementing agencies are projected to spend five hours reviewing the rule. The hours for delegated State and county implementing agencies are increased to five hours from four in the proposed rule to create consistency with LEPCs. Exhibit 4-2 presents the unit burden hour and cost estimates for rule familiarization.
Exhibit 4-2: Estimated Unit Burden and Cost for Rule Familiarization (2022 Dollars).
Facility Type |
Labor Hours |
Facility Cost |
||||
Managers |
Corporate Mgmt. |
Attorneys |
Engineers |
Production |
||
Simple |
5 |
0 |
0 |
0 |
0 |
$553 |
P1 and P2: Complex |
5 |
0 |
0 |
0 |
0 |
$688 |
P3: Complex |
20 |
48 |
12 |
87 |
125 |
$28,744 |
LEPCs |
5 |
0 |
0 |
0 |
0 |
$553 |
Delegated Implementing Agencies |
5 |
0 |
0 |
0 |
0 |
$553 |
4.4 Prevention Program Provisions
4.4.1 STAA: Initial Evaluation and Practicability Assessment
STAA is generally a process to analyze a facility’s current processes and practices to determine whether there are safer alternatives to the current operating practices. These can range from small changes – such as upgrading valves – to large changes such replacing toxic or volatile chemicals with less toxic or volatile substitutes.
The final rule and this RIA divide the STAA process into three parts:
The initial evaluation to identify and document alternatives.
A practicability assessment to determine the practicability of implementing inherently safer alternatives identified through the initial evaluation and to assess the reasonableness of implementing the change.
Implementation of at least one passive measure, or an inherently safer technology or design, or a combination of active and procedural measures equivalent to or greater than the risk reduction of a passive measure.
The STAA provision will require facilities with Program 3 regulated processes in NAICS 324 (petroleum and coal products manufacturing) and 325 (chemical manufacturing) to conduct the initial evaluation of the STAA as part of their PHA, which occurs every five years. An initial evaluation and documentation is required of all facility processes. EPA believes that some facilities may already regularly conduct evaluations but has taken the conservative approach of assuming that all facilities subject to the STAA provision will conduct the initial evaluation for all processes as a result of the final rule. Following the initial evaluation, EPA is requiring that facilities with Program 3 processes in NAICS 324 and 325 that are either located within one mile of another RMP-regulated facility process in NAICS 324 and 325 or had an RMP-reportable accident since their most recent PHA (i.e., in the past five years), and all regulated facilities in NAICS 324 using HF in an alkylation unit, conduct a practicability assessment if the initial evaluation determines the existence of inherently safer alternatives.
EPA expects a practicability assessment to be conducted only when warranted by the outcome of an initial evaluation; i.e., where the initial evaluation has identified risk reduction or risk management strategies applicable to the process at issue. EPA also anticipates that some facilities will conduct practicability studies to address alternatives considered in multiple initial evaluations. Consequently, some complex firms are assumed to conduct practicability studies that address up to 12 different alternatives. EPA is retaining the estimates of the hours required to conduct an initial evaluation from the 2017 amendments rule RIA and updating the costs to 2022 dollars. EPA estimates that the initial evaluation will require a total of 738 hours (all engineering labor) for NAICS 324 facilities99 and a total of 130 hours (20 hours of management, 0.5 hours of corporate management, 3.5 hours of attorney time, 82.5 hours of engineering, and 23.5 hours of production staff support) for NAICS 325 facilities.100 See Exhibit 4-5 below.
The technical practicability assessment considers the extent of process redesign, its engineering implications, and possible costs of implementing inherently safer technologies identified in the initial evaluation. To estimate the cost of the practicability assessment, referred to in some literature and comments as a feasibility study, EPA maintains the approach it developed for the amendments rule RIA. That approach is to identify “reference” STAA projects for the sectors affected by the provision, estimate costs of the reference projects, and apply a percentage to the project cost to calculate the practicability assessment cost. Public comments received on the proposed amendments rule provided practicability assessment cost information specifically for STAA projects. This information was provided by American Water Works Association (AWWA), American Fuel & Petrochemical Manufacturers (AFPM), American Petroleum Institute (API), and Chemical Safety Advocacy Group (CSAG). EPA also identified sources examining feasibility studies of mining projects including Mackenzie and Cusworth (2007)101. Since the amendments rule was promulgated, EPA identified an additional paper, McLeod (2021)102, which summarizes lessons learned about practicability studies from the literature but does not provide additional cost data. EPA was unable to locate new information on practicability assessment costs or those costs in relation to project costs. Thus, EPA adopts the same 1.2 percent of project costs that was estimated for the amendments rule RIA.103
The approach to estimating the costs of practicability assessments identified relevant reference projects for each affected sector and cost estimates for each reference project and then applied the 1.2 percentage estimate to project costs. EPA assumes Program 3 facilities already assess the practicability of some potential alternatives. Hence, the reference projects reflect the addition of inherently safer and a few other alternatives in a facility’s practicability assessment as a result of the final rule. To estimate the cost of reference projects, EPA gathered new data combined with data used for the amendments rule RIA. Several commenters on the proposed amendments rule RIA provided estimates of the costs of potential STAA projects. AWWA offered cost estimates for four STAA projects (see Exhibit 4-3 below and Table 4-10 in the comments, p. 4-21).104 The water industry will not be affected by the final rule STAA provision, but EPA used these project costs to benchmark similar reference project costs for the chemical manufacturing sector.
Exhibit 4-3: AWWA Comment on Estimated Project Costs (2016).
Disinfection Technology |
Capital Costs (millions, 2022 $) |
Hypochlorite |
$2.3 |
Chlorine Dioxide |
$1.1 |
Ultraviolet |
$14.7 |
Ozone |
$29.6 |
An important potential STAA project for the final rule is the consideration by petroleum refiners of converting an HF alkylation to safer technologies that replace HF with substitutes such as sulfuric acid, ionic liquids, or solid acid. EPA was able to locate nine estimates of the costs to modify or replace an HF alkylation unit. Two were already identified for the amendments rule RIA (including one provided by AFPM through public comments)105 and seven that became available after development of that RIA. Appendix A presents the cost estimates, which range from $50 million to $900 million, with a mean of $270 million, a median of $155 million, and a mode of $300 million. Thus, EPA has adopted an estimate of $300 million for this analysis, which is unchanged from the amendments rule RIA. This may be a conservative estimate given that recent advancements in technology target HF conversion and may be lowering conversion costs. Several recent articles discuss a new, lower cost technology that converts existing HF alkylation units to use sulfuric acid and simultaneously allows an expansion of production capacity.106
Additional STAA projects that might be considered by petroleum refiners include piping replacement and miscellaneous small projects. For chemical manufacturers, STAA projects might include chemical conversion, piping replacement, and other miscellaneous small projects. See Appendix D in the 2016 RIA for the 2017 amendments rule for a description of these projects and their estimated costs.107 Note that the costs of the most expensive STAA projects will drive the majority of expenditures for practicability studies. The cost is then multiplied by the number of facilities in the affected sector (assuming the costs are spread over five years), and the costs for each sector are summed to calculate the overall costs of practicability studies.
Exhibit 4-4 illustrates the estimated costs for practicability studies using this approach; that is, it approximates the costs of practicability studies as 1.2 percent of reference project costs. EPA developed a unit cost estimate of the practicability assessment for each sector (petroleum refining and chemical manufacturing) by weighting the reference projects by the number of facilities estimated to require that type of practicability assessment.
Exhibit 4-4: STAA Practicability Assessment Cost Table (millions, 2022 dollars).
Sector |
Reference Project |
Reference Project Unit Cost |
Units/ project |
Number of Facilities |
Total Project Cost |
Wghted Average (sum of sector’s total project costs / sector’s number of facilities) |
1.2 percent of Wghted Average |
Petroleum refining |
HF alkylation conversion* |
$365.0 |
1 |
42 |
$15,316.3 |
$186.2 |
$2.2 ($4.4 HF, $.31 non-HF) |
Petroleum refining |
2 major piping replacements |
$12.2 |
2 |
47 |
$1,142.6 |
||
Petroleum refining |
10 other small STAA projects |
$0.1 |
10 |
89 |
$108.2 |
||
Chemical manufacturing |
Chemical conversion** |
$6.1 |
1 |
101.8 |
$618.7 |
$2.8 |
$.03 |
Chemical manufacturing |
Piping replacement |
$1.2 |
1 |
407.2 |
$495.0 |
||
Chemical manufacturing |
5 other small STAA projects |
$0.1 |
5 |
509 |
$309.4 |
*Assumes all refineries with HF alkylation processes study conversion, the remainder study two major piping replacement projects and all study 10 small STAA projects.
**Assumes 20 percent of Program 3 chemical facilities study conversion, the remainder study minor piping replacement and all study five small STAA projects.
Based on this analysis, the STAA practicability assessment cost for a facility in petroleum refining is $2.2 million (or $4.4 million for a facility with an HF alkylation process and $306,326 for a facility without) over a five-year period and for a facility in chemical manufacturing, $33,550 over a five-year period.
Exhibit 4-5 displays the hours and costs assumed for each task by labor category and type of facility, and the resulting per facility cost estimates.
Exhibit 4-5: Hourly Labor and Unit Costs for STAA (2022 dollars).
Sector |
Labor Hours |
Facility Cost |
|||||
Manager |
Corporate Mgmt. |
Attorneys |
Engineers |
Production |
|||
Initial Evaluation |
|||||||
Refineries |
0 |
0 |
0 |
738 |
0 |
$73,149 |
|
Chemical Manufacturers |
20 |
0.5 |
3.5 |
82.5 |
23.5 |
$13,284 |
|
Sector |
Facility Cost |
||||||
Practicability Assessment |
|||||||
Refineries – HF |
$4,390,674 |
||||||
Refineries – Non-HF |
$306,326 |
||||||
Chemical Manufacturers |
$33,550 |
||||||
4.4.2 STAA: Implementation Equivalent to Passive Measures
This final rule provision requires that facilities with Program 3 processes in NAICS codes 324 or 325 that have had an accident since their most recent PHA, have an HF unit in a 324 process, or are within 1 mile of another 324 or 325 facility, implement a measure (IST/ISD, passive, active, or procedural) or combination of measures (IST/ISD, passive, active, and/or procedural) reducing risk at least as much as would a passive measure identified as practicable in the facility’s STAA. If the facility identifies no practicable passive measures, then it must implement a measure or set of measures reducing risk at least as much as would an active measure identified as practicable. If the facility identifies no practicable active measures, then it must implement a measure or set of measures reducing risk at least as much as would a procedural measure identified as practicable.
The cost of implementing risk reduction measures varies widely depending on the specific measure and facility. To estimate a facility’s cost of implementation per measure satisfying this provision, EPA identified cost estimates of 30 risk reduction measures. Each cost estimate, the source of the estimate and other relevant information are presented in Appendix D. These measures include four used to estimate practicability study costs in the 2017 amendments rule, two from Eastern Research Group (ERG), six from other EPA documents, one from a cost-benefit analysis of the Massachusetts Toxic Use Reduction Act (TURA), five from Toxic Use Reduction Institute (TURI) case studies of implemented TURA measures, five from a list of examples of STAA measures on a STAA consulting website, four from a 2012 National Academy of Sciences report, and two from a news article’s list of risk-reduction measures Chevron’s Richmond Refinery promised in 2017.108 Some sources directly provided cost estimates, while others required EPA to search online for cost information for items matching a measure’s description. See Appendix D for more information, including the cost data utilized.
These 30 measures do not include cost estimates for the IST/ISD measures of HF alkylation conversion and chemical conversion from the 2017 amendment rule because facilities will always have an alternative to implementing an IST/ISD measure. In other words, the costliest safety measures (i.e., those identified as IST/ISD measures) are excluded from the cost estimates for STAA implementation because the analysis assumes implemented measures instead will be less costly procedural, active, or passive measures. While facilities may satisfy this provision by implementing either an IST/ISD measure or a passive-equivalent measure, EPA assumes facilities will most likely implement IST/ISD when an IST/ISD’s net cost is less than a passive measure’s cost. The net cost of an IST/ISD could be less than a passive measure’s cost for a number of reasons:
Operating and Maintenance (O&M) cost – IST/ISD may have a change in O&M costs compared to passive measures. For example, chemicals used in the process may change, which could cause changes in recurring input costs, including potentially lower those costs.
Productivity improvements – IST/ISD could result in productivity improvements from more efficient process and changes to input costs.
Safety improvements – IST/ISD may reduce risks of an accident more than would a passive-equivalent measure. A lower accident risk will result in facility safety benefits and social benefits from fewer accidents.
Capital/facility reduced losses – Similar to safety, a lower accident risk will reduce losses to capital as well as shorter than expected facility shutdown time from accidents.
Of the 30 risk-reduction measures with cost estimates, EPA applied five measures to NAICS 324 facilities only, 19 to NAICS 325 facilities only, and six to both. Twenty-seven (five NAICS 324 only, 17 NAICS 325 only, five both) of the 30 measures provide capital cost estimates, and 15 (two NAICS 324 only, 10 NAICS 325 only, three both 324 and 325) of the 30 provide recurring cost estimates. EPA lacks data on the safety impacts of each measure, so it takes an agnostic approach of averaging capital costs from all 11 measures of all types for NAICS 324 facilities and all 25 measures for NAICS 325 facilities. EPA estimates recurring costs as a percent of capital costs by dividing the mean of the 15 recurring cost estimates by the mean of the 27 capital cost estimates, rounded to the nearest whole percentage. EPA does not estimate facility costs due to forgone production during measure implementation, nor does it estimate potential revenue gains or cost savings from implementing a measure. Exhibit 4-6 presents the cost estimate per measure, which equals the cost estimate per facility because EPA assumes each facility implements one measure per five-year period to satisfy the requirement.
Exhibit 4-6: STAA Implementation Costs per Facility (2022 dollars).
Sector |
Capital Cost per Measure |
Recurring Cost as a Percent of Capital Cost |
Measures per Facility |
Capital and Recurring Cost per Facility |
|
Year 1 |
Year 6 |
||||
Refineries |
$4,449,414 |
4% |
1.0 |
$4,627,390 |
$4,805,367 |
Chemical Manufacturers |
$546,494 |
4% |
1.0 |
$568,354 |
$590,214 |
It is important to note that while EPA has estimated the cost of STAA implementation, EPA has not estimated the cost savings facilities may gain from implementing these STAA measures. To the extent that facilities do reap cost savings from these new technologies, EPA’s estimates of gross costs can be offset partially by those cost savings.109
4.4.3 Root Cause Analysis
This final rule provision will require that facilities in Programs 2 and 3 that have had an RMP-reportable accident determine the underlying causes as part of their incident investigation. A root cause analysis is a structured process led by a person trained in the methodology. The time required may vary considerably based on the complexity of the processes involved.
In the baseline, facilities are already required to conduct incident investigations; however, EPA expects additional time will be required for the more rigorous root cause analysis. Management time is expected to be devoted primarily to decisions concerning resolution of corrective actions arising from the investigation. For simple facilities, EPA assumed that labor for root cause analyses will require management time and additional time evenly distributed between production staff and engineers. For complex facilities, in addition to facility management, EPA estimated that due to the facility’s size and complexity, attorney hours will be required, along with an estimated 0.5 hours of corporate management time. EPA also estimated that multiple hours of engineering and production staff will be required to conduct the analysis.
Complex facilities are estimated to require 132.5 total hours (68 hours of management, 0.5 hours of corporate management, 6 hours of attorneys, 30 hours of engineers, and 28 hours of production staff) for a root cause analysis and simple facilities are estimated to require 14 total hours (6 hours of management, 4 hours of engineering, and 4 hours of production). These hour estimates apply to root cause analyses of RMP-reportable accidents and reflect the additional time required for root cause analyses over and above incident investigation.
EPA is retaining the estimate in the amendments rule RIA that simple facility costs include $1,000 for a trained facilitator to assist with the investigation. EPA updated the estimate to 2022 dollars. EPA assumes that complex facilities generally have staff familiar with the methodology and will conduct the root cause analysis in-house. Exhibit 4-7 displays the hours assumed for each labor category for each type of facility, and the estimated cost per facility.
Exhibit 4-7: Unit Cost for Root Cause Analysis (2022 dollars).
Facility Type |
Labor Hours |
Other Costs |
Facility Cost |
||||
Managers |
Corporate Mgmt. |
Attorneys |
Engineers |
Production |
|||
P2 - Simple |
6 |
0 |
0 |
4 |
4 |
$1,216 |
$2,350 |
P2 - Complex |
68 |
0.5 |
6 |
30 |
28 |
$0 |
$15,496 |
P3 - Simple |
6 |
0 |
0 |
4 |
4 |
$1,216 |
$2,350 |
P3 - Complex |
68 |
0.5 |
6 |
30 |
28 |
$0 |
$15,496 |
4.4.4 Third-party Audits
The current RMP rule requires Program 2 and Program 3 facilities to conduct a compliance audit at least once every three years. The final rule requires Program 2 and Program 3 facilities that have had an RMP-reportable accident to contract with an independent third-party to conduct the next required audit. The amendments rule RIA estimated the cost of hiring a third-party to conduct an audit. The audit required under this final rule will have the same estimated cost, so the estimated costs here are based on the unit costs and labor hours estimated under the amendments rule, updated to 2022 dollars.110
For the third-party audit estimates, the analysis assumes that the time required to contract for a third-party audit will vary with the complexity of the processes to be covered and multiple facility staff will be involved, except for the smallest category of facilities. At a minimum, one manager and one engineer will be involved to identify potential auditors and write the statement of work on which the auditor will base its bid. For larger firms that routinely contract and have contracting departments, a contracts specialist and attorney will be part of the process. Many large firms and all governments are assumed to have standard contract language. Governments are estimated to spend more time on the contracting process, however, because most are required to solicit competitive bids and document the basis for the selection. Private firms may use a similar process but are not required to do so. Private firms are likely to spend time negotiating contract language after the award. Hourly assumptions and costs for a third-party audit are shown in Exhibit 4-8.
Exhibit 4-8: Hourly Labor and Unit Costs for Hiring Third-party Auditors (2022 dollars).
Facility Type |
Total Hours for Contracting Process |
Facility Labor Cost |
Auditor Fee |
Total Facility Cost |
||
|
Mgm’t |
Attorneys |
Engineers |
|
|
|
Simple w/ 0-19 FTEs |
64 |
8 |
0 |
$8,291 |
$36,467 |
$44,758 |
Simple w/ 20-99 FTEs |
88 |
8 |
36 |
$13,624 |
$36,467 |
$50,091 |
Simple w/ 100+ FTEs |
60 |
8 |
112 |
$16,173 |
$36,467 |
$52,640 |
Complex w/ 0-19 FTEs |
64 |
8 |
0 |
$10,448 |
$97,246 |
$107,694 |
Complex w/ 20-99 FTEs |
88 |
8 |
36 |
$17,317 |
$97,246 |
$114,563 |
Complex w/ 100+ FTEs |
60 |
8 |
112 |
$20,999 |
$97,246 |
$118,246 |
Small Government |
60 |
0 |
50 |
$10,358 |
$36,467 |
$46,826 |
Large Government |
120 |
0 |
78 |
$24,234 |
$97,246 |
$121,480 |
4.4.5 Employee Participation Plan
The final rule will require employers to consult with employees when making decisions on implementing recommendations from PHAs, compliance audits, and incident investigations; provide employees the opportunity to stop work under certain circumstances; and provide opportunities for employees to report RMP noncompliance (either anonymously or not, at the reporter’s discretion). Specifically, the final rule will require that the employee participation plan, at 40 CFR 68.83, include and ensure effective methods are in place so that employees knowledgeable in the process and their representatives have authority to recommend to the operator in charge of a unit that an operation or process be partially or completely shut down based on the potential for a catastrophic release. The final rule will require facilities with Program 3 processes to include in their employee participation plan explicit language that includes information for reporting of RMP-reportable accidents or other related RMP non-compliance issues. This will require facilities with Program 3 processes to update their current employee participation plans.
Facilities with Program 2 processes are not currently required to have an employee participation plan. Therefore, they will need to develop an employee participation plan. The final rule will also require both Program 2 and Program 3 facilities to provide annual written or electronic notice to employees indicating RMP information is available and to train employees on the employee participation plan. Therefore, EPA estimates the cost for Program 2 facilities to develop a new employee participation plan, Program 3 facilities to make minor adjustments to current employee participation plans, and both Program 2 and Program 3 facilities to train employees on the employee participation plan.
EPA assumes that the development of an employee participation plan for a facility with Program 2 processes is a comparable burden to that for developing an employee participation plan for a facility with Program 3 processes. The 1996 RMP RIA did not include costs for employee participation plans for facilities with Program 3 processes, based on the assumption that those costs were already adequately accounted for under the OSHA PSM program. EPA therefore relied on the 1992 OSHA PSM RIA as the basis for the costs for employee participation plans for facilities with Program 2 processes. The resulting estimates of hours by labor category for each facility type are presented in Exhibit 4-9.
Exhibit 4-9: Hourly Labor and Unit Costs for Employee Participation Plan Development:
Facilities with Program 2 Processes (2022 dollars).
Facility Type |
Mgr. |
Corp. Mgr. |
Atty. |
Eng. |
Prod. Staff |
Facility Cost |
Simple (<20 FTE) |
0 |
0 |
0 |
1 |
0.5 |
$96 |
Simple (20+ FTE) |
0 |
0 |
0 |
3 |
0.5 |
$245 |
Complex (<20 FTE) |
0 |
0 |
0 |
1 |
0.5 |
$132 |
Complex (20+ FTE) |
0 |
0 |
0 |
3 |
0.5 |
$331 |
Facilities with Program 3 processes will need to update current employee participation plans. EPA assumes that this will be a minimal effort, and that regardless of facility complexity, 0.5 hours for an engineer and 0.5 hours for a production level staff will be required. The resulting unit costs, and these assumptions, are presented in Exhibit 4-10.
Exhibit 4-10: Hourly Labor and Unit Costs for Employee Participation Plan Update (2022 dollars).
Facility Type |
Mgr. |
Corp Mgr. |
Atty. |
Eng. |
Prod. Staff |
Facility Cost |
Simple |
0 |
0 |
0 |
0.5 |
0.5 |
$59 |
Complex |
0 |
0 |
0 |
0.5 |
0.5 |
$83 |
Facilities with Program 2 or Program 3 processes will need to train employees on employee participation plans. EPA assumes that regardless of facility complexity 1 hour for a manager and 0.5 hours for a production level staff will be sufficient to prepare and run the training. Facilities will incur an additional cost per employee. EPA expects that each facility employee (assumed to be production level staff) will spend 0.5 hours in training. The resulting unit costs, and these assumptions, are presented in Exhibit 4-11.
Exhibit 4-11: Hourly Labor and Unit Costs for Employee Participation Plan Training (2022 dollars).
Facility Cost Type |
Mgr. |
Corp Mgr. |
Atty. |
Eng. |
Prod. Staff |
Facility Cost |
Fixed Cost per Facility |
1 |
0 |
0 |
0 |
0.5 |
$138 |
Additional Cost per Employee |
0 |
0 |
0 |
0 |
0.5 |
$33 |
4.4.6 Emergency Backup Power for Perimeter Monitors
The final rule will require already installed perimeter monitoring equipment associated with prevention and detection of accidental releases from RMP-regulated processes where power loss has been identified as a major hazard to have standby or backup power to ensure compliance with the rule. Facilities with perimeter monitoring equipment that have identified power loss as a major hazard but do not have backup power will need to acquire backup power. Many continuous emissions monitoring systems have low power requirements.111 The proposed rule assumed $1,000 per facility for their monitoring equipment backup power. This final rule revised those assumptions to $3,300 per facility in any given year based on generator pricing and sensor power requirement information from commercial websites, as well as an example of the number of perimeter monitors at a facility.112 EPA assumes a facility’s perimeter monitoring system will require a 1 kW backup generator, but facilities may purchase a slightly more powerful model. EPA assumes a facility will pay $3,000 to purchase and install such a small generator based on identifying an 8.5kW home generator listed for slightly below $3,000.113 EPA assumes a 5-year lifespan for the generator, so facilities will newly purchase or make equivalently costly repairs every 5 years. EPA assumes ordinary annual operation and maintenance costs of 10% of purchase and installation costs, or $300 per year. Exhibit 4-12 presents facility costs in the year of purchase (e.g., year 1 and 6) and in years with only ordinary annual operation and maintenance costs (e.g., year 2-5 and 7-10).
Exhibit 4-12: Perimeter Monitor Backup Power Costs per Facility (2022 dollars).
Facility Type |
Capital Cost |
Recurring Cost as a Percent of Capital Cost |
Facility Cost |
|
Years 1 & 6 |
Years 2-5 & 7-10 |
|||
P2/3 with Perimeter Monitors without Backup Power where Power Loss is a Hazard |
$3,000 |
10% |
$3,300 |
$300 |
4.5 RMP Justifications
4.5.1 Hazard Evaluation Amplifications and RAGAGEP gap analysis
The final rule will explicitly require Program 2 and 3 facilities to address stationary source siting, natural hazards, power loss, and a RAGAGEP gap analysis in their PHAs or Hazard Reviews. EPA assumes facilities already address these issues and that language is just amplifying these implicit requirements. The stationary source siting and natural hazards provisions will also require all Program 2 and 3 facilities to include a justification in the RMP for each stationary source siting or natural hazards recommendation the facility declined to implement. The RAGAGEP provision will also require all Program 3 facilities to include a justification for each PHA recommendation the facility declined to implement associated with adopting practices from the latest version of RAGAGEP. EPA assumes each RMP with a Program 2 or 3 process will average two declined siting recommendations and two declined natural hazards recommendations, and each RMP with a Program 3 process will additionally average two declined RAGAGEP-related PHA recommendations. The power loss provision will require Program 2 and 3 facilities to include justifications for any process without backup power. EPA assumes each RMP will include a justification for every Program 2 and 3 process without backup power. The RMP justifications will involve selecting from a dropdown menu of justification options. EPA assumes facilities will take five minutes of manager time to identify which justification applies to a given declined recommendation or process without backup power. Labor and facility costs are presented in Exhibit 4-13.
Exhibit 4-13: Hourly Labor and Facility Costs for RMP Justifications (2022 dollars).
Facility Type |
Annual Frequency |
Manager Labor Hours |
Manager Hourly Loaded Wage |
Facility Cost per Justification |
Simple |
0.2 |
0.083 |
$110.70 |
$9 |
Complex |
0.2 |
0.083 |
$137.52 |
$11 |
4.6 Emergency Response
4.6.1 Community Notification of RMP Accidents
The final rule will require all facilities with Program 2 or 3 processes to provide accidental release notification and data to local responders and ensure that a community notification system is in place. The presence of State and/or local Integrated Public Alert and Warning System (IPAWS)114 alerting authorities covering all 50 States plus D.C., Puerto Rico, and the U.S. Virgin Islands implies that the infrastructure is in place nationwide for facilities to ensure community notification. Therefore, the direct cost associated with the provision will be coordination between the facilities and local responders.
EPA assumes all facilities with Program 2 or 3 processes will have to take some additional steps to coordinate with local responders to ensure a process is in place to transfer accidental release notification and data to local responders and ensure the successful ability to use a community notification system. EPA assumes simple facilities will require an additional 2 hours of facility management time and an additional 1 hour of local responder time for them to communicate with each other about a community notification system and for the facility to provide any additional information necessary for coordination and document this additional coordination. EPA assumes the additional coordination time for complex facilities will be approximately double that of simple facilities. The unit costs are shown in Exhibit 4-14.
Exhibit 4-14: Hourly Labor and Unit Costs for Community Notification (2022 dollars).
Facility Type |
Managers |
Local Responders |
Facility Cost |
Simple Facilities |
2 |
1 |
$293 |
Complex Facilities |
4 |
2 |
$695 |
4.7 Information Availability
The final rule will require facilities to make certain information available upon request to community members living, working, or spending significant amounts of time within 6 miles of a facility either through file sharing, providing information at a public library or other public offices, or providing it via e-mail or on the facility’s website. The provision will require facilities to inform the public about what information is available upon request and how to obtain the requested information. The information elements should be readily available to facility managers because most of the information is already compiled for compliance with various health and safety regulations. For example, the information is already contained in safety data sheets (SDSs) which are documents that OSHA requires every facility to have available for its employees, and which contain chemical hazard information required under 29 CFR 1910.1200. The names of chemicals and five-year accident history are already collected for reporting in the RMP. Especially for simple facilities, this information is unlikely to change much from year to year; the only cost associated with this element is the time required to collect and review the information for accuracy.
EPA assumes, on average, facilities will receive one information request in any given year. The analysis estimates that simple facilities will spend 2 hours reviewing the information to ensure that it is up-to-date. Complex facilities may have more information to review because they may manufacture, process, and use multiple regulated substances in multiple processes. The analysis estimates that small complex facilities will spend 4 hours collecting and reviewing the information. Large complex facilities were estimated to spend 54 hours because management and possibly counsel will need to ensure that the information was not subject to any restrictions related to security or confidential business information concerns. Labor and facility costs are presented in Exhibit 4-15.
Exhibit 4-15: Hourly Labor and Facility Costs to Collect and Review Information (2022 dollars).
Facility Type |
Annual Frequency |
Labor Hours |
Other Costs |
Facility Costs |
||
Management |
Attorney |
Engineer |
||||
Simple Facilities |
1 |
1 |
0 |
1 |
$0 |
$185 |
Small Complex |
1 |
2 |
0 |
2 |
$0 |
$473 |
Large Complex |
1 |
8 |
10 |
36 |
$0 |
$6,727 |
The provision will also require facilities to translate the information into two languages in addition to English. EPA assumes each facility will perform two translations once during each five-year RMP period, averaging one fifth of facilities each year. EPA assumes simple facilities will translate 7,000 words and that complex facilities will translate 45,000 words per language, each at a cost of $0.10 per word.115 Unit and facility costs are presented in Exhibit 4-16.
Exhibit 4-16: Unit and Facility Costs to Translate Information into Two Languages (2022 dollars).
Facility Type |
Annual Frequency |
Price per Word |
Words per Language |
Languages per Facility |
Facility Costs |
Simple Facilities |
0.2 |
$0.10 |
7,000 |
2 |
$1,400 |
Small Complex |
0.2 |
$0.10 |
45,000 |
2 |
$9,000 |
Large Complex |
0.2 |
$0.10 |
45,000 |
2 |
$9,000 |
EPA assumes an average of one public information request per facility per year and that facilities will require ID verification, resulting in a cost burden for members of the public requesting information. EPA assumes information requestors will spend one hour to provide identification and obtain the requested information, with half doing so electronically and the other half in-person. The cost per hour spent on ID verification equals the value of a requestor’s leisure time, which EPA estimates to be $35.90.116 EPA estimates that each requestor providing identification in person will also face travel costs of $11.79.117 Unit costs are presented in Exhibit 4-17.
Exhibit 4-17: Unit Costs and Public Burden for ID Verification (2022 dollars).
Facility Type |
Annual Frequency (A) |
Public Burden Hours (B) |
Value per Hour of Leisure (C) |
Cost of Travel to and from Facility (D) |
In-person Share of ID Verifications (E) |
Public Cost per ID Verification (A x B x C + D x E) |
All |
1 |
1 |
$36.66 |
$11.79 |
50% |
$42.56 |
CHAPTER 5: Total Estimated Costs of the Final Rule
This chapter presents the estimated costs of each final rule provision as well as estimated total, undiscounted, discounted, and annualized final rule costs projected over 10 years and discounted at 3 percent and 7 percent, as required by the Office of Management and Budget (OMB).118 The 10-year annualization period was chosen because it covers two PHA cycles, and of the activities required by the final rule that occur the least frequently; that is, every five years. Total estimated costs are developed by applying the estimated unit costs discussed in Chapter 4 to the universe of affected facilities presented in Chapter 3.
This chapter is organized as follows:
Section 5.1 presents the broad analytical assumptions used in the analysis focusing primarily on the annual frequency of rule provision activities.
Section 5.2 presents the estimated rule familiarization costs.
Section 5.3 describes the estimated total costs for new prevention program rule provisions, including STAA, root cause analysis, third-party audits, the employee participation plan, and perimeter monitor backup power.
Section 5.4 describes the estimated total costs associated with the emergency response provisions in the final rule.
Section 5.5 describes the estimated total costs associated with the final provision for information availability.
Section 5.6 describes the total costs associated with final rule provisions requiring justifications.
Section 5.7 discusses major uncertainties associated with the cost estimates.
Section 5.8 shows the estimated total costs for each rule provision, as well as the estimated total cost for the final rule.
5.1 Analytical Assumptions
5.1.1 Annual Frequency
The analysis generally divided total costs into initial year costs and ongoing costs. For provisions in which the activity occurs in multiple-year increments, the annual frequency is a fraction representing the portion of facilities assumed to implement the provision in any given year. For example, if an activity is expected to be conducted once every five years, the annual frequency will be 0.2, with 20 percent of the applicable facilities assumed to implement the activity each year. The assumption that implementation will be distributed evenly across time may overstate the costs for some years and understate them for others. This issue primarily concerns the STAA and third-party audits. The STAA is part of the PHA, which must be updated every five years or more frequently because of process or procedural changes, accidental releases, or information on risks that triggered an updated PHA or compliance audit.
5.1.2 Initial and Ongoing Costs
Ongoing costs differ from the initial costs for rule familiarization (Section 5.2), STAA, and backup power for perimeter monitors. The analysis used an ongoing cost when costs for years 2 through 10 were different from the initial cost components. If costs for years 2 through 10 were the same as the initial year, then multiplying the initial cost by the annual frequency accounted for any continuing costs.
5.1.3 Capital Costs
The analysis included two categories of capital costs; those associated with acquiring a generator to provide backup power for perimeter monitoring and those associated with implementing STAA. The costs of equipment purchased for facilities required to implement backup power or implement STAA are not amortized. Some facilities may choose to finance equipment purchases to spread the costs over several years, while others may treat them as an operating expense and pay them in a single year.
By not amortizing equipment costs in this analysis, EPA is making the conservative assumption that facilities will pay these initial costs in a single year (year 1) and that the equipment retains no monetary value upon installation. For backup power, this is likely conservative, given that EPA assumes the generator for backup power will cost $3,000 and that each facility will purchase only one generator that will last for 5 years before needing a replacement or major maintenance and repairs of equivalent cost. For STAA implementation, this assumption is likely to be accurate for simpler, less-capital-intensive measures where most of the upfront costs are from labor effort or for measures where the equipment installation is quick, but removal is difficult. However, this assumption is less likely to be accurate for many other potential implementation measures with multi-year implementation timelines and larger capital costs where equipment may retain substantial resale value for some years. The effect of STAA implementation on a facility’s value varies by measure and facility, and EPA lacks data on average values of old equipment replaced and on the ease of resale of equipment installed to implement STAA measures.
Financing would smooth a facility’s costs of directing resources (for example, labor and materials) toward construction and/or installation for the measure. Many chemical plants, ethanol plants, and other processing assets do not typically finance parts of facilities. They would finance only equipment/processes that can be separated out, meaning that some STAA implementation measures that fall into this category may not be financed. Additionally, many facilities may not want, or be able to get, from primary lenders loans for the typical size of STAA implementation measures (see Exhibit 4-6) being considered as industry loans tend to be for amounts larger than $25 million.119 As a result of these financing considerations, and the value considerations in the prior paragraph, EPA makes the simplifying assumption that all upfront costs of implementation occur in a single year and are not amortized.
While construction and installation may take multiple years for some measures, all facilities must implement the measures within five years, so EPA believes it is reasonable to assume one-fifth of total capital costs occur in each year, per five-year period.
5.2 Rule Familiarization
EPA estimated the cost of rule familiarization, which, while not a provision of the final rule, is a necessary activity for facilities to successfully implement the rule provisions. See Exhibit 5-1.
Exhibit 5-1: Rule Familiarization (2022 dollars).
-
Facility Type
Unit Cost
Facilities
Total Cost (Incurred in Year 1)
Simple
$553
10,082
$5,580,285
Program 1 and Program 2 Complex
$688
131
$90,076
Program 3 Complex
$28,744
1,527
$43,892,735
LEPCs
$553
2,473
$1,368,781
Delegated Implementing Agencies
$553
13
$7,195
Total
14,226
$50,939,073
5.3 Prevention Program Rule Provisions
Major provisions of the final rule include several changes to accident prevention program requirements designed to reduce the likelihood and/or severity of future accidents. These include new requirements for STAA initial evaluation, practicability assessment, and implementation of practicable measures; as well as root cause analysis, third-party audits, employee participation plans, emergency backup power for perimeter monitors, and hazard evaluation amplifications and RAGAGEP gap analysis. Costs vary considerably across requirements.
5.3.1 Safer Technology Alternatives Analysis (STAA) Initial Evaluation and Practicability Assessment
The
RMP rule currently does not require facilities to conduct a STAA.
The final rule’s
STAA provision will apply to facilities with either NAICS 324
(petroleum and coal products manufacturing) or 325 (chemical
manufacturing) processes. The provision will require owners/operators
to conduct an initial evaluation of potential safer technologies
every five years as part of the PHA. If the facility had an accident
since its most recent PHA, has an HF unit, or is within one mile of
another facility with processes in NAICS 324 or 325, then it will
also have to conduct a practicability assessment of potential IST/ISD
every five years as part of the PHA. EPA believes the States of
California (only at refineries with HF units) and Massachusetts and
Contra Costa County, California, which have existing requirements
similar to the STAA requirement, are likely already conducting
activities that will satisfy EPA’s new requirement. EPA also
believes this cost will be reduced after the first five-year PHA
cycle because after the initial PHA, EPA requires owners/operators to
update and revalidate a PHA to ensure that the PHA is consistent with
the current processes. Revalidation is a much less costly activity
than conducting the initial PHA. EPA believes the cost of an initial
STAA evaluation and practicability assessment will likewise be lower
after the first submission; that is, in all subsequent 5-year
submissions. However, EPA estimates this cost as identical in both
the first and second five-year cycles in the period of analysis for
affected facilities only required to conduct STAA only because of an
accident. For the remaining facilities, EPA assumes the cost in the
second five-year cycle will average 18% of the cost in the first
five-year cycle.120
Exhibits 5-2 and 5-3 present the estimated costs for the provision in
Years 1-5 and Years 6-10, respectively.
Exhibit 5-2: Estimated Annual Costs for STAA Initial Evaluation and Practicability Assessment
Years 1-5 (2022 dollars).
Facility Type |
Annual Frequency |
Unit Cost |
Number of Units |
Total Annual Cost |
Initial Phase Analysis |
||||
Refineries |
0.2 |
$73,149 |
1,535 |
$22,456,638 |
Chemical Manufacturers |
0.2 |
$13,284 |
2,799 |
$7,436,475 |
Total |
|
|
4,334 |
$29,893,113 |
Practicability Analysis |
||||
Refineries |
0.2 |
$2,233,771 |
89 |
$39,761,125 |
HF |
0.2 |
$4,390,674 |
42 |
$36,881,660 |
Non-HF |
0.2 |
$306,326 |
47 |
$2,879,465 |
Chemical Manufacturers |
0.2 |
$33,550 |
509 |
$3,415,390 |
Total |
|
|
598 |
$43,176,515 |
Grand Total |
|
|
|
$73,069,638 |
*Totals may not sum due to rounding.
Exhibit 5-3: Estimated Annual Costs for STAA Initial Evaluation and Practicability Assessment
Years 6-10 (2022 dollars).
Facility Type |
Annual Frequency |
Unit Cost |
Number of Units |
Total Annual Cost |
Initial Evaluation |
||||
Refineries |
0.2 |
$13,167 |
1,535 |
$4,042,195 |
Chemical Manufacturers |
0.2 |
$2,391 |
2,799 |
$1,338,565 |
Total |
|
|
4,334 |
$5,380,760 |
Practicability Analysis |
||||
Refineries |
0.2 |
$419,013 |
89 |
$7,458,427 |
HF |
0.2 |
$790,321 |
42 |
$6,638,699 |
Non-HF |
0.2 |
$87,205 |
47 |
$819,729 |
Chemical Manufacturers |
0.2 |
$7,336 |
509 |
$746,823 |
Total |
|
|
598 |
$8,205,250 |
Grand Total |
|
|
|
$13,586,011 |
*Totals may not sum due to rounding.
5.3.2 STAA Implementation of Practicable Measures
Under
the final rule’s STAA provisions, facilities required to
conduct a STAA practicability assessment (i.e., Program 3 NAICS 324
or 325 facilities with an accident since their most recent PHA, with
an HF unit in a NAICS 324 process, or within one mile of another
NAICS 324 or 325 facility) will also be required to implement at
least one or more practicable measure every five years as part of the
PHA. The implemented measure(s) may be IST/ISD, passive, active,
and/or procedural, but must reduce risk at least as much as would an
identified practicable passive measure (or active if no practicable
passive measure is identified, or procedural if no practicable
passive or active measure is identified). EPA believes facilities in
Contra Costa County, which has existing requirements for facilities
to implement IST/ISD, are likely already conducting activities that
will satisfy EPA’s requirement. EPA estimates the cost as
increasing each year in the period of analysis due to accumulating
recurring O&M costs as facilities implement measures. Recurring
O&M costs accumulate as each year, another one-fifth of
facilities implement new measures, while measures implemented in
prior years continue to incur the O&M costs. Exhibits 5-4 and 5-5
present the estimated total costs for the provision in Years 1-5 and
Years 6-10, respectively.
Exhibit 5-4: Estimated Annual Costs for STAA Implementation Years 1-5 (2022 dollars).
Facility Type |
Capital Cost Annual Frequency |
Unit Capital Cost |
Unit Recurring Cost |
Facilities |
Total Annual Cost in Year: |
||||
1 |
2 |
3 |
4 |
5 |
|||||
Refineries |
0.2 |
$4,449,414 |
$177,977 |
93 |
$86,069,456 |
$89,379,820 |
$92,690,184 |
$96,000,548 |
$99,310,911 |
Chemical Manufacturers |
0.2 |
$546,494 |
$21,860 |
518 |
$58,881,469 |
$61,146,141 |
$63,410,813 |
$65,675,485 |
$67,940,157 |
Total |
|
|
|
611 |
$144,950,926 |
$150,525,961 |
$156,100,997 |
$161,676,032 |
$167,251,068 |
*Totals may not sum due to rounding.
**Total annual recurring cost = (year)×(capital cost annual frequency) ×(unit recurring cost) ×(facilities)
Exhibit 5-5: Estimated Annual Costs for STAA Implementation Years 6-10 (2022 dollars).
Facility Type |
Capital Cost Annual Frequency |
Unit Capital Cost |
Unit Recurring Cost |
Facilities |
Total Annual Cost in Year: |
||||
6 |
7 |
8 |
9 |
10 |
|||||
Refineries |
0.2 |
$4,449,414 |
$177,977 |
93 |
$102,621,275 |
$105,931,639 |
$109,242,002 |
$112,552,366 |
$115,862,730 |
Chemical Manufacturers |
0.2 |
$546,494 |
$21,860 |
518 |
$70,204,829 |
$72,469,500 |
$74,734,172 |
$76,998,844 |
$79,263,516 |
Total |
|
|
|
611 |
$172,826,104 |
$178,401,139 |
$183,976,175 |
$189,551,210 |
$195,126,246 |
*Totals may not sum due to rounding.
**Total annual recurring cost = (year) ×(capital cost annual frequency) ×(unit recurring cost) × (facilities)
5.3.3 Root Cause Analysis
The
RMP rule currently requires the owner or operator of a facility to
investigate each incident that resulted in or could have reasonably
resulted in a catastrophic release. The final rule will require all
Program 2 and Program
3 facilities to
conduct a root cause analysis for any RMP-reportable accident.
Accident numbers are drawn from the data on RMP-reportable accidents,
referenced in Exhibit 3-8. The total costs of this provision are
provided in Exhibit 5-6.
Exhibit 5-6: Total Undiscounted Costs for Root Cause Incident Investigation (2022 dollars).
Facility Type |
Unit Cost |
Avg. Annual Number of Accidents (2016-2020) per year |
Total Annual Cost |
P2 Accident - Simple |
$2,350 |
12.8 |
$30,079 |
P2 Accident - Complex |
$15,496 |
0.2 |
$3,099 |
P3 Accident - Simple |
$2,350 |
40.2 |
$94,466 |
P3 Accident - Complex |
$15,496 |
41.2 |
$638,448 |
Total |
|
94.4 |
$766,092 |
5.3.4 Third-party Audits
The RMP rule currently requires Program 2 and Program 3 facilities to conduct a compliance audit at least once every three years. The final rule will require that the next scheduled compliance audit be conducted by a contracted third-party for any Program 2 or Program 3 facility that had an RMP-reportable accidental release.
Accident numbers are based on the RMP data from RMP-reportable accidents, referenced in Exhibit 3-9. Numbers of affected facilities are estimated based on the average number of RMP-reportable accidents from 2016 to 2020. The RMP Database contains data on accidents with and without RMP-reportable impacts. Because this provision does not require third-party audits for accidents with no RMP-reportable impacts, EPA deducted those accidents from the total in the RMP Database.
The
analysis assumes that the annual number and distribution of accidents
among types of facilities reflects the 5-year baseline estimates and
that in any one year, the number of facilities conducting a
third-party audit will be equal to the average number of accidents.121
That is, although the approximately 94 third-party audits for
accidents at Program 2 and Program
3 facilities may
occur up to three years after the release, depending on when the
previous audit occurred, the analysis projects over time that 94
facilities will conduct such an audit each year.122
The breakout for
total costs is shown in Exhibit 5-7:
Exhibit 5-7: Total Annual Undiscounted Costs for Third-party Audits (2022 dollars).
Facility Type |
Annual Frequency |
Unit Cost |
Facilities |
Total Annual Cost |
Simple w/ 0-19 FTEs |
1 |
$44,758 |
15 |
$689,279 |
Simple w/ 20-99 FTEs |
1 |
$50,091 |
8 |
$400,727 |
Simple w/ 100+ FTEs |
1 |
$52,640 |
26 |
$1,368,646 |
Complex w/ 0-19 FTEs |
1 |
$107,694 |
2 |
$172,311 |
Complex w/ 20-99 FTEs |
1 |
$114,563 |
8 |
$870,680 |
Complex w/ 100+ FTEs |
1 |
$118,246 |
32 |
$3,807,505 |
Small Government |
1 |
$46,826 |
3 |
$140,477 |
Large Government |
1 |
$121,480 |
1 |
$72,888 |
Total |
|
|
94 |
$7,522,514 |
*Totals may not sum due to rounding.
5.3.5 Employee Participation Plan
The RMP rule currently requires only facilities with Program 3 processes to develop an employee participation plan. The final rule will require all facilities with a Program 2 process to newly develop an employee participation plan, in addition to facilities with Program 3 processes. These newly developed employee participation plans, as well as all facilities with Program 3 processes which already have an employee participation plan, will need to include newly explicit language for employees reporting any RMP-reportable accidents or other related RMP non-compliance issues. Facilities with both Program 2 and 3 processes will also have to provide employees with annual notice that RMP information is available and train employees on the employee participation plans. Program 3 facilities will have to update their employee participation plans for owners or operators to consult with employees and their representatives on recommendation decisions and provide employees knowledgeable in the process and their representatives stop work authority under certain conditions. EPA assumes facilities will review their employee participation plan before each required annual notice and conservatively assumes these reviews may cost annually as much as facilities’ one-time cost to develop and update the employee participation plans under this new requirement. EPA assumes employees receive training on the plan once every five years. Exhibit 5-8 presents the costs for the provision.
Exhibit 5-8: Estimated Costs for Employee Participation Plan Provision (2022 dollars).
Facility Type |
Annual Frequency |
Unit Cost |
Facilities |
Total Annual Cost |
Program 2 requirement to develop new employee participation plan |
||||
Simple Facilities w/ 0-19 FTEs |
1 |
$96 |
3,415 |
$327,602 |
Simple Facilities w/ 20+ FTEs |
1 |
$245 |
496 |
$121,314 |
Complex Facilities w/ 0-19 FTEs |
1 |
$132 |
29 |
$3,842 |
Complex Facilities w/ 20+ FTEs |
1 |
$331 |
35 |
|
Total |
|
|
3,975 |
$464,333 |
Program 3 requirement to update current employee participation plan |
||||
Simple Facilities |
1 |
$59 |
5,578 |
$327,801 |
Complex Facilities |
1 |
$83 |
1,527 |
$126,612 |
Total |
|
|
7,105 |
$454,413 |
Program 2 requirement to train employees on employee participation plan |
||||
Trained Employees |
0.2 |
$33 |
60,793 |
$405,571 |
Facilities |
0.2 |
$138 |
3,975 |
$109,329 |
Total |
|
|
3,975 |
$514,900 |
Program 3 requirement to train employees on employee participation plan |
||||
Trained Employees |
0.2 |
$33 |
1,475,579 |
$9,844,095 |
Facilities |
0.2 |
$138 |
7,105 |
$195,417 |
Total |
|
|
7,105 |
$10,039,512 |
Grand Total |
|
|
11,080 |
$11,473,158 |
*Totals may not sum due to rounding. The “Facilities” column reflects the number of facilities except for the “Trained Employees” rows where it reflects the number of trained employees.
5.3.6 Emergency Backup Power for Perimeter Monitors
The
final rule’s backup power provision will require facilities
with processes that have perimeter monitors and have identified power
loss as a major hazard to implement emergency backup power for their
perimeter monitors. Among these facilities, those that have not yet
implemented emergency backup power will incur a cost to purchase and
install a backup generator for their perimeter monitors. EPA assumes
the life of the backup generator to be five years. EPA makes the
conservative assumption that facilities will pay for the backup
generator in a lump sum every five years. EPA estimates 392
facilities must implement backup power for perimeter monitoring by
counting the number of active Program 2 and 3 facilities in the RMP
database (as of 31 December 2020) that report having perimeter
monitors, a cooling loss hazard (as a proxy for power loss being a
major hazard), and no backup power. Exhibit 5-9 presents the
estimated costs for the provision.
Exhibit 5-9: Total Undiscounted Costs for Backup Generator for Perimeter Monitors
at Facilities with a Process that has a Perimeter Monitor and Power Loss Hazard
without Backup Power (2022 Dollars).
Facility Type |
Capital Cost Annual Frequency |
Unit Capital Cost |
Unit Recurring Cost |
Facilities |
Total Annual Cost in Year: |
|
|||
|
|
1 |
2 |
3 |
4 |
5-10 |
|||
Total |
0.2 |
$3,000 |
$300 |
392 |
$258,720 |
$282,240 |
$305,760 |
$329,280 |
$352,800 |
5.4 RMP Justifications
5.4.1 Hazard Evaluation Amplifications and RAGAGEP Gap Analysis
The final rule will require Program 2 and 3 facilities to include in their RMP a justification for why the facility has not installed emergency backup power for each process without emergency backup power, and justifications for each declined natural hazards recommendation and stationary source siting recommendation. The final rule will also require Program 3 facilities to include in their RMP a justification for each declined PHA recommendation associated with the most recent version of RAGAGEP. EPA assumes the number of justifications for not implementing backup power will equal the number of Program 2 and 3 processes without backup power as of December 31, 2020. EPA assumes each Program 2 and Program 3 facility will, on average, provide two natural hazards justifications and two siting justifications, and each Program 3 facility will additionally average two RAGAGEP justifications. Exhibits 5-10, 5-11, 5-12, and 5-13 present the estimated costs for the RMP justification provisions.
Exhibit 5-10: Costs for Emergency Backup Power RMP Justification Provision (2022 dollars).
Facility Type |
Annual Frequency |
Cost per Justification |
Justifications |
Total Annual Cost |
Simple |
0.2 |
$9 |
7,471 |
$13,784 |
Complex |
0.2 |
$11 |
879 |
$2,015 |
Total |
|
|
8,350 |
$15,798 |
Exhibit 5-11: Costs for Natural Hazards RMP Justification Provision (2022 dollars).
Facility Type |
Annual Frequency |
Cost per Justification |
Justifications |
Total Annual Cost |
Simple |
0.2 |
$9 |
18,978 |
$35,014 |
Complex |
0.2 |
$11 |
3,182 |
$7,293 |
Total |
|
|
22,160 |
$42,307 |
Exhibit 5-12: Costs for Stationary Source Siting RMP Justification Provision (2022 dollars).
Facility Type |
Annual Frequency |
Cost per Justification |
Justifications |
Total Annual Cost |
Simple |
0.2 |
$9 |
18,978 |
$35,014 |
Complex |
0.2 |
$11 |
3,182 |
$7,293 |
Total |
|
|
22,160 |
$42,307 |
Exhibit 5-13: Costs for RAGAGEP RMP Justification Provision (2022 dollars).
Facility Type |
Annual Frequency |
Cost per Justification |
Justifications |
Total Annual Cost |
Simple |
0.2 |
$9 |
11,156 |
$20,582 |
Complex |
0.2 |
$11 |
3,054 |
$7,000 |
Total |
|
|
14,210 |
$27,582 |
5.5 Emergency Response
5.5.1 Community Notification of RMP Accidents
The RMP rule currently requires only responding Program 2 and 3 facilities to have procedures in place for informing the public and the appropriate Federal, State, and local emergency response agencies about accidental releases. The final rule will require both responding and non-responding Program 2 and 3 facilities to ensure a community notification system is in place. This analysis assumes that facilities are coordinating annually with LEPCs to ensure a community notification system is used to communicate information about RMP-reportable accidents. Exhibit 5-14 presents the cost for this provision.
Exhibit 5-14: Costs for Coordinating Community Notification (2022 dollars).
-
Facility Type
Annual Frequency
Unit Cost
Facilities
Total Annual Cost
Facility Burden
Simple P2/3
1
$221
9,288
$2,056,326
Complex P2/3
1
$550
1,792
$985,751
Total
11,080
$3,042,077
LEPC Burden
Simple P2/3
1
$72
9,288
$671,500
Complex P2/3
1
$145
1,792
$259,114
Total
11,080
$930,614
Facility + LEPC BURDEN
Grand Total
$3,972,691
5.6 Information Availability to the Public
5.6.1 Costs to Facilities
The RMP rule currently does not require facilities to conduct information availability activities. The final rule will require all facilities, including those with Program 1 processes, to make information related to RMP compliance available upon request in a manner that is easily accessible to community members residing, working, or spending significant time within 6 miles of the facility. The information will include the names and SDSs of regulated substances used at the facility, the facility’s accident history, emergency response program information, and LEPC contact information. The assumption is that each facility receives 1 request per year from a community member residing within 6 miles of the facility. The breakout of costs to facilities related to Information Availability is in Exhibit 5-15.
Exhibit 5-15: Costs to Facilities for Information Availability Provision (2022 dollars).
Facility Type |
Annual Frequency |
Unit Cost |
Facilities |
Total Annual Cost |
Simple |
1 |
$185 |
10,082 |
$1,865,424 |
Small Complex |
1 |
$473 |
1,050 |
$496,941 |
Large Complex |
1 |
$6,727 |
608 |
$4,089,892 |
Total |
|
|
11,740 |
$6,452,257 |
5.6.2 ID Verification Cost to the Public
EPA expects facilities will require community members to verify their identification before disclosing the requested information. EPA assumes each year one community member per facility will request information. The breakout of costs to the public in requesting information from facilities is in Exhibit 5-16.
Exhibit 5-16: Costs to Public for ID Verification from Information Availability Provision (2022 dollars).
Community Members Requesting Information |
Annual Frequency |
Unit Cost |
Number of Requests
|
Total Annual Cost |
Total |
1 |
$42.56 |
11,740 |
$499,645 |
5.7 Important Cost Uncertainties and Indirect Costs Associated with Prevention Program Provisions
This section highlights some of the uncertainties associated with estimating the costs of the of the STAA, the root cause analysis and the third-party audit final rule provisions. It considers the potential indirect, follow-on costs that facilities could incur if they were to implement recommendations resulting from those provisions.
5.7.1 STAA
The STAA requirement is intended to identify potential opportunities for certain complex regulated facilities to eliminate or substantially reduce the hazards or risks associated with regulated processes by performing a detailed analysis of alternative process technologies. The STAA provision will require the owner or operator to consider process hazard controls in the following descending order of preference: IST/ISD, passive measures, active measures, and procedural measures. The provision also will require the owner or operator to determine the practicability of the IST/ISD considered.
The STAA provision is targeted at two sectors – petroleum and coal products manufacturing, and chemical manufacturing (NAICS codes 324 and 325, respectively) – which have had a high frequency of RMP-reportable accidents relative to other RMP-regulated industry sectors. The provisions will apply only to certain facilities in these two sectors.
The current RMP rule already requires owners and operators of most facilities in these sectors to perform a PHA. The PHA provision requires facilities to identify, evaluate, and control process hazards using appropriate engineering and administrative controls. However, the baseline requirement does not explicitly require the owner or operator to consider IST/ISD. EPA believes that requiring owners and operators of higher risk facilities to consider safer technologies and alternatives – with an emphasis on IST/ISD – may identify alternative hazard controls that were not considered in the baseline PHA requirement.
The STAA provision will require facilities, every five years, to implement at least one process or operational change identified as practicable that reduces risk at least as much as would a practicable passive measure. While implementation of IST/ISD will both satisfy and exceed what is necessary for both the baseline and final rule STAA requirements, EPA believes that some facilities may voluntarily implement IST/ISD as a result of conducting the STAA. This is, in part, because the final rule’s definition of “practicable” may result in the adoption of alternatives that previously were not considered practicable (i.e., where barriers such as costs or environmental and legal factors previously had been judged as too high to warrant implementation).123 Additionally, after review of the STAA and practicability analysis, the facility owner or operator may re-assess and decide to implement inherently safer alternatives.
The costs of voluntary implementation of recommendations resulting from the STAA provision are uncertain. A facility owner or operator may voluntarily implement a high-cost change if they believe its benefits warrant the expense. For example, a facility might expect the reduction in accident risks from a safer technology to offset the extra costs of that technology. EPA did not attempt to estimate the costs of voluntary implementation of alternative technologies identified in a STAA because of a high degree of uncertainty associated with which and how many facilities might voluntarily implement STAA projects. Judgments regarding which changes are considered safer or inherently safer, and the practicability of implementing such changes, are subjective. Additionally, some facilities that may have adopted IST/ISD or other risk-reduction measures in the absence of this rule may instead choose to adopt alternatives satisfying the final rule’s implementation requirement which achieve different levels of risk reduction than they would have done in the absence of this rule. EPA expects that, overall, the requirement will result in facilities identifying more options to reduce risk and implementing a larger number of more effective risk-reduction measures than facilities would in the absence of the rule, particularly among facilities that in the baseline have infrequent voluntary implementation of risk-reduction measures.
5.7.2 Root Cause Analysis
The RMP rule currently requires facilities to conduct incident investigations and address their findings. However, the final rule contemplates a more thorough “root cause” investigation to identify underlying causes of an accident. The outcome of a root cause investigation could reveal more substantial system-related reasons why an incident occurred and identify correctable failures in management systems. These underlying causes may not be identified under the baseline incident investigation provision. Similar to compliance audits, incident investigations can reveal a wide variety of causes for an incident. These can range from the immediate or proximate causes of an incident to its underlying, system-related cause or causes. For example, an investigation may reveal that the immediate cause of an incident was equipment failure (e.g., failure of a corroded pipe), or operator error (e.g., an operator performed procedural steps in an incorrect sequence). A deeper “root cause” investigation will go beyond these findings and identify the underlying reasons why the equipment failed (e.g., underlying deficiencies in the facility’s mechanical integrity program) or why the operator made the error (e.g., underlying deficiencies in the facility’s operator training program).
The baseline incident investigation provision requires the owner or operator to determine “the factors that contributed to the incident,” but does not explicitly require the owner to perform a root cause investigation. Some regulated facilities may already interpret the baseline provision as requiring root cause investigations or may opt for a root cause investigation in an effort to uncover systemic problems, but EPA believes that many others do not. Because the new root cause investigation requirement is likely to result in many facilities identifying deeper, system-related causes of incidents, actions taken to resolve these issues may require greater expenditures than what will occur under the baseline investigation requirement. For example, instead of replacing a single piece of failed piping, a root cause investigation could lead to facility-wide enhancements in piping inspections, and replacement of numerous additional piping sections where excessive corrosion was subsequently identified. Similarly, instead of providing additional training for a single operator, the root cause investigation could prompt an overhaul of the facility’s operator training program, including use of new training techniques and additional training for all process operators. Root cause investigations may also reveal multiple systemic accident causes. For example, in addition to identifying systemic training problems, the investigation may reveal other underlying root causes such as an equipment design problem that led the operator to make the error (e.g., confusing labeling or equipment configuration), or unclear operating procedures.
Resolving system-related deficiencies is expected, on average, to require greater expenditures than resolving investigation findings related to baseline (i.e., non-root-cause) investigations. However, similar to audits, EPA expects that resolving underlying problems will, in the long term, reduce the probability and magnitude of a future accident. Similar to the audit, the incident investigation is intended to bring facilities into compliance by revealing deficient areas of facility operations – in this case, areas that have caused an accident and may cause future accidents. However, EPA does not have information or data showing the increment in costs faced by a facility implementing changes recommended by a root cause analysis relative to a less deep incident investigation. Due to these uncertainties and this lack of information, EPA did not estimate potential costs from follow-up actions.
5.7.3 Third-party audits
The purpose of a compliance audit is to examine whether the facility’s accident prevention program – PHA, mechanical integrity program, operating procedures, etc. – is properly implemented and in compliance with 40 CFR part 68 requirements. Compliance audits can produce a wide range of findings. Changes recommended in the third-party audit relative to in-house compliance audits may be more costly.
Rigorous auditing by trained experts provides a detailed and thorough examination of potential problems and presents potential solutions to remedy those problems. Currently, compliance audits may be conducted by staff with less expertise than a third-party expert, or in-house staff that is not arms-length from the facility. The remedies suggested by a third-party audit are expected to be more efficient at identifying deficiencies and correcting hazards than remedies that will be recommended in the baseline. From this perspective, EPA expects that the more effective remedies suggested by third-party audits will impose different, but not necessarily additional, costs. They may reveal underlying problems and remedies that result in a more efficient allocation of the resources targeted at bringing the facility into compliance with the RMP rule.
Examples of potential actions resulting from third-party audits include more frequent equipment inspections, use of different or additional inspection methods, equipment upgrade or replacement, installation and use of different or additional hazard controls, altering process operating conditions, materials, or chemistry, modification of operating procedures, additional training, and staffing changes, among others. The wide scope of compliance audits and variation in potential follow up actions create uncertainty in estimating expected costs, which is exacerbated by a lack of information about the incremental difference in changes that result from a third-party audit compared to a baseline audit. Due to these uncertainties and this lack of information, EPA did not estimate the potential incremental costs from follow-up actions from a third-party audit relative to a baseline compliance audit.
5.8 Total Estimated Costs
The
analysis presents total costs as total undiscounted costs over the
10-year period of analysis, total discounted costs (at 3 percent and
7 percent), and annualized costs (at 3 percent and 7 percent). When
annual costs for different years are equal across the analysis time
period, which is the case for all provisions except for the rule
familiarization activity and STAA, the annualized costs calculated
using different discount rates (e.g., 3 and 7 percent) are equal.
Exhibit 5-17 presents the total estimated costs for the final rule.
In total, the final rule is estimated to cost $257 million per year
(annualized at 3 percent) and $297 million per year (annualized at 7
percent).
Exhibit 5-17: Total Estimated Costs of the Final Rule (millions, 2022 dollars).
Cost Elements |
Total Undiscounted |
Total Discounted (3%) |
Total Discounted (7%) |
Annualized (3%) |
Annualized (7%) |
Rule Familiarization |
$50.9 |
$49.5 |
$47.6 |
$5.8 |
$6.8 |
STAA |
|||||
Initial Evaluation |
$176.4 |
$158.2 |
$138.3 |
$18.5 |
$19.7 |
Practicability |
$256.9 |
$230.2 |
$201.0 |
$27.0 |
$28.6 |
Implementation |
$1,700.4 |
$1,438.9 |
$1,172.6 |
$168.7 |
$204.9 |
Root Cause Analysis |
$7.7 |
$6.5 |
$5.4 |
$0.8 |
$0.8 |
Third-party Audits |
$75.2 |
$64.2 |
$52.8 |
$7.5 |
$7.5 |
Employee Participation Plan |
$114.7 |
$97.9 |
$80.6 |
$11.5 |
$11.5 |
Backup Power for Perimeter Monitors |
$3.3 |
$2.8 |
$2.3 |
$0.3 |
$0.3 |
Justifications |
|
|
|
|
|
No Backup Power |
$0.2 |
$0.1 |
$0.1 |
$0.0** |
$0.0** |
Natural Hazards |
$0.4 |
$0.4 |
$0.3 |
$0.0** |
$0.0** |
Facility Siting |
$0.4 |
$0.4 |
$0.3 |
$0.0** |
$0.0** |
RAGAGEP |
$0.3 |
$0.2 |
$0.2 |
$0.0** |
$0.0** |
Community Notification System |
$39.7 |
$33.9 |
$27.9 |
$4.0 |
$4.0 |
Information Availability |
$127.6 |
$108.8 |
$89.6 |
$12.8 |
$12.8 |
Total Cost* |
$2,554.0 |
$2,191.7 |
$1,818.9 |
$256.9 |
$296.9 |
* Totals may not sum due to rounding.
** Annualized Costs for RMP Justification provisions are zero due to rounding. Unrounded costs for No Backup Power are $15,798 at 3% and 7% discount rates, for Natural Hazards and Facility Siting are $42,307 at 3% and 7% discount rates, and for RAGAGEP, are $27,582 at 3% and 7% discount rates.
Exhibit 5-18 provides undiscounted yearly costs for the final rule provisions, for both Year 1, Years 2-5, and Years 6-10. Rule familiarization costs are incurred only in Year 1, and therefore are $0 in subsequent years. STAA initial evaluation and practicability assessment costs are smaller in Years 6-10 than in Years 1-5.
Exhibit 5-18. Summary of Estimated Undiscounted Yearly Costs (millions, 2022 dollars).
Cost Elements |
Year 1 |
Year 2 |
Year 3 |
Year 4 |
Year 5 |
Year 6 |
Year 7 |
Year 8 |
Year 9 |
Year 10 |
Rule Familiarization |
$50.9 |
$0 |
$0 |
$0 |
$0 |
$0 |
$0 |
$0 |
$0 |
$0 |
STAA |
||||||||||
Initial Evaluation |
$29.9 |
$29.9 |
$29.9 |
$29.9 |
$29.9 |
$5.4 |
$5.4 |
$5.4 |
$5.4 |
$5.4 |
Practicability Assessment |
$43.2 |
$43.2 |
$43.2 |
$43.2 |
$43.2 |
$8.2 |
$8.2 |
$8.2 |
$8.2 |
$8.2 |
Implementation |
$145.0 |
$150.5 |
$156.1 |
$161.7 |
$167.3 |
$172.8 |
$178.4 |
$184.0 |
$189.6 |
$195.1 |
Root Cause Analysis |
$0.8 |
$0.8 |
$0.8 |
$0.8 |
$0.8 |
$0.8 |
$0.8 |
$0.8 |
$0.8 |
$0.8 |
Third-party Audits |
$7.5 |
$7.5 |
$7.5 |
$7.5 |
$7.5 |
$7.5 |
$7.5 |
$7.5 |
$7.5 |
$7.5 |
Employee Participation Plan |
$11.5 |
$11.5 |
$11.5 |
$11.5 |
$11.5 |
$11.5 |
$11.5 |
$11.5 |
$11.5 |
$11.5 |
Backup Power for Perimeter Monitors |
$0.3 |
$0.3 |
$0.3 |
$0.3 |
$0.4 |
$0.4 |
$0.4 |
$0.4 |
$0.4 |
$0.4 |
Justifications** |
||||||||||
No Backup Power |
$0.0 |
$0.0 |
$0.0 |
$0.0 |
$0.0 |
$0.0 |
$0.0 |
$0.0 |
$0.0 |
$0.0 |
Natural Hazards |
$0.0 |
$0.0 |
$0.0 |
$0.0 |
$0.0 |
$0.0 |
$0.0 |
$0.0 |
$0.0 |
$0.0 |
Facility Siting |
$0.0 |
$0.0 |
$0.0 |
$0.0 |
$0.0 |
$0.0 |
$0.0 |
$0.0 |
$0.0 |
$0.0 |
RAGAGEP |
$0.0 |
$0.0 |
$0.0 |
$0.0 |
$0.0 |
$0.0 |
$0.0 |
$0.0 |
$0.0 |
$0.0 |
Community Notification System |
$4.0 |
$4.0 |
$4.0 |
$4.0 |
$4.0 |
$4.0 |
$4.0 |
$4.0 |
$4.0 |
$4.0 |
Information Availability |
$12.8 |
$12.8 |
$12.8 |
$12.8 |
$12.8 |
$12.8 |
$12.8 |
$12.8 |
$12.8 |
$12.8 |
Total Cost* |
$305.8 |
$260.5 |
$266.1 |
$271.7 |
$277.3 |
$223.4 |
$229.0 |
$234.5 |
$240.1 |
$245.7 |
*Totals may not sum due to rounding.
**Annual Costs for RMP Justification provisions are zero due to rounding. Unrounded costs are $15,798 for No Backup Power, $42,307 for Natural Hazards and Facility Siting, and $27,582 for RAGAGEP.
Undiscounted costs over the 10-year timeframe are estimated to vary from $223 million in Year 6, to $306 million in Year 1.
CHAPTER 6: Total Benefits of the Final Rule
This Chapter presents discussion and analysis of the total benefits of the final rule. Section 6.1 discusses how the various provisions of the final rule will avoid or mitigate accidents and result in benefits. Section 6.2 discusses benefit categories associated with avoided and mitigated accidents. Section 6.3 discusses the break-even analysis of the rule. Finally, Section 6.4 presents some conclusions.
Facilities subject to the RMP regulations pose significant risks of negative impacts from accidental releases of toxic vapors, fires, and explosions to the public and the environment. This chapter qualitatively explains how the final rule provisions could prevent and mitigate RMP facility accidents. It outlines a broad set of social benefits associated with the rule. The chapter concludes with a comparison of costs to baseline damages and presents a breakeven analysis.
EPA is unable to estimate quantitative benefits for the final rule because EPA has no data to project the specific contribution of each final rule provision to reductions in the frequency or severity of future accidents. As shown by accident trends, accident frequency and severity are difficult to predict. Based on RMP accident data and other data, chemical accidents can impose substantial costs on firms, employees, emergency responders, the community, and the broader economy. Reducing the risk of such accidents and the severity of the impacts when accidents occur, and improving information availability, as the final provisions intend, will provide benefits to the potentially affected members of society.
Chemical accidents at RMP facilities and their associated impacts not only kill and injure people, but also can cause tremendous damage to property. This can include damage to goods produced, plant equipment and structures, and nearby industrial, commercial, and residential buildings, equipment, and furnishings. Damage can also occur to the natural environment and negatively affect nearby ecosystems and wildlife. Residents and other people in nearby communities may be required or requested to evacuate or shelter-in-place. Resources, such as emergency personnel and equipment, are diverted to address the fire, explosion, or vapor cloud. Properties located near the accident may lose value resulting from the perceived risks and other disamenities created by proximity to the accident. Risks posed by RMP facilities are reduced by lowering the probability and magnitude of accidents, which is the objective of the final rule. While many of the final rule provisions reduce risks for a large segment of regulated facilities, several are more targeted. The third-party audit and root cause analysis requirements are focused on lowering risks at facilities that have experienced one or more accidents. The STAA provision focuses on lowering risks in industrial sectors with greater rates of accidents, and in areas with more than one RMP facility or at facilities that have an HF unit or have experienced one or more accidents.
By reducing the risk of accidents, the benefits of the final rule include reductions in the numbers of fatalities and injuries both onsite and offsite. Reductions are also expected in the number of residents evacuated or otherwise inconvenienced by sheltering in place; reductions in the damage caused to property onsite and offsite of the facility including damages to product, equipment, and buildings; reductions in damages to the environment and ecosystems; and reductions in resources diverted to extinguish fires and clean-up affected areas. Other benefits include potentially avoided major catastrophes, avoided property value damages and business disruption, reduced legal and other transaction costs, more efficient and effective emergency preparedness, more efficient allocation of public resources, and more efficient property and capital markets.
EPA expects that the final rule will generate other benefits, such as from increased public information availability. Improved information about risks at RMP facilities may also lead to more efficient property markets in areas near these facilities. More detailed information about nearby risks allows participants in property markets to refine the values they place on nearby properties and decisions about where to locate. The outcome should be property values that more closely reflect actual risks and decisions that better reflect true preferences. Better information about risks at RMP facilities also facilitates more efficient use of emergency responder resources. Finally, for publicly-owned facilities, more public information about risks may facilitate efficiency in capital markets.
The 2017 amendments rule contained various new provisions applicable to RMP-regulated facilities addressing prevention program elements (including STAA, root cause analysis, and third-party audits), emergency response coordination with local responders (including emergency response exercises), and information availability to the public. The RIA for that rule qualitatively and quantitatively discussed benefits related to accident prevention, mitigation, and information disclosure. In December 2019, the 2019 reconsideration rule rescinded certain information disclosure provisions of the 2017 amendments rule, removed most new accident prevention requirements added by the 2017 amendments rule, and modified other provisions. The benefits that would have been generated by the modified and rolled back provisions were also eliminated. Under this final rule, those benefits will be restored to the extent the provisions are the same. For example, the STAA provision is being restored, although it will apply to a smaller set of facilities compared to the 2017 amendments rule. For the current analysis, EPA presents and updates much of the benefits analysis developed for the 2017 amendments rule.
6.1 Benefit Categories
Exhibit 6-1 illustrates the social benefits associated with each final rule provision. EPA identified four primary social benefit categories:
Prevention of Future RMP Accidents: Several final rule provisions will help prevent accidents by triggering improvements in RMP process design, equipment, procedures, or operator training. Preventing serious accidents avoids numerous direct costs, including worker, responder, and public fatalities and injuries, public evacuations, public sheltering in place, and property and environmental damage. It also avoids negative impacts that are difficult to quantify, such as lost productivity due to lost or damaged property and business interruption both onsite and offsite, expenditure of emergency response resources and attendant transaction costs, and reduced offsite property values.
Mitigation of Future RMP Accidents: Several final rule provisions will reduce the impacts or severity of accidents by promoting a more rapid and efficient response to these accidents. If a serious chemical accident or major catastrophe occurs, mitigating its impacts benefits society by reducing the number of fatalities and injuries, reducing the magnitude of property damage and lost productivity both onsite and offsite, and reducing the extent of public evacuations, sheltering in place and expenditure of emergency response resources.
Improved Public Information Availability: Notification procedures will be available upon request to the public residing, working, and spending significant time within 6 miles of an RMP facility. Facilities will also be required to ensure a community notification system is in place to warn the public within the area threatened by a release. In addition, EPA will require facilities to provide entities, including the public, with initial RMP accidental release information during releases of regulated substances. EPA expects this requirement to generate benefits because it may result in more efficient allocation of public response resources by improving the ability of planners and responders to make appropriate decisions concerning equipment, training, and procedures. Improved information may also improve local contingency planning and training of emergency responders. In addition, more timely information and accessible alerts through the community notification system ensure the public can receive authenticated emergency and life-saving alerts when there is an accident. Better information about nearby risks can improve the efficiency of nearby property markets and information about risks of publicly-traded firms can improve the efficiency of capital markets.
Prevention and Mitigation of Future non-RMP Accidents at RMP Facilities: Actions that prevent or reduce the severity of accidents in RMP-covered processes are also likely to prevent or mitigate non-RMP accidents at the same facility because the same or similar actions can be taken for processes and equipment not subject to the regulation, often at minimal additional cost. For example, new operational safety policies implemented by an owner or operator to prevent or respond to an RMP-related emergency will also improve their ability to respond to any emergency or accident at the facility.
Exhibit 6-1: Social Benefits of Final Rule Provisions.
-
Rule Provision
Social Benefits
1. STAA*
Prevention of future RMP facility accidents
Mitigation of future RMP facility accidents
Prevention and mitigation of future non-RMP accidents at RMP facilities
Avoided major catastrophes
2. Root cause analysis*
3. Third-party audits*
4. Employee Participation Plan
5. RMP Justifications
Mitigation of future RMP facility accidents
Mitigation of future non-RMP accidents at RMP facilities
6. Emergency Response Provisions
Mitigation of future RMP facility accidents
Mitigation of future non-RMP accidents at RMP facilities
7. Information Availability
Improved information
Mitigation of future RMP facility accidents
Mitigation of future non-RMP accidents at RMP facilities
* The provision increases the likelihood that RMP facilities will adopt process changes superior to those that would have occurred in the baseline. This incremental improvement results in the social benefits which appear in the right hand column. Note that a wide variety of process changes might result, depending on the industry, the findings of the analysis or audit, the specific facility or process, and so on.
As Exhibit 6-1 indicates, each rule provision is expected to generate social benefits in multiple benefit categories. The primary social benefit category for each rule provision is indicated in bold type. Exhibit 6-1 indicates, for example, that performing an accident root cause analysis is expected to reduce the risks and magnitudes of future RMP and non-RMP accidents at RMP facilities and of major catastrophes. The emergency response provisions are another example. The provisions require a community notification system which helps improve information available to the public and emergency responders. This will mitigate future RMP accidents as well as impacts of non-RMP accidents at RMP facilities.
The following sections discuss each primary benefit category in more detail: accident prevention, accident mitigation, and information provision. Each of the primary social benefit categories identified in Exhibit 6-1 is associated with more specific benefits which are elaborated in the conclusion of this chapter and the discussion of Exhibit 6-3.
6.1.1 Prevention
Final rule provisions for STAA, root cause analysis, third-party audits, and employee participation plans involve changes to the current RMP rule’s accident prevention program elements and are intended to lower the likelihood of future accidents of the same or similar type.
The STAA requirement applies to facilities with a Program 3 process in NAICS 324 or 325. The practicability assessment portion of the requirement applies only to Program 3 NAICS 324/325 facilities that had accident since their last PHA, that are located within one mile of another facility with a process in NAICS code 324 or 325, or that have an HF alkylation unit in a NAICS 324 process. The STAA should result in identification of potential process changes which, if implemented, will result in owners or operators using less hazardous substances, minimizing the quantities of regulated substances present in a process, moderating process conditions, or reducing process complexity.
The final rule also requires that facilities with Program 3 processes in NAICS code 324 or 325 that have had an accident, have an HF unit in a 324 process, or are within 1 mile of another 324 or 325 facility implement a measure (IST/ISD, passive, active, or procedural) or combination of these measures that reduce risk at least as much as would a passive measure identified as practicable in the facility’s STAA. Such changes help reduce the prevalence of higher risk processes. They prevent accidents by either eliminating the possibility of an accidental release entirely by making a process more fault-tolerant, such that a minor process upset, or equipment malfunction is less likely to result in a serious accidental release; and by making releases that do occur, less severe. The requirement is expected to change the level of risk reduction facilities achieve. The requirement may encourage some facilities to implement complementary measures which enhance cumulative risk reduction. EPA expects that, overall, the requirement will result in facilities identifying more options to reduce risk and implementing a larger number of more effective risk-reduction measures than facilities would in the absence of the rule, particularly among facilities that in the baseline have infrequent voluntary implementation of risk-reduction measures.
The root cause analysis provision is expected to prevent future accidents by identifying the underlying causes and corrective actions for serious accidents. Over time, EPA expects that implementing the corrective actions and lessons learned through root cause analyses should prevent future accidents and result in a reduction of onsite and offsite impacts.
The third-party audit provision requires regularly scheduled compliance audits to be conducted by an independent third-party for facilities that have had an accidental release or when required by an implementing agency. This differs from the current compliance audit requirement, which does not set requirements regarding auditor independence for these or other facilities. The final rule specifies third-party auditor qualifications including both competency and independence requirements. These safeguards regarding competency and independence should improve auditor objectivity and performance. In fact, peer-reviewed empirical literature has found that auditors are less likely to be lenient or biased when sufficient safeguards are in place to ensure auditor independence from the facility under review. Relative to the baseline, the third-party audit requirement increases the likelihood that audits will result in identification of safety problems and necessary process improvements before such deficiencies can result in accidents.
EPA expects the employee participation plan provision to prevent future accidents as well. Although employees currently may be involved in the development of plans and procedures (through 40 CFR 68.83 or otherwise), they may not be guaranteed “a seat at the table” when final decisions are made about process operations that they are directly involved in that pose hazards that could threaten their health and safety. Employees may have practicable recommendations for hazard evaluations, incident investigations, and compliance audits that may reduce hazards at RMP facilities. Involving directly affected employees in these discussions and decisions will help ensure that the most effective recommendations for reducing hazards and minimizing risks to employees and the public are given the proper consideration.
Climate change is associated with extreme weather events that can trigger accidental releases. One way EPA is addressing the risks associated with climate change impacts in the final regulation is by emphasizing language in the process hazard analysis requiring owners and operators to consider the impacts of natural hazards including climate change-related weather events. While EPA does not assign a cost to this provision, to the extent that the final provisions prevent the potential consequences of accidents at regulated facilities as the result of natural hazards, EPA expects these provisions to provide benefits from those mitigated or avoided accidents.
These provisions will also reduce the probability of a major catastrophe – a rare but extremely high consequence accident.
In addition to preventing future accidents, these provisions will generate additional social benefits, including mitigation of future RMP facility accidents, prevention of future non-RMP accidents at RMP facilities, and mitigation of future non-RMP accidents at RMP facilities. These provisions can identify process improvements that result in less severe releases (e.g., an audit or investigation that identifies improvements to a release detection or mitigation system).
6.1.2 Mitigation
Final rule provisions for emergency response and hazard evaluation amplifications are primarily focused on mitigating consequences of accidents. One component of the emergency response provisions ensures that a community notification system is in place to warn the public within the area threatened by release. The emergency response provisions expand recordkeeping and implementation related to a community notification system to non-responding facilities. EPA expects that this expansion will ensure that all facilities subject to emergency response requirements have documented knowledge of the public notification process that will occur in the event of an accidental release at the facility. The provision also will help clarify the facility’s role in the implementation of the notification process by requiring the owner or operator to provide the information needed to initiate a public release notification. In combination with annual emergency coordination meetings and notification exercises already required in the baseline, this will enhance coordinated notification to the public, improve documented accountability for the notification process, and help ensure timely decisions about notification of releases, particularly those with offsite impacts. These changes will result in faster and better coordinated responses, including effective and efficient notification of the public, that will reduce human health impacts and property damage, and help reduce the number of onsite and offsite impacts. Finally, fires and releases will be under control more quickly and ensuring that workers and responders know the most effective actions to take for a particular facility under certain conditions, the provision could reduce the duration of accidents as well as the likelihood of injuries to emergency responders. Exposures may also be limited—particularly for long-duration events.
Hazard evaluation amplifications can mitigate the consequences of accidents by requiring facilities with Program 2 and Program 3 processes to explicitly address natural hazards that could lead to or exacerbate an accidental release. Accident consequences should also be mitigated through an explicit requirement that facilities address standby or emergency power systems. Finally, mitigation should result from EPA explicitly defining stationary source siting as inclusive of the placement of processes, equipment, buildings, and hazards posed by proximate facilities, and accidental release consequences posed by proximity to the public. Natural hazards continue to be a factor in RMP accidents and present a growing threat to process safety at RMP facilities. Therefore, at a minimum, a requirement to evaluate and control natural hazards will allow for accidents to have lower consequences when natural hazards do occur. For example, the provision requires facilities with perimeter monitors to implement backup power if they do not have it already also can mitigate the consequences of accidents. Should there be a natural cause for loss of power, this requirement will ensure that perimeter monitors are able to continue to detect releases at the fenceline and allow for a quicker response. This may also mitigate the consequences of some accidents that might otherwise occur when releases are not detected early enough.
6.1.3 Improved Information
Several of the final rule provisions target information provision, including community notification under the emergency response provision and information availability; specifically, the final rule provision requiring facilities to disclose information upon request by nearby community members. The community notification provisions will improve coordination with the local community by ensuring systems are in place to provide quick information when there is an accidental release. The other components of the emergency response provisions will ensure the public and emergency responders are aware of the chemicals stored and processes used at RMP facilities, equipment, and materials. In addition, if local community members and businesses understand the potential risks from a facility accident, they will be better able to understand recommendations or orders from local officials for sheltering in place or evacuation and take appropriate actions should an actual accident occur. Community members and businesses will be better prepared for possible accidents, thereby mitigating the impacts of the event. Better public information will improve efficiency of nearby property markets, and better information provided to emergency responders will improve the efficiency of their decisions regarding preventive measures to take and equipment and materials to purchase. Finally, improved information about publicly traded firms could improve the efficiency of capital markets.
6.1.4 Evidence from the Literature
Evidence of the effectiveness of several of the rule provisions can be found in the peer reviewed literature. Regarding root cause analysis, Carroll et al. (2002) concluded that the cultural legacy of a root cause analysis at a chemical plant “was embodied in managers’ increased openness to new ideas, individuals’ questioning attitude and disciplined thinking, and a root cause analysis process that provided continual opportunities to learn and improve.”124 Root cause analysis is used widely in health care, where its effectiveness was studied by Percarpio, et al. (2008). Case studies of root cause analysis were gathered from 38 articles, 11 of which measured its effectiveness. Safety improvement following root cause analysis was reported by all 11 articles. However, the authors noted that the evidence of improved safety was anecdotal and that further formal studies are still needed.125 A later empirical analysis by Percarpio and Watts (2013) of data on root cause analysis for 139 medical centers from 2004 through 2006 concluded that facilities that completed fewer than four analyses per year had higher rates of postoperative complications, but it was not clear that root cause analyses directly improved patient safety.126 CSB investigations have indicated that root cause analyses help eliminate or substantially reduce the risk of reoccurrence of the incident and other similar incidents. The CSB investigations of the 2004 Formosa Plastics Corporation incident,127 the 2005 BP Texas City Refinery incidents,128 and the 2010 Millard Refrigerated Services incident129 found that root causes of prior, similar incidents were not identified, which contributed to subsequent incidents.
When independent third-party auditing is necessary and appropriate, the literature indicates that without sufficient safeguards to ensure auditor independence, auditors are more likely to provide lenient or biased audit reports that can fail to accurately identify problems and violations by the regulated entity. For example, Duflo, et al. (2013) found that plants in India reduced actual pollution emissions following a strengthening of requirements regarding third-party audits.130 Kunreuther, McNulty, and Kang (2002) characterized as successful a variety of third-party inspection programs, several of which included insurance components. The programs included third-party inspections of U.S. steam boilers, Los Angeles hygiene services, and a Massachusetts waste cleanup program. Based on case studies, the authors concluded, “The use of third-party inspections has had very beneficial effects on reducing the risks associated with different activities.”131
The final rule will require RMP facilities to make certain types of information available to the public upon request, including chemical hazard information, names of regulated substances, SDSs; accident history information and more. As stated by Oberholzer-Gee and Mitsunari (2006), “… if individuals pay attention to information regulation, this type of regulation can possibly lead to the spatial reallocation of resources in the metropolitan economy.” Many studies of the effect of publicly available information on market transactions, including property markets have been conducted and many have focused on potential impacts of the Toxic Release Inventory (TRI). For example, Oberholzer-Gee and Mitsunari (2006) examined property values in the Philadelphia region from 1988 to 1990 - one year prior and one year after publication of the TRI. The researchers concluded that after the release of TRI data, the predicted effect of pollution on property values changed and on average property values declined.132 Not all studies of pollution information found significant effects. Mastromonaco (2015) states “…evidence that the public internalizes information on toxic emissions, for example in the housing and stock markets, is mixed.”133 The current RMP rule makes additional information beyond toxics emissions available to the public. Mastromonaco (2015) looked beyond the impact of emissions data and examined a regulatory change in 2001 that lowered the threshold for required reporting for lead to the TRI. The paper studied San Francisco property value data to explore whether the new listing of existing facilities using lead that previously did not report to the TRI affected values of houses located near those facilities. The conclusion was that identifying a plant as a TRI plant significantly reduced nearby property values, suggesting that nearby residents adjusted their risk perceptions upward following newly available public risk information.134
6.1.5 Conclusion
The discussion in this section has qualitatively discussed how the final rule provisions will aid in the prevention and mitigation of accidents and improve information available to the public and LEPCs. EPA has no data or empirical estimates of the precise impact of each rule provision on the probability or magnitude of an accident, or on improved efficiency due to better information. To shed light on the landscape in the baseline, in Section 3.2.5 EPA described in detail the number and costs of accidents currently associated with RMP facilities. To the extent practicable, that analysis monetizes the costs of damages to partially estimate the baseline costs that EPA expects will decline due to the final rule. However, there are additional benefits to the final rule beyond those that data allow to be monetized. As illustrated in Section 3.2.1, EPA describes the impacts of two recent RMP-reportable accidents to further illustrate the nature of damages from accidents at RMP facilities including some that can be monetized and some that cannot. The following presents and explains additional baseline accident damages that could not be monetized.
6.2 Benefit Categories Associated with Accident Prevention and Mitigation
In addition to the avoided costs from the reduced likelihood of an accident or a catastrophe, the rule will generate benefits in other important categories, including avoided impacts of non-RMP accidents at RMP facilities; the information benefits described above; and additional benefit categories not reported in the RMP data that result from accident prevention and mitigation. Additional benefit categories include avoided major catastrophes, avoided health risks from exposure to toxic chemicals, avoided lost productivity, avoided responder costs, avoided transaction costs, protected property values, avoided environmental impacts, avoided unquantified evacuation and shelter-in-place costs, and potential benefits to communities with environmental justice concerns. The sections below present a discussion of these baseline damages that could not be monetized.
6.2.1 Major Catastrophes
In enacting section 112(r), Congress was focused on catastrophic accidents such as Bhopal, which are extremely rare, but very high consequence events. The large chemical facility accidents that have occurred in the U.S. and Europe have not approached this level of damage, although it is possible that could happen. The single largest chemical accident in the U.S., the explosion at Phillips in Pasadena, TX, in 1989 killed 23 workers ($239 million in 2022 dollars), injured at least 150 more ($7.5 million), and caused $1.8 billion in property damage.135 The five-year baseline period included in this analysis does not include a major catastrophe, nor were any reflected in the Amendments RIA time frame of 2004 to 2013. If the final rule provisions were to prevent or substantially mitigate even one accident of this magnitude, the benefits generated will be dramatic.
6.2.2 Potential Health Risks from Exposure to Toxic Chemicals
A baseline cost from RMP facility accidents is potential and/or perceived health risks from exposure to toxic chemicals. A benefit of the final rule in reducing the likelihood of an accident will be reduced long-term health risks from exposure to toxic chemicals. EPA is unable to quantify this benefit because in many cases the health risks from exposure to many toxic chemicals are unknown and may only be discovered years after an accident occurs. These health risks may occur from toxic chemical releases into the air, surface water, or soil. In addition, beyond actual health impacts, there may be costs to the public from stress and uncertainty associated with perceived risk of long-term health problems due to chemical accidents.
6.2.3 Lost Productivity
A major cost associated with some chemical accidents that is not captured in the five-year-baseline estimates presented above is the lost productivity that can result if a facility or process unit must be shut down or is destroyed. The RMP data include estimates of property damage but specifically exclude estimates of lost productivity.136 EPA has not estimated these costs because of a lack of data. Such costs are highly variable based on the type of release, the extent of the damage, the location of the facility, and product being produced. Marsh Specialty, a risk management and energy consultancy, has collected data on 10,000 accidents in the petrochemical sector over 40 years and published 27 editions of its “100 Largest Losses” reports.137 Their data suggest that lost productivity is typically two or three times the cost of onsite property damage and sometimes much more than that.138 For example, a series of three explosions at a refinery in Sweeney, Texas on April 13, 1991 resulted in $225 million in 2002 dollars ($353 million in 2022 dollars) of business interruption losses, five times the $45 million ($71 million in 2022 dollars) in property damage.139 Applying a multiplier of two or three to the annual average onsite property damages of $455 million over the 5-year period of 2016 to 2020 from RMP-related accidents included in this analysis, the annual productivity losses would be $909 million (using a factor of two) or $1.364 billion (using a factor of three). Many chemical accidents do not result in property damage and, therefore, have a limited impact on business beyond the loss of the chemical itself. Explosions and fires, however, can produce substantial damage.
The Marsh accident summaries provide examples of the extent of damage and the impact on production as well as the variability in those impacts. One refinery facility had $240 million in damage but continued to operate; another that experienced the same level of damage was shut down for 6 months. Production units affected by major explosions have been shut down for weeks, months or more than a year. Some accident reports indicate production continued but at a reduced rate for weeks or even months. A refinery accident that shuts down one or more units will affect the firm involved, especially if it has no other refinery in the area or its other units do not have the capacity to increase production. In some cases, such reduced production may be offset by increased production at other firms. Refining capacity in the U.S. is located primarily in the Gulf Coast and West Coast regions; accidents that shut down units in those areas may be less likely to have economic impacts beyond the firm owning the refinery if other nearby refineries can increase production. However, in some cases regional supply disruptions and related impacts may occur. As illustrated by the case studies, firm closure has occurred in response to serious accidents.
According to a RAND Corporation study, lost production capacity resulting from the August 12, 2012, Chevron Richmond refinery accident cost California consumers an additional $447 million in increased gasoline costs.140 The study also estimated that the February 18, 2015, accident at ExxonMobil in Torrance cost California consumers more than $2.4 billion due to shutdown of a production unit. In addition to lost production, accidents at refineries in other regions could impose additional social costs because even if other refineries can increase production, higher costs of transporting products longer distances may result.
Broader losses could occur in the petrochemical sector where some facilities may be the sole source for some products. Even in that sector, however, losses may be limited to the firm involved. For example, the 1989 explosion at the Phillips plant in Pasadena, TX, which destroyed two units at the facility appears to have had a limited impact on the economy even though the plant was the only domestic source for one product.141 Appendix B provides a list of the major U.S. accidents cited by Marsh in its 2020 publication, with property damages adjusted by Marsh to 2021 dollars, as well as some business interruptions in accident year dollars. These accidents are limited to those that might have occurred at RMP facilities (offshore oil and distribution accidents were omitted). In cases where the damage was the result of flooding or wind, the flooding or wind damage was a secondary effect of an accident where the primary cause was a chemical release and not a natural disaster. The accident list does not include all serious accidents because Marsh excluded any accident that produced less than $130 million in property damage (the publication covers accidents worldwide). Nonetheless, the list indicates the range of property damage and the lost productivity in the United States.
6.2.4 Emergency Response Costs
EPA was unable to locate data summarizing the costs associated with responding to a chemical release, fire, or explosion. Those costs are very likely to vary widely depending on the accident. A response may involve facility fire brigades, community fire departments, volunteer fire departments, and mutual aid organizations. There is also the cost associated with equipment depreciation and fire suppressant used. The level of effort and equipment use can be seen in accidents reported by Marsh. For example, in 1999, approximately 300 firefighters and 33 fire trucks participated in the 2 ½ hour effort to control a fire at a refinery in California. Foam concentrate consumption totaled 3,200 gallons.142 At a foam concentrate cost between $20 and $60 per gallon, the cost of the fire suppressant alone will range from $64,000 to almost $192,000. In sum, EPA expects that these costs are significant.
6.2.5 Transaction Costs
Chemical accidents result in transactions between parties that consume time and other resources that will otherwise be directed to other productive activities. For example, litigation can impose substantial transaction costs. Particularly when the public is affected, facilities are often sued; a 1988 refinery explosion led to about 5,200 property claims.143 Substantial costs are associated with making and responding to such claims and the associated litigation, both on behalf of plaintiffs and defendants. Rule provisions that reduce the number or severity of accidents could reduce the number of lawsuits and the resources expended on litigation. In addition, there is lost time to the public from often necessary interactions with government agencies, responsible parties, and media to try and understand the “true” cause, nature, and implications of chemical accidents due to perceived or real information barriers.
6.2.6 Property Value Impacts
Values of properties in close proximity may be affected by an RMP facility accident. Property values may be changed because damages caused by an accident may result in persistent effects. These effects may include including offsite damage to buildings and other structures and environmental damage which change the aesthetic appeal of the surrounding area and potentially reduce ecological services. Nearby residents may have concerns about health risks from the potential for continued exposure to toxic chemicals released during an accident. An accident could also serve as a signal affecting nearby residents’ perceptions and expectations regarding future accidents and risks (Guignet, et al. 2023b)144. These potential changes can affect the values of nearby properties.
Two recent hedonic property value analyses have examined the impact of RMP facility accidents on residential property values (Guignet et al. 2023a, b)145. Using a difference in differences estimation approach, Guignet et al. (2023b) studied nationwide data on RMP facility accidents and residential transactions between 2004 and 2019 that occurred within 5.75 km (3.57 miles) of an accident. The analysis found that accidents with only onsite impacts reduced nearby property values between zero and two percent. However, accidents with impacts that occurred offsite, including fatalities, hospitalizations, people in need of medical treatment, evacuations, sheltering in place events, and/or property and environmental damage, reduced home values by two to three percent. The lower values persisted for about 10 to 12 years on average. The paper estimates an average loss of $5,350 per home in 2021 year values. Aggregating across the communities near the 661 facilities that experienced an offsite impact accident in their data, Guignet et al. (2023b) calculate a total $39.5 billion loss.
In the second paper, Guignet et al. (2023a) analyzed RMP facilities and accidents in a smaller geographic area – the three states of Michigan, Ohio, and Pennsylvania – from 2004 through 2014. The analysis used alternative difference-in-differences and triple differences approaches that allowed comparison between homes before and after an accident, near an accident versus farther away, and homes near facilities with an accident versus near facilities with no accidents. The study concluded that accidents with offsite impacts caused a five to eight percent decrease in home values within 5 km (3.1 miles) of a facility accident. Both studies concluded that nearby homeowners experienced significant losses following an accident with offsite impacts. Thus, provisions that reduce the risks and expected magnitudes of such accidents will protect nearby property values. Guignet et al. (2023a) found that homes located near facilities regardless of whether an accident has occurred are already valued significantly lower than homes farther away. Accidents can further depress property values and exacerbate disparities in home values. This is an important distributional concern considering that residential property is a key source of wealth to many households.
Other research has not specifically targeted RMP facilities but t is relevant to understanding the benefits of the final rule including a variety of papers that have specifically examined the impact on property prices of being near hazardous industrial facilities, usually finding that prices increase with distance from the facility.146 Early research on the property value impact of industrial accidents includes Carroll et al (1996) which studied property prices in neighborhoods surrounding the Pepcon chemical facility in Nevada before and after a dramatic explosion in 1988.147 Data for around 5,000 property transactions from 1986 to 1990 showed that the explosion was followed by a 17.6 percent decline in property values in the two closest towns of Green Valley and Henderson.
Two studies have examined the effects of pipeline explosions on nearby property values. While the explosions were not from chemical facilities, the property value impacts may be comparable.148 Preliminary findings by Cheng, et al. (2022) of nationwide property value impacts of accidents at natural gas pipelines suggest that values within 1 km (.62 mile) of natural gas distribution pipelines declined by 7 percent compared to properties 1 to 2 km (.62 to 1.24 miles) from an explosion.149 Hansen et al. (2006) studied the effect of a 1999 fuel pipeline explosion in Bellingham, Washington.150 Following the pipeline explosion, prices of properties within a mile were significantly adversely affected, with the mean property price discounted by 4.6 percent for a property 50 feet from the pipeline, and declining at further distances.
These studies strongly suggest that preventing or mitigating an accident at a chemical facility may prevent or mitigate property value losses in nearby neighborhoods. Note that any avoided property value losses represent part of society’s combined valuation of reduced risks to human health, reduced ecosystem services, and negative impacts on aesthetic appeal. At the same time, property value losses reflect losses only to nearby homeowners, and not to other affected parties such as employees, emergency responders, and others who are affected through avenues other than property values, including affected individuals who do not live in the immediate neighborhood.
6.2.7 Environmental Impacts
In addition to data on deaths, injuries, property damage, evacuations, and sheltering in place, the current RMP rule requires owners and operators to report within the five-year accident history those accidental releases that result in environmental damage. However, the environmental damage information contained in the RMP database is limited. RMP accident history reports indicate general categories of environmental damage (e.g., fish or animal kills, tree, lawn, shrub, or crop damage, etc.), but do not contain estimates of damage valuation or other specific information on reported impacts.
Rule provisions that prevent or mitigate the extent of accidental releases are therefore likely to prevent or reduce the environmental impacts associated with those releases. These benefits cannot be quantified using the available data.
6.2.8 Unquantified Costs of Evacuation and Sheltering-in-place Events
While EPA has estimated the baseline time costs of evacuations and sheltering-in-place events, there are additional costs that EPA is unable to quantify. Some of these additional costs were described in the cases presented in Section 3.2.1. The following list highlights examples of additional unquantified impacts of evacuations and sheltering in place events:
Inconvenience of relocating to a relative’s or friend’s house.
If staying at a hotel, expenses for rooms, meals, parking151 and the stress of not knowing whether you will be reimbursed for hotel and related expenses (e.g., restaurant meals).152
The emotional toll of deaths or illness experienced by pets and yard animals left behind such as dogs, backyard chickens, goats etc.153
Loss of subsistence agriculture or homegrown produce.
Cost of bottled water purchased by municipalities, other governments, relief organizations, and businesses.154
Cost of bottled water purchased by individuals – individuals impacted by accidents may choose to purchase bottled water for their household rather than rely on municipal or other water systems due to perceived or real risk of water contamination.155
Other contamination averting behaviors (e.g., such as gloves, masks, and air/water filters/purifiers; limiting of outdoor time, which may also disrupt social networks and exercise activities; and increased time and resources spent boiling tap water, washing, and cleaning).156,157
Cost of children missing school.158
6.2.9 Potential impacts to communities with environmental justice concerns
While EPA is unable to estimate the incremental changes in accident risks from the provisions of this final rule, the baseline distribution of population (see Chapter 9) suggests that the benefits of the provisions may reduce potential exposure for historically vulnerable populations. Communities within one mile and three miles of RMP facilities have higher percentages of people belonging to historically vulnerable income, race, and ethnic groups compared to the national average. The disparity is even more acute when looking at RMP facilities classified under NAICS codes 324 and 325 or by number of accidents between 2016 and 2020. Populations living closer to RMP-regulated facilities are more likely to be exposed if an accidental release occurs at an RMP facility. Thus, these releases pose a greater risk to historically vulnerable populations. Hence, EPA anticipates that provisions reducing the risk of these releases will benefit vulnerable populations. Several of the final rule provisions will prove especially helpful, including the stationary source siting requirements, increased information availability for fenceline communities, backup power for perimeter monitoring, and community notification and related response planning improvements.
6.3 Avoided Accident Impacts: A Limited Breakeven Analysis
EPA expects the final rule to reduce accident risks across the spectrum of RMP facilities and accident categories. The rule requirements are targeted at reducing both the probability and the magnitude of the full range of accident types regulated by the RMP program including fires, explosions, and releases of toxic vapors. Accident risks posed by the variety of RMP facilities in the numerous industries listed in Exhibit 3-1 should decrease, with larger impacts expected for P3 facilities and especially petroleum refineries and chemical manufacturers that meet the three conditions for STAA practicability and implementation requirements. EPA expects the provisions, especially the STAA provision, to ameliorate the upper end of the distribution of accident magnitudes so that the highest impact accidents are less likely.
Section 3.2.5 describes the number and impacts of accidents currently associated with RMP facilities based on their self-reported accident histories over 2016 to 2020. A limited set of accident impacts are monetized. These monetized values range from a low of $100 to a high of $700 million for a single accident. Important to note is that these monetized accident impacts do not reflect a major catastrophe (a low probability but very high consequence accident). However, the final rule provisions are expected to reduce the likelihood that one would occur.
While data constraints prevent EPA from conducting a benefit-cost analysis of the final rule, to provide insight into the trade-off between the costs and benefits of the final rule provisions, this RIA presents a limited breakeven analysis consisting of a simple comparison between the estimated annualized costs of the rule and the limited set of monetized baseline accident impacts. The results of this analysis should be viewed with caution. The annualized costs of the final rule (at a 3 percent discount rate) are estimated as $257 million, while average annual monetized accident impacts based on self-reported RMP facility data are estimated as $540 million. Important to note is that many baseline accident impacts are not reflected in the $540 million baseline accident cost estimate, yet these additional unmonetized impacts are expected to be avoided as a benefit of the final provisions. These impacts include taxpayer-funded responder costs, transaction costs for parties affected by the accident, property value reductions in nearby neighborhoods (which reflect the risks to residents159), unmonetized costs of evacuations and sheltering-in-place, the costs of potential health risks from exposure to toxic chemicals, and more. The $540 million estimate also does not reflect the full set of baseline inefficiencies that will be improved due to the improved information offered by several of the final provisions such as the community notification requirements and the back-up power for monitors. Finally, as explained above, the baseline estimate of costs does not include a major catastrophic loss. In light of these numerous unmonetized impacts, the estimate of baseline costs potentially reduced by the final rule is only partial.
For a sense of the potential magnitude of omitted baseline accident costs, consider estimates of the property value impacts of an RMP facility accident discussed in Section 6.2.6 and productivity losses discussed in Section 6.2.3 above. A recent nationwide hedonic property value analysis focused specifically on the impact of RMP facility accidents on residential property values (Guignet et al. 2023b).160 The research concluded that accidents with reported offsite impacts reduced the values of homes located within 5.75 km (3.57 miles) by two to three percent and that on average, the lower values persisted for about a decade. The study estimated an average loss of $5,350 per home in 2021 year values. Across the communities near the 661 facilities that experienced an offsite impact accident during the study period covering transactions between 2004 and 2019, Guignet et al. (2023b) calculated a total loss of $39.5 billion. As for productivity losses, a Marsh 2016 report observed that business interruption insurance claims in the energy sector were typically 2 to 3 times a facility’s property loss value.161 Applying such a multiplier to the annual average onsite property damages of $455 million over the 5-year period of 2016 to 2020 from RMP-related accidents included in this analysis, the annual average productivity losses would be $909 million (using a factor of 2) to $1.364 billion (using a factor of 3).
Keeping in mind the noted omissions from the $540 million estimate of annualized baseline accident impacts, the final rule will need to reduce damages valued at approximately $2 billion over any number of future accidents to achieve breakeven. Given the estimated $257 million annualized rule costs, if accident impacts are reduced by at least $257 million annually, the benefits of the rule will break even with its costs. This could mean the prevention or mitigation of a single high cost accident such as the $700 million high end accident in the 2016 to 2020 period. Or, alternatively, considering an estimated number of annual accidents of about 100 (see Exhibit 3-11) with an average cost of $5.5 million each and ignoring unquantified accident impacts, it could mean the prevention of 47 or fewer accidents per year with the number fewer depending on the value of unmonetized and information benefits.
As the range of monetized accident impacts suggests (from $100 to $700 million for 2016 to 2020), the variation in monetized damages is substantial. The estimates of monetized accident damages for the time periods for two prior RMP rules give lower averages. For example, the average per year is $473.2 million for 2004 to 2013 and is $441.7 million for 2014 to 2016. The average per accident is $2.9 million for 2004 to 2013 and is $3.2 million for 2014 to 2016.162
Also of note is the timing of costs incurred to comply with the rule versus the timing of benefits. The rule’s benefits of accident prevention and mitigation and improved information occur only after the costs incurred to implement provisions; in other words, the costs incurred today lead to benefits experienced at a later time. In some cases, the benefits may be experienced almost immediately and in other cases, they may occur many years later. For example, ensuring a community notification system is in place would be expected to result in benefits as soon as the next need for an emergency response occurs but may still provide a benefit to emergency response even a few years later. On the other hand, STAA initial evaluation and practicability assessment costs would be expected to begin resulting in accident prevention and mitigation benefits only after a facility implements risk reduction measures in response to the analyses, which may be years after the facility incurs the cost of conducting the analyses but would be expected to continue reducing accident risks for many more years to come.
Conceptually, these future benefits should be discounted similarly to how future costs are discounted. This would imply that achieving average annualized benefits of $257 million for the rule to break even within the 10-year period of analysis may require preventing slightly more than an annual average of 47 or fewer accidents, depending on how much more concentrated in later years benefits are than are costs. However, the role of timing also implies that the rule could break even within a longer period of analysis with fewer than 47 or fewer annual accidents prevented if benefits consistently exceed costs in the years following the initial decade..
When considering the rule’s likely benefits that a portion of the monetized accident impacts would be avoided, as well as additional unmonetized accident impacts, information benefits, and avoided risks of catastrophe as described above, EPA believes the costs of the rule are reasonable in comparison to anticipated benefits.
6.4 Conclusions
EPA is unable to estimate quantitative benefits for the final rule because the agency has no data to project the specific impact on potential future accidents of each final rule provision. As the data show, past accidents have generated highly variable impacts, so the impacts of future accidents are difficult to predict. However, it is clear from the RMP accident data and other data, such as hedonic property value analyses and the data reported by Marsh, that chemical accidents can impose substantial costs on firms, employees, emergency responders, the community, and the broader economy.163 The final rule’s objectives to reduce risks across the range of RMP accident types and the spectrum of RMP facilities, reduce the severity of impacts when accidents do occur, and improve information available to the public, will provide substantial benefits to potentially affected members of the public.
Exhibit 6-3 summarizes the benefit or accident cost categories described in this chapter. Four broad benefit categories are related to accident prevention and mitigation including RMP accidents, non-RMP accidents at RMP facilities, and potential major catastrophes. The exhibit explains each and identifies ten associated specific benefit categories. Exhibit 6-3 also highlights and explains the Information Availability benefit category and identifies two specific benefits associated with it. To further illustrate the nature of damages from accidents that could be avoided at RMP facilities, Section 3.2.1 describes the impacts of two recent RMP-reportable accidents.
EPA conducted a simple and limited breakeven analysis with limited data on the final rule’s benefit values because while EPA was able to quantify and monetize estimated costs of the final rule, it cannot sufficiently quantify or monetize estimated benefits. The results of this limited analysis should be viewed with caution due to the omission of key unmonetized benefits. The final rule will need to reduce, or mitigate, damages valued at approximately $257 million per year over any number of future accidents to achieve breakeven. EPA compared this cost estimate to estimates of RMP accident impacts, noting that many accident impacts could not be monetized so the comparison is limited. However, setting aside important unmonetized accident damages, and ignoring the information benefits of the rule and that no major catastrophes are represented in the baseline accident cases, if the rule prevents a single high cost accident per year or 47 accidents that imposed average costs, the rule’s benefits and costs would more than breakeven.
EPA believes that the reductions in the probability and magnitude of accidents justify the costs of the final rule. When assessing the reasonableness of the benefits and burdens of various regulatory options, EPA must place weight on both preventing more common accidental releases captured in the accident history portion of the RMP database while also placing weight on less quantifiable potential catastrophic events. The Agency’s judgment as to what regulations are “reasonable” is informed by both quantifiable and unquantifiable burdens and benefits.
Exhibit 6-3: Summary of Social Benefits.
Broad Benefit Category |
Explanation |
Specific Benefit Categories |
Accident Prevention |
Prevention of future RMP facility accidents |
|
Accident Mitigation |
Mitigation of future RMP facility accidents |
|
Non-RMP Accident Prevention and Mitigation |
Prevention and mitigation of future non-RMP accidents at RMP facilities |
|
Avoided Major Catastrophes |
Prevention of rare but extremely high consequence events |
|
Information Availability |
Provision of information to the public and emergency responders |
|
*These impacts partially overlap with several other categories.
CHAPTER 7: Regulatory Alternatives Considered
The RIA analyzed two regulatory alternatives to the final rule: one alternative with lower costs and one with higher costs. The lower-cost alternative considers alternatives for four provisions: STAA, root cause analysis, third-party audits, and employee participation. The higher-cost regulatory alternative considered includes more costly versions of the STAA and third-party audit provisions.
7.1 Lower-cost Regulatory Alternative
The lower cost regulatory alternative considers alternatives for STAA, root cause analysis, third-party audits, and employee participation plans.
7.1.1 STAA – (revisions apply to §68.3 and §68.67)
The final rule STAA provision will require a STAA initial evaluation for all complex (NAICS 324 or NAICS 325) facilities with a Program 3 process and a STAA practicability assessment and implementation of a passive-equivalent measure for those complex Program 3 facilities that have had an accident, that are within 1-mile of another complex facility, or that have an HF unit in a NAICS 324 process. The less stringent STAA provision would require only a STAA initial evaluation for all complex facilities with a Program 3 process. No facilities would be required to conduct a practicability assessment or implement any measures. The unit costs applied to the STAA provision are consistent with the unit costs presented in Exhibit 4-5. The total costs of the lower cost STAA provision are summarized in Exhibit 7-1.
Exhibit 7-1: Total Undiscounted Costs for STAA Provision
Lower Cost Regulatory Alternative (2022 Dollars).
Facility Type |
Annual Frequency |
Unit Cost |
Processes |
Total Initial Cost |
Total Year 6 Cost |
Initial Evaluation |
|||||
Refineries |
0.2 |
$73,149 |
1,535 |
$22,456,638 |
$4,042,195 |
Chemical Manufacturers |
0.2 |
$13,284 |
2,799 |
$7,436,475 |
$1,338,565 |
Subtotal |
|
|
4,334 |
$29,893,113 |
$5,380,760 |
Grand Total |
|
|
|
$29,893,113 |
$5,380,760 |
*Totals
may not sum due to rounding
7.1.2 Root Cause Analysis – (revisions apply to §§68.60 and 68.81)
The final rule revises the incident investigation provisions to require a root cause analysis following an RMP-reportable accident. The incident investigation revisions will apply to all facilities with Program 2 and 3 processes that experience an RMP-reportable accident. The lower-cost regulatory alternative would apply to only facilities with Program 3 processes that experience an RMP-reportable accident. Accident numbers are based on the RMP data from RMP-reportable accidents, referenced in Exhibit 3-8, and are estimated based on the five-year annual average. The unit costs applied to the accidents are consistent with the unit costs presented in Exhibit 4-6. The total initial cost of the lower-cost root cause analysis provision is summarized in Exhibit 7-2.
Exhibit 7-2: Total Annual Undiscounted Costs for Root Cause Analysis
Lower Cost Regulatory Alternative (2022 Dollars).
Facility Type |
Unit Cost |
Accidents |
Total Initial Cost |
P3 Accidents - simple |
$2,350 |
40 |
$94,466 |
P3 Accidents - complex |
$15,496 |
41 |
$638,448 |
Total |
|
81 |
$732,914 |
7.1.3 Third-party Audits – (revisions apply to §§68.58 and 68.79 and new §§68.59 and 68.80))
The final rule will revise the 2017 amendments rule compliance audit provision by requiring facilities with a Program 2 or 3 process having one accident, to contract with a third-party to conduct the next scheduled compliance audit. The lower-cost alternative would revise the 2017 amendments rule compliance audit provisions by requiring only Program 2 and 3 facilities with two RMP-reportable accidents within five years to contract with a third-party to conduct the next scheduled compliance audit.
Exhibit 7-3 presents the number of Program 2 and 3 facilities by facility type and size with multiple RMP-reportable accidents during the 2016-2020 five-year period, based on RMP data. The unit costs applied to the third-party audit alternative are consistent with the unit costs presented in Exhibit 4-7. The total cost of the lower-cost third-party audit provision is summarized in Exhibit 7-3.
Exhibit 7-3: Total Annual Undiscounted Costs for Third-party Audits
Lower Cost Regulatory Alternative (2022 Dollars).
Facility Type |
Annual Accident Frequency |
Unit Cost |
Facilities |
Total Initial Cost |
Simple w/ 0-19 FTEs |
1 |
$44,758 |
5 |
$223,792 |
Simple w/ 20-99 FTEs |
1 |
$50,091 |
4 |
$200,364 |
Simple w/ 100+ FTEs |
1 |
$52,640 |
11 |
$579,043 |
Complex w/ 0-19 FTEs |
1 |
$107,694 |
1 |
$107,694 |
Complex w/ 20-99 FTEs |
1 |
$114,563 |
5 |
$572,816 |
Complex w/ 100+ FTEs |
1 |
$118,246 |
32 |
$3,807,505 |
Small Government |
1 |
$46,826 |
2 |
$93,651 |
Large Government |
1 |
$121,480 |
1 |
$121,480 |
Total |
|
|
61 |
$5,706,345 |
7.1.4 Employee Participation – (revisions apply to §68.83)
EPA is revising employee participation requirements for owners and operators of regulated facilities with Program 3 processes. The final rule will require that the employee participation plan include consultation of employees and their representatives on addressing, correcting, resolving, documenting, and implementing recommendations or findings of process hazard analyses, incident investigations, and compliance audits, at a minimum. In addition, the final rule will require that the Program 3 employee participation plan include and ensure that effective methods are in place so that 1) employees knowledgeable in the process and their representatives have the authority to recommend to the operator in charge of a unit that an operation or process be partially or completely shut down, and 2) a qualified operator in charge of a unit may partially or completely shut down an operation or process, based on the potential for a catastrophic release. EPA is requiring that an employee participation plan for Program 2 and Program 3 processes include explicit language addressing worker participation and reporting, along with information on how to report RMP-reportable accidents or related RMP non-compliance issues. Last, EPA is requiring that Program 2 and 3 facilities train employees on the employee participation plan.
The
lower-cost regulatory alternative will add provisions to the employee
participation requirements only for owners and operators of regulated
facilities with Program 3 processes and will not require training. To
estimate the cost of this option, EPA applied the unit cost estimates
from Exhibit 4-9 to facilities with Program 3 processes. The total
cost estimate is presented in Exhibit 7-4.
Exhibit 7-4: Total Annual Undiscounted Costs for Employee Participation Plan
Lower Cost Regulatory Alternative (2022 Dollars).
Facility Type |
Annual Frequency |
Unit Cost |
Facilities |
Total Initial Cost |
Simple |
1 |
$59 |
5,578 |
$327,801 |
Complex |
1 |
$83 |
1,527 |
$126,612 |
Total |
|
|
7,105 |
$454,413 |
7.2 Higher Cost Regulatory Alternative
The higher-cost regulatory alternative includes more stringent STAA and third-party audit provisions than the final rule, combined with all other final rule provisions.
The more stringent STAA provisions would require a STAA initial and practicability analysis and implementation of a passive-equivalent measure for all complex (NAICS 324 or NAICS 325) facilities with a Program 3 process. The unit costs applied to the STAA provisions are consistent with the unit costs presented in Exhibits 4-5 and 4-6. The total annual costs of the higher-cost STAA provisions are summarized in Exhibits 7-5, 7-6, and 7-7.
Exhibit 7-5: Total Annual Undiscounted Costs for STAA Initial Evaluation and Practicability Assessment Provision Higher Cost Regulatory Alternative (2022 Dollars).
Facility Type |
Annual Frequency |
Unit Cost |
Units |
Total Initial Cost |
Total Year 6 Cost |
Initial Evaluation |
|||||
Refineries |
0.2 |
$73,149 |
1,535 |
$22,456,638 |
$4,042,195 |
Chemical Manufacturers |
0.2 |
$13,284 |
2,799 |
$7,436,475 |
$1,338,565 |
Subtotal |
|
|
4,334 |
$29,893,113 |
$5,380,760 |
Practicability Analysis |
|||||
Refineries – HF |
0.2 |
$4,390,674 |
42 |
$36,881,660 |
$6,638,699 |
Refineries – Non-HF |
0.2 |
$306,326 |
92 |
$5,636,400 |
$1,014,552 |
Chemical Manufacturers |
0.2 |
$33,550 |
1,355 |
$9,092,050 |
$1,636,569 |
Subtotal |
|
|
1,489 |
$51,610,109 |
$9,289,820 |
Grand Total |
|
|
|
$81,503,222 |
$14,670,580 |
*Totals
may not sum due to rounding
Exhibit 7-6: Total Annual Undiscounted Costs for STAA Implementation Provision Higher Cost Regulatory Alternative Years 1-5 (2022 dollars).
Facility Type |
Capital Cost Annual Frequency |
Unit Capital Cost |
Unit Recurring Cost |
Facilities |
Total Annual Cost in Year: |
||||
1 |
2 |
3 |
4 |
5 |
|||||
Refineries |
0.2 |
$4,449,414 |
$177,977 |
138 |
$127,715,968 |
$132,628,120 |
$137,540,273 |
$142,452,425 |
$147,364,578 |
Chemical Manufacturers |
0.2 |
$546,494 |
$21,860 |
1,376 |
$156,411,007 |
$162,426,815 |
$168,442,623 |
$174,458,431 |
$180,474,239 |
Total |
|
|
|
1,514 |
$284,126,974 |
$295,054,935 |
$305,982,896 |
$316,910,856 |
$327,838,817 |
*Totals may not sum due to rounding.
Exhibit 7-7: Total Annual Undiscounted Costs for STAA Implementation Provision Higher Cost Regulatory Alternative Years 6-10 (2022 dollars).
Facility Type |
Capital Cost Annual Frequency |
Unit Capital Cost |
Unit Recurring Cost |
Facilities |
Total Annual Cost in Year: |
||||
6 |
7 |
8 |
9 |
10 |
|||||
Refineries |
0.2 |
$4,449,414 |
$177,977 |
138 |
$152,276,731 |
$157,188,883 |
$162,101,036 |
$167,013,188 |
$171,925,341 |
Chemical Manufacturers |
0.2 |
$546,494 |
$21,860 |
1,376 |
$186,490,047 |
$192,505,855 |
$198,521,662 |
$204,537,470 |
$210,553,278 |
Total |
|
|
|
1,514 |
$338,766,777 |
$349,694,738 |
$360,622,698 |
$371,550,659 |
$382,478,619 |
*Totals may not sum due to rounding.
The more stringent third-party audit provision would require all scheduled compliance audits at facilities with Program 3 processes to be conducted every three years by a contracted third party. The analysis projects that one-third of affected facilities would, therefore, conduct a third-party audit every year. The unit costs applied to the third-party audit alternative are consistent with the unit costs presented in Exhibit 4-8. The total costs of the higher-cost third-party compliance provision are summarized in Exhibit 7-8.
Exhibit 7-8: Total Annual Undiscounted Costs for Third-party Audits
Higher Cost Regulatory Alternative (2022 Dollars).
Facility Type |
Annual Frequency |
Unit Cost |
Facilities |
Total Initial Cost |
Simple w/ 0-19 FTEs |
0.33 |
$44,758 |
1,383 |
$20,633,615 |
Simple w/ 20-99 FTEs |
0.33 |
$50,091 |
1,313 |
$21,923,124 |
Simple w/ 100+ FTEs |
0.33 |
$52,640 |
2,230 |
$39,129,246 |
Complex w/ 0-19 FTEs |
0.33 |
$107,694 |
271 |
$9,728,398 |
Complex w/ 20-99 FTEs |
0.33 |
$114,563 |
679 |
$25,929,465 |
Complex w/ 100+ FTEs |
0.33 |
$118,246 |
577 |
$22,742,553 |
Small Government |
0.33 |
$46,826 |
632 |
$9,864,600 |
Large Government |
0.33 |
$121,480 |
20 |
$809,867 |
Total |
|
|
7,105 |
$150,760,867 |
7.3 Summary of Regulatory Alternatives
EPA compared the total cost of the regulatory alternatives to the final rule. Each regulatory alternative consists of the alternative provisions presented above, combined with all other final rule provisions. The analysis presents total costs as total undiscounted costs over the 10-year period of analysis, total discounted (3 percent and 7 percent), and annualized (3 percent and 7 percent). When annual costs for different years are equal across the analysis period, the annualized costs calculated using rates (e.g., 3 and 7 percent) are equal. Exhibit 7-9 summarizes the costs and highlights the provisions that are different from the final rule under each regulatory alternative.
As described in Chapter 5, EPA estimates the final rule will cost $256.9 million (annualized 3 percent) or $296.9 (annualized 7 percent). The lower-cost regulatory alternative would cost $48.4 million (annualized 3 percent) or $50.5 million (annualized 7 percent). The higher-cost regulatory alternative would cost $567.2 million (different discount annualized at 3 percent) or $642.2 million (annualized at 7 percent).
Because EPA does not quantify the benefits of the regulatory alternatives, EPA assumes that the benefits will move higher or lower qualitatively with the stringency of the alternatives considered. Therefore, EPA believes a reduction in regulatory measures under the lower-cost alternative would be associated with reduced lower benefits and that the higher-cost alternatives would increase result in higher benefits than would the final rule. In selecting between the alternatives, EPA has tried to balance new prevention program requirements with costs incurred by the regulated community.
Exhibit 7-9: Annualized Estimated Costs of Regulatory Alternatives
Compared to Final Rule (millions, 2022 Dollars).
Cost Elements |
Low-Cost Regulatory Alternative (Annualized) |
Final Rule (Annualized) |
High-Cost Regulatory Alternative (Annualized) |
|||
|
3% |
7% |
3% |
7% |
3% |
7% |
Rule Familiarization |
$5.8 |
$6.8 |
$5.8 |
$6.8 |
$5.8 |
$6.8 |
STAA |
||||||
Initial Evaluation |
$18.5 |
$19.7 |
$18.5 |
$19.7 |
$18.5 |
$19.7 |
Practicability |
None |
None |
$27.0 |
$28.6 |
$32.0 |
$34.0 |
Implementation |
None |
None |
$168.7 |
$204.9 |
$330.6 |
$401.6 |
Root Cause Analysis |
$0.7 |
$0.7 |
$0.8 |
$0.8 |
$0.8 |
$0.8 |
Third-party Audits |
$5.7 |
$5.7 |
$7.5 |
$7.5 |
$150.8 |
$150.8 |
Employee Participation Plan |
$0.5 |
$0.5 |
$11.5
|
$11.5 |
$11.5 |
$11.5 |
Backup Power for Perimeter Monitor |
$0.3 |
$0.3 |
$0.3 |
$0.3 |
$0.3 |
$0.3 |
No Backup Power** |
$0.0 |
$0.0 |
$0.0 |
$0.0 |
$0.0 |
$0.0 |
Natural Hazards** |
$0.0 |
$0.0 |
$0.0 |
$0.0 |
$0.0 |
$0.0 |
Stationary Source Siting** |
$0.0 |
$0.0 |
$0.0 |
$0.0 |
$0.0 |
$0.0 |
RAGAGEP** |
$0.0 |
$0.0 |
$0.0 |
$0.0 |
$0.0 |
$0.0 |
Community Notification |
$4.0 |
$4.0 |
$4.0 |
$4.0 |
$4.0 |
$4.0 |
Information Availability |
$12.8 |
$12.8 |
$12.8 |
$12.8 |
$12.8 |
$12.8 |
Total Cost* |
$48.4 |
$50.5 |
$256.9 |
$296.9 |
$567.2 |
$642.2 |
*Totals may not sum due to rounding.
** Costs are zero due to rounding, Unrounded costs are $15,798 for No Backup Power, $42,307 each for Natural Hazards and Stationary Source Siting, and $27,582 for RAGAGEP both at 3% and 7% discount rates.
EPA also conducted breakeven analyses for the two regulatory alternatives to give a sense of the decline in damages from accidents that will be needed to equal, or offset, the estimated costs of the final rule under each alternative. Under the lower-cost alternative, annualized costs are approximately $48 or $51 million at discount rates of 3% and 7% respectively, and annualized costs are $567 or $642 million at 3% and 7% respectively for the higher-cost alternative. For the lower-cost regulatory alternative to breakeven on an annual basis given estimated annualized costs of approximately $50 million and an estimated number of annual accidents of about 100, fewer than approximately 9 accidents per year, each with average monetized damages of approximately $5.5 million as estimated for the most recent five-year baseline period, will need to be prevented. For the final rule under the higher-cost regulatory alternative to breakeven on an annual basis given estimated annualized costs of approximately $600 million and an estimated number of annual accidents of about 100, approximately all accidents, each with average monetized damages of approximately $5.5 million as estimated for the most recent five-year baseline period, will need to be prevented. Keep in mind that EPA expects that, relative to the final rule, the number of accidents will be higher with provisions under the lower-cost alternative and will be lower with more stringent provisions under the higher-cost alternative.
The numbers of prevented accidents needed to break even will depend again on the value of the unquantified accident damages that will be avoided, including the value of avoided health risks of exposure to toxic chemicals, lost productivity, responder costs, transaction costs, negative impacts on property values, environmental damages, unquantified evacuation and shelter-in-place costs, and damages related to catastrophic releases.
CHAPTER 8: Small Entity Analysis
The Regulatory Flexibility Act (RFA), as amended (5 U.S.C. 601-612), requires agencies to determine whether a rule will have a “significant economic impact on a substantial number of small entities.” The Small Business Administration (SBA) sets the standard for defining a small entity by 5 or 6-digit NAICS code, for businesses (13 CFR part 121); governments are considered small if they serve fewer than 50,000 residents.164 Although “significant economic impact” is not defined by either the RFA or SBA, EPA guidance provides example thresholds of one percent and three percent of revenues.165 This analysis, however, uses the more stringent one percent threshold because almost 30 percent of the small entities affected by the rule are agricultural chemical distributors; data from the Department of Agriculture indicates that net income in this sector is less than three percent of sales.166
This chapter presents the analysis of impacts of the rule on small entities. The first section discusses the industrial sectors reported by RMP facilities. The second section describes the approach to determining how many facilities and firms subject to the rule are small based on SBA size standards. The third section discusses the economic impacts of the rule on small entities.
8.1 RMP Affected Sectors
The RMP rule affects a broad range of sectors (facilities listed in RMP filings are classified into 198 NAICS codes). These facilities are owned by small entities in 303 NAICS codes. The primary sectors subject to the rule and the SBA size standards for defining a small parent entity are shown in Exhibit 8-1.167 A dollar value size standard refers to firm revenues in millions; the full-time-equivalent employees applies to the firm’s total FTE, not the number at any one facility belonging to that entity. For governments, the size standard is based on the population served by the government entity. The NAICS codes are presented at the 2- to 6-digit level based on whether the SBA size standard varies for the 5- and 6-digit codes and whether there are a substantial number of RMP facilities in the sector.168 For example, the SBA size standard for the wholesale trade sector, NAICS 111, is the same across all codes ($1 million).
Exhibit 8-1: SBA Industry Sector Small Entity Size Standards.
NAICS |
Sector |
Size Standard |
111 |
Crop Production |
$1.0 million |
112 |
Animal Production and Aquaculture |
$1.0 -$16.5 million |
115 |
Support Activities for Agriculture and Forestry |
$8 - $30 million |
211111 |
Crude Petroleum and Natural Gas Extraction |
1,250 FTE |
221112 |
Fossil Fuel Electric Power Generation |
750 FTE |
22131 |
Water Supply and Irrigation Systems |
$30 million |
22132 |
Sewage Treatment Facilities |
$22 million |
3111 |
Animal Food Manufacturing |
500 - 1,000 FTE |
3112 |
Grain and Oilseed Milling |
500 - 1,000 FTE |
3113 |
Sugar and Confectionery Product Manufacturing |
750 - 1,250 FTE |
3114 |
Fruit and Vegetable Preserving and Specialty Food Manufacturing |
750 - 1,250 FTE |
3115 |
Dairy Product Manufacturing |
750 - 1,250 FTE |
3116 |
Animal Slaughtering and Processing |
750 - 1,250 FTE |
3117 |
Seafood Product Preparation and Packaging |
750 FTE |
3118 |
Bakeries and Tortilla Manufacturing |
500 - 1,250 FTE |
3119 |
Other Food Manufacturing |
500 - 1,250 FTE |
3121 |
Beverage Manufacturing |
750 - 1,250 FTE |
322 |
Paper Manufacturing |
500 - 1,500 FTE |
32411 |
Petroleum Refineries |
1,500 FTE |
3254 |
Pharmaceutical and Medicine Manufacturing |
1,000 - 1,250 FTE |
3255 |
Paint, Coating, and Adhesive Manufacturing |
500 - 1,000 FTE |
3256 |
Soap, Cleaning Compound, and Toilet Preparation Manufacturing |
750 - 1,250 FTE |
3259 |
Other Chemical Product and Preparation Manufacturing |
500 - 1,500 FTE |
326 |
Plastics and Rubber Products Manufacturing |
500 - 1,500 FTE |
327 |
Nonmetallic Mineral Product Manufacturing |
500 - 1,500 FTE |
331 |
Primary Metal Manufacturing |
500 - 1,500 FTE |
332 |
Fabricated Metal Product Manufacturing |
500 - 1,500 FTE |
333 |
Machinery Manufacturing |
500 - 1,500 FTE |
334 |
Computer and Electronic Product Manufacturing |
500 - 1,250 FTE |
335 |
Electrical Equipment, Appliance, and Component Manufacturing |
500 - 1,500 FTE |
336 |
Transportation Equipment Manufacturing |
1,000 - 1,500 FTE |
337 |
Furniture and Related Product Manufacturing |
500 - 1,000 FTE |
339 |
Miscellaneous Manufacturing |
500 - 1,000 FTE |
42 |
Wholesale Trade |
100 - 250 FTE |
44422 |
Nursery, Garden Center, and Farm Supply Stores |
$12 million |
45431 |
Fuel Dealers |
100 FTE |
48691 |
Pipeline Transportation of Refined Product |
1,500 FTE |
48821 |
Support Activities for Rail Transportation |
$16.5 million |
8.2 Estimating the Number of Small Entities
This analysis of small entities is based on a unique list of entities associated with the current universe of RMP regulated facilities. To create the unique list, EPA relied on (1) data from Data Axle, a business data provider, which indicated the company name or parent company name based on facility addresses, and (2) parent company names from the RMP Database. In response to multiple commenters, EPA completed a second analysis with data from D&B Hoovers, which can be found in Appendix C. The objective is to compare the conclusions drawn from the two different data sources. The RMP Database provides facility-level counts of employees and NAICS codes for processes within the facility; however, the small entity classification requires data on all employees, or revenue for sectors with a revenue size standard, across all locations owned by the entity or entity’s parent company. In addition, the appropriate NAICS code for the small entity analysis is not necessarily the NAICS code associated with the RMP process, but the one associated with the largest source of revenue for the entity or parent company. For example, an entity in the pipeline transportation sector, NAICS 486, owns a facility in NAICS 324, and therefore will face STAA costs. Therefore, for each unique business, EPA retrieved data from Data Axle on the revenue, NAICS code, and employee count for each entity, parent company, or corporate entity as appropriate. A summary of the number of facilities, the number of unique entities, the breakdown of private sector and government entities, and their size classifications is provided in Exhibit 8-2. The breakdown of small and non-small private sector entities differs slightly from the breakdown in the proposed rule RIA, Exhibit C-1, due to the use of updated SBA size standards in the final rule analysis.
Exhibit 8-2: RMP Facility and Entity Counts.
|
Number |
Percent of |
Total Facilities |
11,740 |
|
Total Entities |
5,649 |
|
Private Sector Entities |
4,538 |
80% of total entities |
Small |
2,636 |
58% of private sector entities |
Non-small |
1,902 |
42% of private sector entities |
Government Entities |
1,111 |
20% of total entities |
Small |
630 |
57% of government entities |
Non-small |
481 |
43% of government entities |
EPA identified 5,649 unique entities owning RMP regulated facilities. Of those 5,649 unique entities, EPA was able to determine that 1,111 (20 percent) are government entities and the remaining 4,538 (80 percent) are private sector entities.
8.2.1 Private Sector Entities
Of the 4,538 private sector entities, EPA was able to obtain data matches of revenue and/or employee data for 3,123. EPA then classified each private sector entity as small or non-small based on the SBA size standard for the entity’s NAICS code and the relevant employee- or revenue-based size standard. EPA determined that of the total 4,548 private sector entities, 2,636 private sector entities are small, and of those, 1,776 are small based on their employee or revenue data using Data Axel data. These small private sector entities have an average of 129 employees and average annual revenue of approximately $68.1 million. The size classification of the remaining 860 private sector small entities was determined through additional analysis described below. Further discussion of small entities refers to only small private sector small entities, there no nonprofits in the population. Government small entities are discussed in sections 8.2.2 and 8.3.2.
To assess the remaining unmatched entities (1,306), EPA extrapolated the results of the size classification. At the 3-digit NAICS level, EPA estimated the percent of small and non-small entities and assumed that unmatched entities within those NAICS codes will have the same distribution of small and non-small. For example, in NAICS sector 424 (Merchant Wholesalers, Nondurable Goods) there are 979 total parent entities. Of those, 309 were classified as small, 223 as non-small, and 447 did not have employee data to classify. To classify the 447 entities as small or non-small the percent of small entities in the matched data (58.1 percent or 309 out of 532) was used to classify 260 of the 447 unmatched entities as small. Across all sectors, 860 unmatched entities were classified as small and 555 unmatched entities were classified as non-small. The totals presented in Exhibit 8-2 above, therefore represent the 1,776 classified as small using Data Axle data and the estimated 860 entities classified as small using the extrapolation analysis, resulting in 2,636 total small private sector entities (58 percent of private sector entities).
Exhibit 8-3 presents an analysis of facilities and the size of entity they are associated with to provide an understanding of the distribution of private sector owned facilities by program level. The results show that Program 3 has a larger proportion of facilities owned by non-small private sector entities than Program 2 and facilities. That is, almost 65 percent of Program 3 facilities (4,148 of 6,422) are owned by a non-small private sector entity compared to 51 percent of Program 2 facilities (1,612 of 3,162) and 48 percent of Program 1 facilities (310 out of 651).
Exhibit 8-3: Analysis of Private Sector Facility Ownership by Program Level.
|
Number of P1 Facilities |
Number of P2 Facilities |
Number of P3 Facilities |
Total Facilities |
660 |
3,975 |
7,105 |
# of facilities owned by: Private Sector Entities |
651 |
3,162 |
6,422 |
Small |
341 |
1,550 |
2,274 |
Non-small |
310 |
1,612 |
4,148 |
Exhibit 8-4 presents the top ten six-digit NAICS sectors with the largest share of small entities relative to other sectors. Percentages were derived from the number of matched entities from each NAICS, as described above. Most small employers fall within the Farm Supplies Merchant Wholesalers industry, comprising 8 percent of all small entities, followed by the Farm Product Warehousing and Storage industry, comprising 5 percent of all small entities. No one industry makes up a significant share of the small entities impacted by this rule.
Exhibit 8-4: Distribution of Small Employers by Top 10 6-Digit NAICS Code.
NAICS Code |
Description |
Number of Matched Entities |
Share of Small Employers by NAICS |
424910 |
Farm Supplies Merchant Wholesalers |
146 |
8.2% |
493130 |
Farm Product Warehousing and Storage |
96 |
5.4% |
444220 |
Nursery and Garden Centers |
60 |
3.4% |
493120 |
Refrigerated Warehousing and Storage |
57 |
3.2% |
424690 |
Other Chemical and Allied Products Merchant Wholesalers |
53 |
3.0% |
325998 |
All Other Miscellaneous Chemical Product and Preparation Manufacturing |
48 |
2.7% |
424720 |
Petroleum and Petroleum Products Merchant Wholesalers (except Bulk Stations and Terminals) |
44 |
2.5% |
211120 |
Crude Petroleum Extraction |
41 |
2.3% |
221118 |
Other Electric Power Generation |
38 |
2.1% |
325311 |
Nitrogenous Fertilizer Manufacturing |
31 |
1.7% |
All other NAICS codes |
1,162 |
65.4% |
|
8.2.2 Government Entities
The RFA defines small governments as governments of cities, counties, towns, townships, villages, school districts, or special districts, with a population of fewer than 50,000.169 Most governmental RMP facilities are water and wastewater treatment systems and listed a city or county as the owner entity. A check of budgets that were available for some of the smallest cities indicated that the systems (1) are sub agencies of the city/county and (2) obtain some revenues from the general fund, although most of their revenues are derived from user fees. EPA checked the 2019 population estimates from the Census for the associated city or county to identify which facilities belong to small governments. For government entities that owned multiple facilities, the combined population of the facility cities or towns was used for classification. Government entities were classified as small if the population was fewer than 50,000. Based on the Census data, 630 of the total 1,111 government entities are small (57 percent).
Exhibit 8-5 presents an analysis of facilities and the size of entity they are associated with to provide an understanding of the distribution of government owned facilities by program level. Just over 48 percent of Program 3 facilities (331 facilities out of 683) are owned by non-small government sector entities compared to 45 percent of Program 2 facilities (369 facilities out of 813). There are few Program 1 government-owned facilities.
Exhibit 8-5: Analysis of Government Sector Facility Ownership by Program Level.
|
Number of P1 Facilities |
Number of P2 Facilities |
Number of P3 Facilities |
Total Facilities |
660 |
3,975 |
7,105 |
# of facilities owned by: Government Entities |
9 |
813 |
683 |
Small |
2 |
444 |
352 |
Non-small |
7 |
369 |
331 |
8.3 Economic Impact on Small Entities
To understand the distribution of impacts on small entities, EPA estimated the cost for each facility to comply with the final rule. This was done by applying cost estimates for the following cost categories to facilities in the affected universe, per facility or per process:
Rule Familiarization
STAA
Root Cause Analysis
Third-Party Audits
Employee Participation Plan
Employee Participation Plan Training
Translation
Emergency Backup Power
Justifications
Community Notification Plan
Information Availability
The costs used for each cost category are consistent with the costs described in Chapter 4: Unit Costs of Final Rule Provisions. EPA provides a summary of relevant NAICS codes for provisions with a smaller number of impacted sectors in Exhibit 8-6.170 After calculating the cost for each facility to comply with the final rule, the costs for all facilities owned by each unique small entity were summed to estimate the total impact to each small parent entity. These costs were then compared to revenue data for each small entity to develop an estimate of the percent of revenue impacted. EPA takes a conservative approach to estimating costs for small entities by assuming that facilities will face all costs in the same year (the first year). That is, if a facility incurs costs from a provision that does not necessarily occur in the first year (such as third-party audits, which will occur when the next compliance audit is due, or STAA, which will occur in a year prior to the PHA), the analysis assumed that an annual cost of those provisions occurs in the first year when other costs such as rule familiarization occur. In practice, facilities are not likely to face costs of every provision in the first year. An additional conservative assumption, discussed in more detail in Section 5.1.3, is that capital costs are not amortized for facilities.
To estimate the number of impacted small businesses with RMP-reportable accidents between 2016 and 2020 (n=488 accidents, 382 among unique facilities), EPA used the percent (%) of affected facilities that are small businesses for each NAICS code (small entities divided by total RMP regulated facilities in that NAICS code for 2020) and applied this percentage to the number of facilities with accidents in that sector between 2016 and 2020. Using this method, EPA estimates that 2% (n=8) of the facilities with accidents subject to this regulation may be small businesses. Of these, 50% (n=4) are in NAICS 324 and 325.
Exhibit 8-6: Impact on Small Private Sector Entities by Provision and NAICS.
Provision |
Impacted Entity NAICS Code* |
Impacted Entity Sector Description |
Average Cost Per Impacted Entity |
Number of Small Entities |
Root Cause Analysis |
311 |
Food Manufacturing |
$2,350 |
1 |
325 |
Chemical Manufacturing |
$30,993 |
3 |
|
327 |
Nonmetallic Mineral Product Manufacturing |
$2,350 |
1 |
|
331 |
Primary Metal Manufacturing |
$2,350 |
1 |
|
424 |
Merchant Wholesalers, Nondurable Goods |
$2,350 |
1 |
|
523 |
Securities, Commodity Contracts, and Other Financial Investments and Related Activities |
$2,350 |
1 |
|
Community Notification System |
Many** |
|
$221 - $2,500**** |
1,682 |
Employee Participation Plan |
Many** |
|
$59 - $495**** |
1,682 |
Third-Party Audit |
221 |
Utilities |
$50,091 |
1 |
311 |
Food Manufacturing |
$52,640 |
1 |
|
324 |
Petroleum and Coal Products Manufacturing |
$118,246 |
2 |
|
325 |
Chemical Manufacturing |
$111,460 |
13 |
|
327 |
Nonmetallic Mineral Product Manufacturing |
$52,640 |
1 |
|
332 |
Fabricated Metal Product Manufacturing |
$118,246 |
1 |
|
493 |
Warehousing and Storage |
$50,091 |
1 |
|
523 |
Securities, Commodity Contracts, and Other Financial Investments and Related Activities |
$116,404 |
2 |
|
Information Availability |
Many*** |
|
$185 - $14,879**** |
1,740 |
Rule Familiarization |
Many*** |
|
$553 - $79,973**** |
1,740 |
STAA |
211 |
Oil and Gas Extraction |
$2,267,877 |
5 |
213 |
Support Activities for Mining |
$626,406 |
1 |
|
236 |
Construction of Buildings |
$626,406 |
2 |
|
238 |
Specialty Trade Contractors |
$626,406 |
7 |
|
314 |
Textile Product Mills |
$639,690 |
1 |
|
321 |
Wood Product Manufacturing |
$319,845 |
2 |
|
324 |
Petroleum and Coal Products Manufacturing |
$3,549,005 |
9 |
|
325 |
Chemical Manufacturing |
$835,948 |
105 |
|
326 |
Plastics and Rubber Products Manufacturing |
$630,834 |
3 |
|
332 |
Fabricated Metal Product Manufacturing |
$652,975 |
4 |
|
335 |
Electrical Equipment, Appliance, and Component Manufacturing |
$13,284 |
3 |
|
423 |
Merchant Wholesalers, Durable Goods |
$2,282,843 |
4 |
|
424 |
Merchant Wholesalers, Nondurable Goods |
$658,262 |
46 |
|
441 |
Motor Vehicle and Parts Dealers |
$626,406 |
1 |
|
446 |
Health and Personal Care Stores |
$626,406 |
1 |
|
486 |
Pipeline Transportation |
$7,471,600 |
1 |
|
523 |
Securities, Commodity Contracts, and Other Financial Investments and Related Activities |
$631,388 |
8 |
|
524 |
Insurance Carriers and Related Activities |
$2,565,404 |
2 |
|
541 |
Professional, Scientific, and Technical Services |
$1,288,981 |
10 |
|
561 |
Administrative and Support Services |
$626,406 |
1 |
|
Backup Power for Perimeter Monitors |
211 |
Oil and Gas Extraction |
$3,300 |
2 |
213 |
Support Activities for Mining |
$3,300 |
1 |
|
221 |
Utilities |
$3,300 |
3 |
|
238 |
Specialty Trade Contractors |
$3,300 |
1 |
|
311 |
Food Manufacturing |
$3,300 |
10 |
|
321 |
Wood Product Manufacturing |
$3,300 |
1 |
|
322 |
Paper Manufacturing |
$3,300 |
2 |
|
325 |
Chemical Manufacturing |
$3,960 |
10 |
|
326 |
Plastics and Rubber Products Manufacturing |
$4,950 |
4 |
|
327 |
Nonmetallic Mineral Product Manufacturing |
$3,300 |
2 |
|
332 |
Fabricated Metal Product Manufacturing |
$3,300 |
1 |
|
333 |
Machinery Manufacturing |
$3,300 |
2 |
|
334 |
Computer and Electronic Product Manufacturing |
$3,300 |
2 |
|
339 |
Miscellaneous Manufacturing |
$3,300 |
1 |
|
424 |
Merchant Wholesalers, Nondurable Goods |
$7,920 |
5 |
|
443 |
Electronics and Appliance Stores |
$3,300 |
1 |
|
445 |
Food and Beverage Stores |
$3,300 |
2 |
|
484 |
Truck Transportation |
$3,300 |
1 |
|
486 |
Pipeline Transportation |
$6,050 |
6 |
|
488 |
Support Activities for Transportation |
$3,300 |
1 |
|
493 |
Warehousing and Storage |
$3,300 |
1 |
|
517 |
Telecommunications |
$3,300 |
1 |
|
523 |
Securities, Commodity Contracts, and Other Financial Investments and Related Activities |
$3,300 |
1 |
|
531 |
Real Estate |
$3,300 |
3 |
|
541 |
Professional, Scientific, and Technical Services |
$3,300 |
3 |
|
Justification |
Many***** |
|
$46 - $366**** |
1,045 |
Translation |
Many*** |
|
$1,400 - $15,000**** |
1,740 |
Employee Participation Plan Training |
Many** |
|
$171 - $76,539**** |
* 3-digit NAICS codes are based on the entity owning RMP facilities, which may be different from the RMP facility 3-digit NAICS.
** The provision impacts all small entities owning P2 and P3 facilities, encompassing 72 NAICS sectors.
*** The provision impacts all small entities, encompassing 73 NAICS sectors.
**** Range is an average small entity provision cost across NAICS codes.
***** The provision impacts all small entities owning P3 facilities, encompassing 65 NAICS sectors.
8.3.1 Cost Impacts on Private Sector Small Entities
The results of the analysis for private sector small entities are presented in Exhibit 8-7, below. The analysis found that 90.8 percent of small entities will incur estimated cost impacts that are less than 1 percent of their revenue and an estimated 2.8 percent of small entities are assumed to be impacted at the greater than 3 percent level. Combined, only 9.2 percent of small private sector entities are assumed to be impacted at the greater than 1 percent level. Another way to express this is that of the total estimated 2,636 small private sector entities, an estimated 2,393 entities will be impacted at less than 1 percent of revenue, 167 entities will be impacted at between 1 percent and 3 percent of revenue, and 75 will be impacted at greater than 3 percent of revenue.
Exhibit 8-7: Cost Impacts as a Proportion of Total Revenue for
Small Private Sector Entities.
Proportion of Revenue Impacted |
Number of Small Entities* |
% of Small Entities |
Average Small Entity Cost** |
Average Small Entity Revenue** |
< 1% |
2,393 |
90.8% |
$72,525 |
$72,392,517 |
1% - 3% |
167 |
6.3% |
$629,271 |
$41,222,630 |
>3% |
75 |
2.8% |
$1,083,823 |
$19,034,833 |
*Small entity count differs slightly from Exhibit 8-2 due to rounding.
** For entities in NAICS codes with revenue-based size-standards, the average small entity cost and revenue are considerably lower ($31,500 and $6.0 million, respectively)
Exhibit 8-8 presents the distribution of small entity revenue impacts across six-digit NAICS sectors, with the top ten highlighted from the remaining NAICS sectors. The proportion of revenue impacted was calculated for small entities with revenue data (1,776). This is fewer than the total number of small entities affected by the rule (2,636) and analyzed above because the extrapolation exercise described in Section 8.2.1 was done at the 3-digit NAICS level. Most 6-digit NAICS codes have too few entities from which to reasonably extrapolate. Thus, EPA focused the analysis of revenue impacts by 6-digit NAICS sectors on only those entities with matched revenue data. Exhibit 8-8 shows the number of matched entities for each of the top ten sectors designated as small, as well as the remaining sectors for which these small entities had corresponding six-digit NACIS information. The NAICS subsector 325998 has a larger percentage of entities with revenue impact greater than 3 percent. This can be explained by the SBA size standards and entity revenue. This subsector has a lower size standard than the other NAICS 325 sectors, with a limit of 500 employees versus 1,000+ employees for other subsectors, meaning more entities were qualified as small. As a result, the subsector's average revenue is lower than the other NAICS 325 sectors entities, which increases the proportion of revenue impacted for this particular subsector.
Exhibit 8-8: Revenue Impacts by 6-digit NAICS Code for Small Entities with Matched Data.
NAICS Code
|
NAICS Description
|
Number of Matched Entities |
Proportion of Revenue Impacted |
||
< 1% |
1% - 3% |
>3% |
|||
424910 |
Farm Supplies Merchant Wholesalers |
146 |
93% |
6% |
1% |
493130 |
Farm Product Warehousing and Storage |
96 |
95% |
5% |
0% |
444220 |
Nursery and Garden Centers |
60 |
93% |
5% |
2% |
493120 |
Refrigerated Warehousing and Storage |
57 |
96% |
2% |
2% |
424690 |
Other Chemical and Allied Products Merchant Wholesalers |
53 |
86% |
14% |
0% |
325998 |
All Other Miscellaneous Chemical Product and Preparation Manufacturing |
48 |
67% |
24% |
9% |
424720 |
Petroleum and Petroleum Products Merchant Wholesalers (except Bulk Stations and Terminals) |
44 |
100% |
0% |
0% |
211120 |
Crude Petroleum Extraction |
41 |
94% |
3% |
3% |
221118 |
Other Electric Power Generation |
38 |
100% |
0% |
0% |
325311 |
Nitrogenous Fertilizer Manufacturing |
31 |
74% |
19% |
6% |
All Other |
1,162 |
90% |
6% |
4% |
|
8.3.2 Cost Impacts on Government Small Entities
A combined total of 798 facilities are owned and operated by small governments (i.e., the government serves fewer than 50,000 residents). EPA has not been able to obtain data on government revenue. The Census Bureau has not published recent data on revenues for cities (the most recent data are from 2002) and does not cover cities of fewer than 25,000 population. The Census Bureau provides revenue data for total local government revenues by county (covering all government entities including special districts within the county) and a per capita revenue estimate. The Census data indicated that the lowest per capita revenue for a covered county was around $1,024 in 2002 dollars (DeKalb County, MO, with 3 facilities) ($1,666 in 2022 dollars).171 The smallest town covered by the final rule has approximately 440 residents and several others have fewer than 1,000. However, in many of these cases it is not clear whether the town owns and operates the facility or whether it is operated by a district that serves multiple communities. In a few cases, EPA was able to locate budget data from special districts and smaller towns. Revenues per resident ranged from $196172 for a special district that serves 9,200 people to $1,955 for a town that serves 15,421173 people.174 The sample, however, is so small that it is not appropriate to generalize from it and special district revenue may not be appropriate to compare with government entities that are owned by municipalities, which could have larger revenues. There are some exceptions on the high end as well. One town with a population of fewer than 8,000 has revenues of close to $200 million (based on tourist business); another small city operates a combined water system, power system, and cable system; although the water system produces revenues of $2.5 million, the combined system reported revenues of $190 million.
Exhibit 8-9 and Exhibit 8-10 summarize the impacts of the final rule on small governments. To understand the impacts, Exhibit 8-9 presents the number of small government entities with costs that fall into certain ranges. Exhibit 8-10 presents the same data in percentage terms. From the results, the majority of small governments, except those with between 15,000 and 50,000 residents, will experience total impacts from the final rule estimated between $2,000 and $3,000.
For all small governments, 97 percent have cost impacts less than or equal to $10,000, and only 17 small governments are estimated to experience an impact greater than $10,000. The largest impact to a small government is $55,819 for a facility that serves an estimated population of 46,500. For the rule to have a larger than 1 percent impact, this entity will need to have revenue of less than $5.6 million, or less than $120 per resident. For small governments with populations of fewer than 5,000, the cost impacts are smaller: 53 have impacts less than or equal to $3,000 (78 percent) and no small governments with populations fewer than 5,000 have cost impacts greater than $10,000. The smallest government entity in the data is for a facility located in Avinger, TX; population 440 with a cost of $2,860 from the final rule. To experience an impact larger than 1 percent, this municipality will need to have revenue of less than $286,022, or less than $650 per resident.
Exhibit 8-9: Cost Impacts to Small Governments
(Number of Small Governments with Costs in the Given Range).
Category |
Number of Governments |
<$1,000 |
$1,000-$2,000 |
$2,000-$3,000 |
$3,000-$10,000 |
>$10,000 |
Small |
630 |
0 |
0 |
365 |
248 |
17 |
15,000 – 50,000 Residents |
330 |
0 |
0 |
156 |
165 |
9 |
<15,000 Residents |
300 |
0 |
0 |
209 |
83 |
8 |
<10,000 Residents |
187 |
0 |
0 |
140 |
44 |
3 |
<5,000 Residents |
68 |
0 |
0 |
53 |
15 |
0 |
Exhibit 8-10: Distribution of Cost Impacts to Small Governments
(Percent of Small Governments with Costs in the Given Range).
Category |
Number of Governments |
<$1,000 |
$1,000-$2,000 |
$2,000-$3,000 |
3,000-$10,000 |
>$10,000 |
Small |
630 |
0% |
0% |
58% |
39% |
3% |
15,000 – 50,000 Residents |
330 |
0% |
0% |
47% |
50% |
3% |
<15,000 Residents |
300 |
0% |
0% |
70% |
28% |
3% |
<10,000 Residents |
187 |
0% |
0% |
75% |
24% |
2% |
<5,000 Residents |
68 |
0% |
0% |
78% |
22% |
0% |
8.4 Conclusion
The small entity analysis indicates that the final rule will not impose a significant economic burden to a substantial number of small entities exceeding the threshold amount of 1 percent of small entity revenues. For private sector entities, EPA estimated that 9.2 percent of small entities will experience costs exceeding 1 percent of revenue and only 2.8 percent of entities will have costs greater than 3 percent of revenue. For small governments, EPA does not have data to estimate the percent of entities with different percent of revenue impacts. However, based on costs to small governments and their respective populations, EPA concludes that it is unlikely that a small government will experience a cost impact larger than 1 percent of revenue. The second analysis that EPA conducted with data from D&B Hoovers in Appendix C further confirms that the final rule will not impose a significant economic burden to small entities and suggests that the final rule has a smaller impact on small private sector entities. Using D&B Hoovers data, EPA estimated that 6.0 percent of small entities will experience costs exceeding 1 percent of revenue and only 1.9 percent of entities will have costs greater than 3 percent of revenue. Accordingly, the Administrator of EPA hereby certifies that that this final rule will not have a significant economic impact on a substantial number of small entities.
CHAPTER 9: Communities with Environmental Justice Concerns
This chapter summarizes EPA’s analysis to identify communities with environmental justice concerns that could be affected by the rulemaking and discuss the cumulative effects of climate change and the provisions on the identified communities.
9.1 Background
This chapter helps to address the following Executive Orders (EOs): Executive Order 12898: Federal Actions to Address Environmental Justice in Minority Populations and Low-Income Populations; Executive Order 14008: Tackling the Climate Crisis at Home and Abroad; and Executive Order 14096: Revitalizing Our Nation’s Commitment to Environmental Justice for All
Each Federal agency must make the achievement of environmental justice part of its mission “by identifying and addressing, as appropriate, disproportionately high and adverse human health or environmental effects of its programs, policies, and activities on minority populations and low-income populations.” Section 2-2 of E.O. 12898 provides that each Federal agency must conduct its programs, policies, and activities that substantially affect human health or the environment in a manner that ensures such programs, policies, and activities do not have the effect of (1) excluding persons (including populations) from participation in; or (2) denying persons (including populations) the benefits of; or (3) subjecting persons (including populations) to discrimination under, such programs, policies, and activities because of their race, color, or national origin.
E.O. 14008 calls on Federal agencies to make achieving environmental justice part of their missions “by developing programs, policies, and activities to address the disproportionately high and adverse human health, environmental, climate-related and other cumulative impacts on disadvantaged communities, as well as the accompanying economic challenges of such impacts.” It also declares a policy “to secure environmental justice and spur economic opportunity for disadvantaged communities that have been historically marginalized and overburdened by pollution and under-investment in housing, transportation, water and wastewater infrastructure and health care.” Under E.O. 13563 (76 FR 3821, January 21, 2011), Federal agencies may consider equity, human dignity, fairness, and distributional considerations, where appropriate and permitted by law. E.O. 14008 directs Federal agencies to develop programs, polices and activities to address the disproportionate health, environmental, economic, and climate impacts on disadvantaged, historically marginalized and overburdened communities. Similarly, E.O. 14096 re-emphasizes the commitment of the Executive branch to include the achievement of environmental justice in the mission of each agency and to evaluate the impacts of regulations and other Federal activities on communities with environmental justice concerns. E.O. 14096 places a responsibility on Federal agencies to “identify, analyze, and address disproportionate and adverse human health and environmental effects (including risks) and hazards of Federal activities, including those related to climate change and cumulative impacts of environmental and other burdens with environmental justice concerns[.]” Additionally, E.O. 14096 suggests improved environmental justice analyses through “disaggregating environmental risk, exposure, and health data by race, national origin, income, socioeconomic status, age, sex, disability, and other readily accessible and appropriate categories.” The Agency has reflected this suggestion by disaggregating the following proximity analysis by race and ethnicity.
The Agency defines “environmental justice” as the fair treatment and meaningful involvement of all people regardless of race, color, national origin, or income with respect to the development, implementation, and enforcement of environmental laws, regulations, and policies.175 The Agency defines the term “fair treatment” to mean both that no people should bear disproportionate burdens of environmental harms and risks, and that the distribution of reduction in risk from EPA actions does not exclude particular communities. The incorporation of environmental justice into EPA rulemaking is guided by two EPA documents: (1) Technical Guidance for Assessing Environmental Justice in Regulatory Analysis176 and (2) Guidance on Considering Environmental Justice During the Development of Regulatory Action.177 The Technical Guidance for Assessing Environmental Justice in Regulatory Analysis178 establishes the expectation that analysts conduct the highest quality environmental justice analysis feasible in support of rulemakings, recognizing that what is possible will be context-specific.
When assessing the potential for disproportionately high and adverse health or environmental impacts of regulatory actions on historically underserved and overburdened communities, EPA strives to answer three broad questions:
Is there evidence of potential environmental justice concerns in the baseline (the state of the world absent the regulatory action)? Assessing the baseline will allow EPA to determine whether pre-existing disparities are associated with the pollutant(s) under consideration (e.g., are the effects of the pollutant(s) more concentrated in some population groups?).
Is there evidence of potential environmental justice concerns for the regulatory option(s) under consideration? Specifically, how are the pollutant(s) and its (their) effects distributed for the regulatory options under consideration? And,
Do the regulatory option(s) under consideration exacerbate or mitigate environmental justice concerns relative to the baseline?179
It is not always possible to quantitatively assess all three questions. For instance, in some regulatory contexts it may only be possible to quantitatively characterize the baseline due to data and modeling limitations.
9.2 Methods
EPA seeks to characterize potential environmental justice concerns associated with baseline risks from RMP facilities. EPA conducted a proximity-based analysis using variables from EJSCREEN and the U.S. Census Bureau’s American Community Survey (ACS) to combine environmental and sociodemographic information on areas surrounding RMP facilities. To assess the environmental justice implications of this final action, EPA quantified community sociodemographic variables surrounding current, actively regulated facilities as of December 31, 2020, for which there were valid coordinates (n=11,714).180
The distribution of RMP facilities across the U.S. is shown below in Exhibit 9-1. Every state in the continental U.S. has multiple RMP facilities and at least one facility that has had one or more accidents. However, certain areas appear to have a higher concentration of facilities than others. While the Agency did not perform a hot spot analysis, the map shows that there appears to be a large concentration of RMP facilities in the Midwest, with other apparent clusters located in fairly industrial areas, such as the Mid-Atlantic coast, the Central Valley in California, and along the Gulf of Mexico throughout Texas and Louisiana. RMP facilities with one or more accidents tend to be located more heavily where there are clusters of RMP facilities. With the exception of North Dakota, largely rural states, such as Maine, New Hampshire, and Vermont, as well as much of the Mountain West have far fewer RMP facilities than the rest of the U.S.
Exhibit 9-1. Distribution of RMP Facilities in the United States
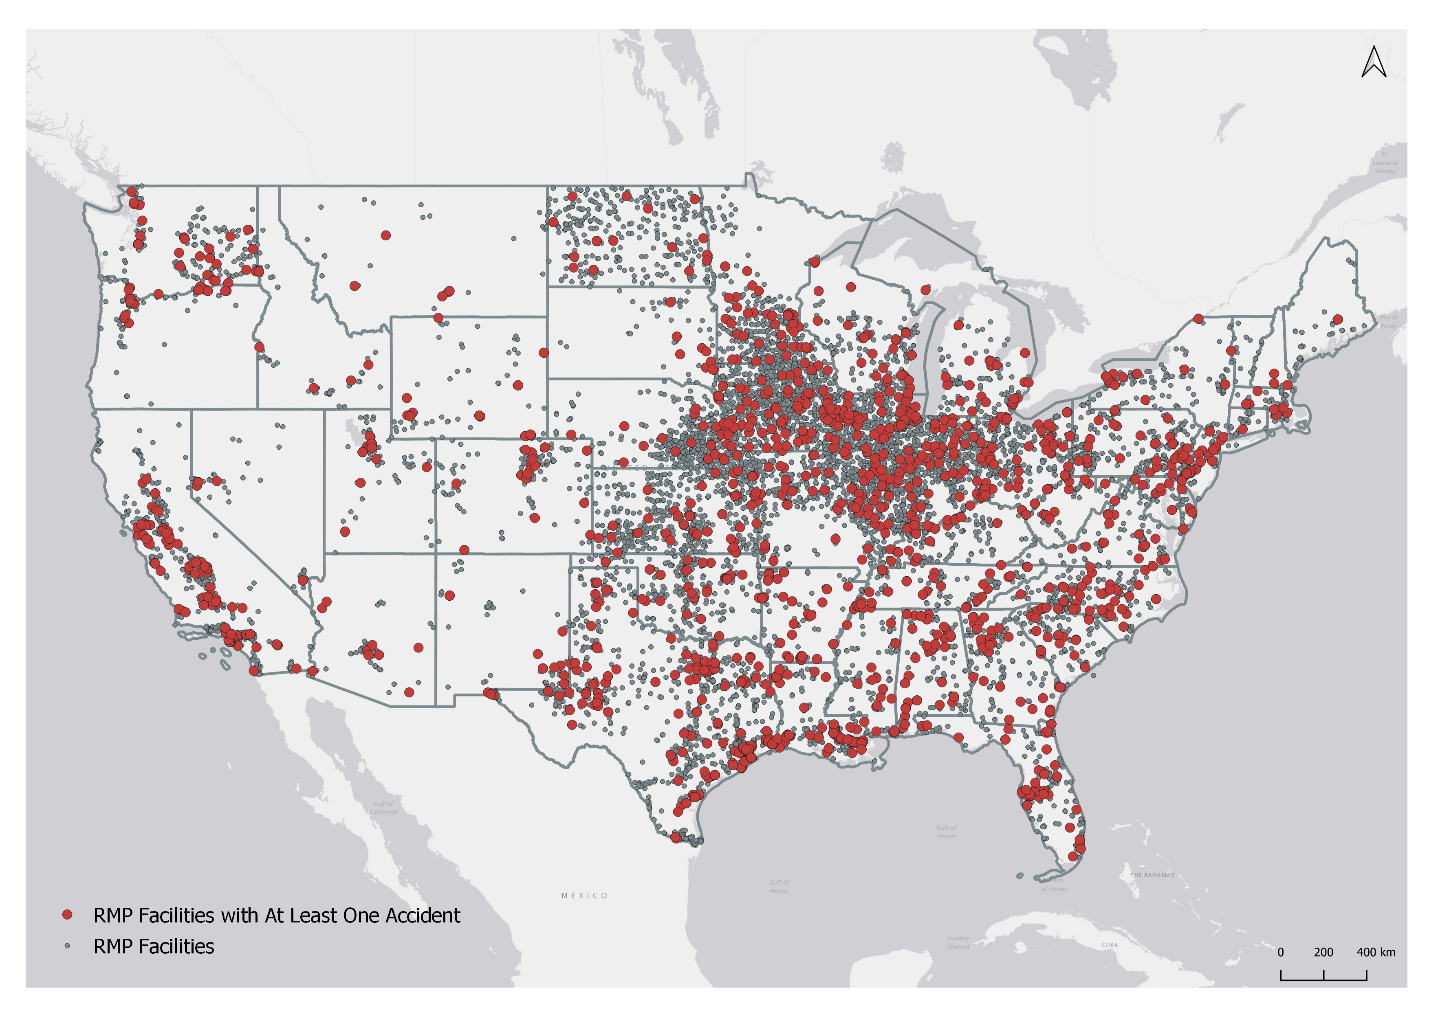
Due to data limitations, EPA was not able to determine a direct measure of risk or exposure from each facility. As a result, EPA used proximity to facility location as a surrogate, which assumes that any risks from the facility are limited to the designated boundary (i.e., people located outside of the designated boundary are not exposed to any risks from the facility) and that all individuals within the designated boundary are equally exposed.
9.2.1 Data
The Agency downloaded the number of low-income individuals from EJSCREEN and used that data to calculate the population that is low-income.181 The Agency obtained race and ethnicity population data from the 2017-2021 ACS 5-year estimates in order to calculate the percent of the total population that identifies with each racial/ethnic group. All data was reported at the Census Block Group (CBG) level.
9.2.2 Main Proximity-Based Analysis
For the main proximity analysis, EPA analyzed the sociodemographic characteristics of the communities living within one and three miles from the universe of RMP facilities. The one-mile buffer was used for the evaluation of proximal environmental justice communities in the 2019 Reconsideration Rule and represents communities likely to experience localized stressors from the associated facility. However, when modeling the worst-case release scenario, chemicals released from the industrial processes at the facilities can vary in exposure trajectory and distance. To capture the potential for further communities to be affected by any chemical release, the Agency also considered populations living within three miles of the facilities.182
For cases when multiple RMP facilities were closely located, and the circular buffers drawn around each facility overlapped, the Agency combined the overlapping buffers into one larger buffer. The combination of overlapping buffers enabled the Agency to avoid double counting populations that resided in the overlapping area of multiple buffers. The Agency then intersected the buffers with CBGs to identify which communities were within the buffer areas. For cases when only a fraction of a CBG intersected with a buffer, the Agency used an areal apportionment method to identify the relevant affected households and individuals. In other words, EPA used the fraction of the overlap area between CBG and buffer area to estimate the number of residents in that CBG living within the buffer area. For example, if 40 percent of the CBG area intersects with a buffer, then the Agency assumed that 40 percent of the CBG’s population live within the buffer.
The Agency then compared the sociodemographic characteristics of potentially affected communities (defined as those living within one and three miles from RMP facilities) to characteristics of unaffected communities (defined as those who live outside of the one-mile buffer around RMP facilities nationwide).183 The comparison group population was identified by first finding CBGs that fall completely outside of the one-mile buffers around RMP facilities and summing the associated population. For CBGs that partially overlap with the buffer areas, EPA used the areal apportionment method described above to estimate the number of CBG residents that live outside of the buffer area, before summing the associated population.
9.2.3 Proximity Analyses Focused on Specific Subsets of RMP Facilities
In addition to the main proximity-based analysis, EPA conducted additional proximity analyses evaluating populations living near specific subsets of RMP facilities. This enabled EPA to better characterize how the effects of the final rule may vary across communities given that facilities vary in the ultimate risk they pose to proximal populations. EPA evaluated how community characteristics differ based on process types, the number of RMP-related accidents reported between 2004 and 2020, program level, and chemical storage.
EPA evaluated three specific measures of potential risk: (1) RMP facilities categorized by the number of RMP-related accidents reported from 2004 to 2020, (2) RMP facilities categorized by the program level they belong in, and (3) RMP facilities categorized by the ratio of the quantity of chemical used in a process relative to the chemical’s regulatory threshold quantity. Facilities with a higher number of historical accidents from 2004 to 2020 were considered to be potential locations of higher cumulative burden from additional accidents. Program levels are assigned to regulated processes within RMP facilities, based on the relative potential for public impacts and the level of effort needed to prevent accidents. Facilities with processes classified as Program 3 were considered to be of higher potential risk than facilities with processes classified as Program 1 or 2. For this analysis, each RMP facility was assigned the maximum program level of any of the facility’s processes (e.g., a facility with level 2 and 3 processes was assigned Program 3). Similarly, facilities that have large quantities of chemicals in a process can pose a higher risk to the surrounding communities than those that have smaller amounts. This analysis focused on each facility’s maximum ratio between the quantity of a chemical in a process and the chemical’s regulatory threshold.184
9.3 Results Characterizing Baseline Conditions
The main proximity-based analysis shows that a higher proportion of individuals who identify as Black alone (non-Hispanic) or Hispanic or are low-income live within one and three miles of RMP facilities (and thus are at potentially greater risk) compared to the comparison group (Exhibit 9-2). For example, the percentages of the population within one mile of RMP facilities that identifies as Black alone (non-Hispanic) or Hispanic are 15.6 percent and 27.6 percent, respectively, compared to 11.8 percent and 17.7 percent of the U.S. population comparison group.185 Likewise, 38.0 percent of individuals living within one-mile of an RMP facility are low-income compared to 28.5 percent of the U.S. population comparison group.
Similar patterns emerge when examining race, ethnicity, and poverty status of communities living near the subset of facilities that experienced at least one accident between 2004 and 2020 (Exhibit 9-2). In each case the percentages are higher than the analysis of the full universe of active facilities (i.e., 18.3 percent Black, non-Hispanic individuals, 31.9 percent Hispanic individuals, and 40.8 percent low-income individuals). This pattern also persists when evaluating communities in proximity to RMP facilities with processes categorized under NAICS codes 324 and 325 and RMP facilities, including RMP facilities within that subset that have had at least one RMP-reportable accident (Exhibit 9-3).
Exhibit 9-2. Demographic and Socioeconomic Composition for RMP Fenceline Communities
|
Number of Facilities |
Buffer Distance (Miles) |
Total Population |
Percentage of Individuals that Identify as Black or African American Alone (non-Hispanic) |
Percentage of Individuals that Identify as American Indian and Alaska Native Alone (non-Hispanic) |
Percentage of Individuals that Identify as Asian Alone (non-Hispanic) |
Percentage of Individuals that Identify as Native Hawaiian and Other Pacific Islander Alone (non-Hispanic) |
Percentage of Individuals that Identify as Some Other Race Alone (non-Hispanic) |
Percentage of Individuals that Identify as Two or More Races |
Percentage of Individuals that Identify as Hispanic or Latino |
Percentage of Individuals Earning Less Than or Equal to Twice the Federal Poverty Level |
Facilities with accidents 2004-2020 |
1,487 |
1 |
7,453,862 |
18.3% |
0.4% |
4.6% |
0.2% |
0.3% |
2.8% |
31.9% |
40.8% |
3 |
87,442,724 |
17.4% |
0.3% |
6.5% |
0.2% |
0.4% |
3.1% |
26.9% |
34.2% |
||
All active facilities |
11,714 |
1 |
24,755,209 |
15.6% |
0.4% |
4.8% |
0.2% |
0.3% |
3.0% |
27.6% |
38.0% |
3 |
130,875,693 |
15.1% |
0.4% |
5.9% |
0.2% |
0.4% |
3.1% |
24.1% |
33.3% |
||
National Comparison Group |
309,242,323 |
11.8% |
0.6% |
5.6% |
0.2% |
0.4% |
3.2% |
17.7% |
28.5% |
||
Exhibit 9-3. Demographic and Socioeconomic Composition for Fenceline Communities of
NAICS 324 & 325 RMP Facilities
|
NAICS Codes |
Number of Facilities |
Buffer Distance (Miles) |
Total Population |
Percentage of Individuals that Identify as Black or African American Alone (non-Hispanic) |
Percentage of Individuals that Identify as American Indian and Alaska Native Alone (non-Hispanic) |
Percentage of Individuals that Identify as Asian Alone (non-Hispanic) |
Percentage of Individuals that Identify as Native Hawaiian and Other Pacific Islander Alone (non-Hispanic) |
Percentage of Individuals that Identify as Some Other Race Alone (non-Hispanic) |
Percentage of Individuals that Identify as Two or More Races |
Percentage of Individuals that Identify as Hispanic or Latino Alone |
Percentage of Individuals Earning Less Than or Equal to Twice the Federal Poverty Level |
Facilities with accidents 2004-2020 |
324 |
94 |
1 |
362,108 |
16.7% |
0.6% |
5.3% |
0.4% |
0.3% |
3.4% |
35.8% |
41.9% |
3 |
1,031,086 |
19.2% |
0.3% |
5.3% |
0.2% |
0.2% |
3.3% |
27.9% |
36.1% |
|||
325 |
355 |
1 |
4,474,800 |
16.2% |
0.5% |
7.2% |
0.5% |
0.3% |
3.2% |
35.2% |
38.8% |
|
3 |
13,212,135 |
19.5% |
0.3% |
6.5% |
0.2% |
0.4% |
3.0% |
28.7% |
36.4% |
|||
All active facilities |
324 |
161 |
1 |
502,258 |
14.1% |
0.5% |
4.4% |
0.4% |
0.3% |
3.1% |
37.9% |
41.0% |
3 |
3,621,220 |
18.3% |
0.3% |
4.9% |
0.2% |
0.3% |
3.2% |
26.8% |
36.7% |
|||
325 |
1,524 |
1 |
5,351,558 |
17.3% |
0.5% |
6.5% |
0.4% |
0.3% |
3.2% |
34.4% |
39.0% |
|
3 |
30,165,954 |
18.3% |
0.3% |
6.4% |
0.2% |
0.4% |
3.1% |
25.7% |
35.4% |
|||
National Comparison Group |
309,242,323 |
11.8% |
0.6% |
5.6% |
0.2% |
0.4% |
3.2% |
17.7% |
28.5% |
|||
Next, EPA evaluated how the race, ethnicity, and poverty characteristics of communities living within one and three miles of an RMP facility differ by the number of accidents between 2004 and 2020 (Exhibit 9-4). The greater the number of historical accidents, the more cumulative burden an additional accident from the same facility could have on proximal communities. While the percentage of Black (non-Hispanic), Hispanic, and low-income individuals living within one and three miles of facilities who have experienced at least two or more accidents are broadly similar to the characteristics of communities living in proximity to the full universe of active RMP facilities, this is not the case in the tail of the distribution (i.e., communities in proximity to facilities who have experienced 16 or more accidents between 2004 and 2020).186 For these communities, they have a higher percentage of Black (non-Hispanic) (24.9 percent and 42.7 percent for one and three mile distances), Hispanic (50.1 percent and 14.5 percent for one and three mile distances), and low-income (48.9 percent and 44.5 percent for one and three mile distances) individuals than both the national comparison group and the full universe of active facilities.
Exhibit 9-4. Demographic and Socioeconomic Composition of Fenceline Communities to RMP Facilities Based on Number of Historical RMP-reportable Accidents (2004-2020)
Number of Accidents |
Number of Facilities |
Buffer Distance (Miles) |
Total Population |
Percentage of Individuals that Identify as Black or African American Alone (non-Hispanic) |
Percentage of Individuals that Identify as American Indian and Alaska Native Alone (non-Hispanic) |
Percentage of Individuals that Identify as Asian Alone (non-Hispanic) |
Percentage of Individuals that Identify as Native Hawaiian and Other Pacific Islander Alone (non-Hispanic) |
Percentage of Individuals that Identify as Some Other Race Alone (non-Hispanic) |
Percentage of Individuals that Identify as Two or More Races |
Percentage of Individuals that Identify as Hispanic or Latino Alone |
Percentage of Individuals Earning Less Than or Equal to Twice the Federal Poverty Level |
2 – 3 |
296 |
1 |
1,106,582 |
16.1% |
0.4% |
4.4% |
0.3% |
0.3% |
3.0% |
35.4% |
41.7% |
3 |
16,364,676 |
14.6% |
0.3% |
5.6% |
0.2% |
0.3% |
2.5% |
43.2% |
37.8% |
||
4 – 9 |
85 |
1 |
162,274 |
27.9% |
0.3% |
3.9% |
0.0% |
0.4% |
2.4% |
18.9% |
41.8% |
3 |
2,727,926 |
21.0% |
0.2% |
3.4% |
0.0% |
0.3% |
2.4% |
33.8% |
39.1% |
||
10 – 15 |
12 |
1 |
25,910 |
17.0% |
0.3% |
2.8% |
0.5% |
0.0% |
6.2% |
20.6% |
38.5% |
3 |
222,318 |
23.6% |
0.2% |
2.0% |
0.2% |
0.2% |
3.5% |
16.5% |
34.4% |
||
16 + |
6 |
1 |
4,813 |
24.9% |
0.1% |
0.1% |
0.0% |
0.0% |
1.3% |
50.1% |
48.9% |
3 |
55,231 |
42.7% |
0.1% |
0.9% |
0.2% |
0.2% |
1.7% |
14.5% |
44.5% |
||
All active facilities |
11,714 |
1 |
24,755,209 |
15.6% |
0.4% |
4.8% |
0.2% |
0.3% |
3.0% |
27.6% |
38.0% |
3 |
130,875,693 |
15.1% |
0.4% |
5.9% |
0.2% |
0.4% |
3.1% |
24.1% |
33.3% |
||
National Comparison Group |
309,242,323 |
11.8% |
0.6% |
5.6% |
0.2% |
0.4% |
3.2% |
17.7% |
28.5% |
||
EPA next evaluated how the socioeconomic characteristics of communities surrounding RMP facilities differ by the highest process program level for the facility. For the subset of RMP facilities with a history of accidents, communities within one mile of a Program 3 facility have a somewhat higher percentage of low-income individuals (41 percent) and Hispanic individuals (27.4 percent) compared to communities within one mile of Program 1 (34.5 percent and 17.4 percent, respectively) and Program 2 (38.7 percent and 22.0 percent, respectively) facilities (Exhibit 9-5). In contrast, a lower percentage of Black (non-Hispanic) individuals (18.4 percent) live within one mile of a Program 3 facility with a history of accidents compared to comparable Program 1 (36.6 percent) or Program 2 (20.8 percent) facilities.
|
Program Level |
Number of Facilities |
Buffer Distance (Miles) |
Total Population |
Percentage of Individuals that Identify as Black or African American Alone (non-Hispanic) |
Percentage of Individuals that Identify as American Indian and Alaska Native Alone (non-Hispanic) |
Percentage of Individuals that Identify as Asian Alone (non-Hispanic) |
Percentage of Individuals that Identify as Native Hawaiian and Other Pacific Islander Alone (non-Hispanic) |
Percentage of Individuals that Identify as Some Other Race Alone (non-Hispanic) |
Percentage of Individuals that Identify as Two or More Races |
Percentage of Individuals that Identify as Hispanic or Latino |
Percentage of Individuals Earning Less Than or Equal to Twice the Federal Poverty Level |
Facilities with accidents 2004-2020 |
1 |
15 |
1 |
75,276 |
36.6% |
0.2% |
3.4% |
0.0% |
0.1% |
3.4% |
17.4% |
34.5% |
3 |
313,138 |
30.9% |
0.2% |
6.6% |
0.1% |
0.4% |
3.6% |
12.5% |
30.8% |
|||
2 |
285 |
1 |
387,373 |
20.8% |
0.3% |
3.6% |
0.0% |
0.5% |
2.9% |
22.0% |
38.7% |
|
3 |
5,565,629 |
16.5% |
0.6% |
3.8% |
0.2% |
0.3% |
3.1% |
21.4% |
33.7% |
|||
3 |
1,178 |
1 |
2,375,329 |
18.4% |
0.5% |
4.0% |
0.2% |
0.4% |
3.2% |
27.4% |
40.8% |
|
3 |
14,672,843 |
12.8% |
0.4% |
5.5% |
0.4% |
0.3% |
3.5% |
22.9% |
32.6% |
|||
All active facilities |
1 |
161 |
1 |
1,947,659 |
18.1% |
0.3% |
4.2% |
0.2% |
0.3% |
2.6% |
33.3% |
37.9% |
3 |
49,999,348 |
18.1% |
0.3% |
7.8% |
0.2% |
0.3% |
3.0% |
29.3% |
33.5% |
|||
2 |
3,073 |
1 |
7,025,577 |
14.6% |
0.4% |
4.1% |
0.2% |
0.3% |
2.7% |
31.1% |
39.0% |
|
3 |
78,200,397 |
15.6% |
0.3% |
6.2% |
0.1% |
0.3% |
2.9% |
27.8% |
34.3% |
|||
3 |
4,737 |
1 |
19,527,152 |
15.7% |
0.4% |
5.2% |
0.2% |
0.4% |
3.1% |
28.3% |
38.0% |
|
3 |
110,348,761 |
15.8% |
0.4% |
6.0% |
0.2% |
0.4% |
3.1% |
24.8% |
33.6% |
|||
All active facilities, regardless of program level |
11,714 |
1 |
24,755,209 |
15.6% |
0.4% |
4.8% |
0.2% |
0.3% |
3.0% |
27.6% |
38.0% |
|
3 |
130,875,693 |
15.1% |
0.4% |
5.9% |
0.2% |
0.4% |
3.1% |
24.1% |
33.3% |
|||
National Comparison Group |
309,242,323 |
11.8% |
0.6% |
5.6% |
0.2% |
0.4% |
3.2% |
17.7% |
28.5% |
|||
Exhibit 9-5. Demographic and Socioeconomic Composition of Fenceline Communities to RMP Facilities Based on Program Level
EPA then looked at how the socioeconomic characteristics of communities near facilities differ based on the ratio of the quantity of chemical in a process to its regulatory threshold (described in this chapter as chemical process quantity multiplier) (Exhibit 9-6)187. For all active facilities, as the chemical process quantity multiplier increases, the percentage of individuals that are Black (non-Hispanic), Asian (non-Hispanic), Hispanic, and low income tend to trend towards the percentages for the full universe of active RMP facilities. For low income, the one exception is that the percentage of individuals that are low income is markedly lower (22.8 percent and 30.1 percent for communities within one mile of facilities with at least one accident from 2004 to 2020 and for communities within one mile of all active facilities in the RMP universe, respectively) in communities with the lowest chemical process quantity multiplier compared to all other quantity categories. The percentage of individuals that are low income for communities within one mile of facilities with at least one accident from 2004 to 2020 and with the lowest chemical process quantity multiplier (22.8 percent) is even lower than the percentage of individuals that are low income for the national comparison group (28.5 percent). However, overall, the vulnerability of communities does not appear to trend with the potential risk associated with larger exceedances of chemical regulatory thresholds.
Exhibit 9-6. Demographic and Socioeconomic Composition of Fenceline Communities to RMP Facilities Based on Chemical Process Quantity
|
Chemical Process Quantity Multiplier |
Number of Facilities |
Buffer Distance (Miles) |
Total Population |
Percentage of Individuals that Identify as Black or African American Alone (non-Hispanic) |
Percentage of Individuals that Identify as American Indian and Alaska Native Alone (non-Hispanic) |
Percentage of Individuals that Identify as Asian Alone (non-Hispanic) |
Percentage of Individuals that Identify as Native Hawaiian and Other Pacific Islander Alone (non-Hispanic) |
Percentage of Individuals that Identify as Some Other Race Alone (non-Hispanic) |
Percentage of Individuals that Identify as Two or More Races |
Percentage of Individuals that Identify as Hispanic or Latino Alone |
Percentage of Individuals Earning Less Than or Equal to Twice the Federal Poverty Level |
Facilities with accidents 2004-2020 |
≤1 |
3 |
1 |
3,484 |
4.5% |
0.1% |
29.5% |
5.9% |
0.1% |
1.4% |
41.9% |
22.8% |
3 |
1,092,307 |
6.9% |
1.8% |
4.6% |
0.3% |
0.3% |
2.9% |
48.8% |
40% |
|||
1 - 10 |
440 |
1 |
1,343,521 |
16.8% |
0.4% |
4.5% |
0.1% |
0.4% |
3% |
31.9% |
40.2% |
|
3 |
9,140,989 |
14.2% |
0.3% |
6.3% |
0.3% |
0.4% |
3.4% |
21.3% |
31.6% |
|||
10 - 100 |
559 |
1 |
1,202,206 |
22.2% |
0.5% |
4.4% |
0.4% |
0.4% |
3.3% |
25.3% |
40.8% |
|
3 |
9,966,411 |
17.0% |
0.3% |
5.9% |
0.2% |
0.4% |
2.9% |
23.8% |
32% |
|||
100 + |
475 |
1 |
1,110,338 |
21.2% |
0.4% |
4.2% |
0.2% |
0.2% |
3.0% |
27.6% |
39.5% |
|
3 |
14,634,978 |
20.8% |
0.4% |
5.0% |
0.3% |
0.4% |
3.7% |
19% |
34.4% |
|||
All active facilities |
≤1 |
21 |
1 |
125,727 |
20.9% |
0.2% |
12.3% |
0.2% |
0.3% |
2.4% |
33.9% |
30.1% |
3 |
6,411,279 |
20.0% |
0.3% |
9.6% |
0.2% |
0.4% |
2.9% |
29.9% |
34.8% |
|||
1 - 10 |
4,919 |
1 |
18,074,265 |
16.2% |
0.4% |
5.1% |
0.2% |
0.3% |
3% |
29.4% |
38.8% |
|
3 |
110,713,053 |
15.9% |
0.4% |
6.1% |
0.2% |
0.4% |
3.1% |
25.4% |
33.9% |
|||
10 - 100 |
5,247 |
1 |
10,875,005 |
16.4% |
0.4% |
3.9% |
0.1% |
0.3% |
2.9% |
28.7% |
39.3% |
|
3 |
97,306,641 |
15.9% |
0.3% |
6.0% |
0.2% |
0.3% |
3.1% |
25.6% |
34.0% |
|||
100 + |
1,732 |
1 |
3,924,887 |
14.6% |
0.4% |
4.3% |
0.2% |
0.3% |
3.1% |
28.4% |
37.6% |
|
3 |
62,392,042 |
16.9% |
0.3% |
6.4% |
0.1% |
0.4% |
3.0% |
27.5% |
34.0% |
|||
All active facilities, regardless of chemical storage |
11,714 |
1 |
24,755,209 |
15.6% |
0.4% |
4.8% |
0.2% |
0.3% |
3.0% |
27.6% |
38.0% |
|
3 |
130,875,693 |
15.1% |
0.4% |
5.9% |
0.2% |
0.4% |
3.1% |
24.1% |
33.3% |
|||
National Comparison Group |
309,242,323 |
11.8% |
0.6% |
5.6% |
0.2% |
0.4% |
3.2% |
17.7% |
28.5% |
|||
9.4 Conclusions
In the main proximity analysis, communities near RMP facilities and facilities with RMP-reportable accidents have higher percentages of low income individuals and Black (non-Hispanic) and Hispanic residents compared to the national comparison group. To the extent that populations living closer to RMP facilities are more likely to be exposed to a chemical if an accidental release at an RMP facility occurs, these releases pose a greater risk to these demographic groups of interest. In terms of risk associated with potential cumulative burden, the additional proximity analyses found that communities near the few RMP facilities with many historical accidents from 2004 to 2020 had even greater percentages of low income, Black (non-Hispanic), and Hispanic individuals compared to the full universe of active facilities as well as facilities with fewer accidents. In terms of exposure to potential risk associated with the severity of accidents, EPA found that communities in proximity to facilities with Program Level 3 processes had higher percentages of low income and Hispanic individuals compared to the full universe of active facilities as well as facilities with lower program levels. By contrast, EPA also found that the percentage of Black (non-Hispanic), Hispanic, Asian, and low-income individuals tended to decrease as the chemical process quantity multiplier increased.
While EPA is unable to estimate the incremental changes in accident risks from the provisions finalized by this rule, the baseline distribution of population as well as the findings from subsequent analyses that look at the socioeconomic characteristics of communities near facilities with a large number of accidents or classified as Program 3 facilities suggests that the benefits of the provisions may reduce potential exposure for communities with higher percentages of Black (non-Hispanic), Hispanic and low income populations. In addition, EPA believes that several of the provisions in this final action will benefit underserved populations, such as requiring facilities in NAICS codes 324 and 325 to conduct a Safer Technology Alternatives Analysis, increase information availability for fenceline communities, include backup power for perimeter monitoring, conduct root cause analyses for facilities that have reported accidents, and improve community notification and related response planning.
9.5 Climate Change Impacts
EPA also considered the potential impacts of climate change and the provisions on communities with environmental justice concerns. Scientific assessment and Agency reports produced over the past decade by the U.S. Global Change Research Program (USGCRP),188, 189 the Intergovernmental Panel on Climate Change (IPCC),190, 191, 192, 193 and the National Academies of Science, Engineering, and Medicine,194,195 provide evidence that the impacts of climate change raise potential environmental justice concerns. These reports conclude that poorer or predominantly non-White communities can be especially vulnerable to climate change impacts because they tend to have limited adaptive capacities and are more dependent on climate-sensitive resources such as local water and food supplies or have less access to social and information resources. Individuals living in socially and economically disadvantaged communities, such as those living at or below the poverty line or who are experiencing homelessness or social isolation, are also at greater risk of health effects from climate change. While difficult to isolate from related socioeconomic factors, race appears to be an important factor in vulnerability to climate-related stress, with elevated risks for mortality from high temperatures reported for Black individuals compared to White individuals after controlling for factors such as air conditioning use. Some research has found that race or ethnicity alone, more than other individual demographic and socioeconomic characteristics, may play a significant role in determining one’s risk of experiencing harm from climate change. This includes estimates that Black individuals are 40 percent more likely than non-Black individuals to live in areas of the United States experiencing the highest projected increases in mortality rates due to changes in extreme temperatures (under a scenario of 2°C of global warming). Additionally, Hispanic and Latino individuals in weather-exposed industries were found to be 43 percent more likely to currently live in areas with the highest projected labor hour losses due to extreme temperatures.196
Climate change is associated with extreme weather events that can trigger accidental releases. As shown in Chapter 9.3, communities near RMP facilities, and therefore most affected by accidental releases, have higher percentages of both low-income residents and residents belonging to historically underserved and overburdened racial and ethnic groups. EPA is addressing climate change impacts in the final regulation by emphasizing language in the process hazard analysis requiring owners and operators to consider the impacts of natural hazards including climate change-related weather events. To the extent that the final provisions mitigate the potential consequences of accidents at regulated facilities as the result of natural hazards, EPA expects these provisions to benefit nearby communities with environmental justice concerns.
CHAPTER 10: Limitations and Conclusions
10.1 Limitations and Conclusions
The analyses of costs, benefits, and other impacts contained in this RIA faced many limitations. The primary limitations are discussed below.
Facility 5-year RMP Reports
Corrections made. As discussed in detail in prior chapters, the data used for the cost and baseline damage analyses include information from facility 5-year RMP reports. EPA has attempted to correct obvious errors in the reports, such as removing duplicate accident reports and reclassifying some facilities to more appropriate NAICS codes (for example, government-owned wastewater treatment). EPA has also identified owners of facilities and acquired revenue and employee data for the small entity analysis. In cases where accidents were not reported or accident impact data were inaccurate, EPA was unable to make corrections but does not expect such errors to be large. The estimated baseline damages, as well as the estimates of costs for third-party audits and root cause analysis, reflect these limitations plus the latter also project past accident rates into the future.
Limited benefits information. EPA’s benefits analysis is qualitative. EPA did not have data to correlate the final rule provisions with specific reductions in expected probabilities or magnitudes of RMP chemical accidents. However, EPA does provide detailed estimates of the baseline damages reported by RMP facilities, which for numerous reasons, the Agency believes are an underestimate of total accident costs. While these estimated baseline damages are not equivalent to an estimate of the benefits of this rule, EPA did identify reasons, described elsewhere in this RIA (e.g., section 6.1.1 above) why EPA expects the provisions of this rule to decrease and/or mitigate baseline accident damages, thereby providing some insights that generally gauge quantitative, monetized benefits.
One reason that the estimated baseline accident damages are underestimates is that EPA was able to monetize only the baseline accident impacts required to be reported by facilities, including fatalities, injuries, property damage, and certain costs associated with evacuations and sheltering-in-place events. EPA expects the final rule to reduce many additional accident impacts including responder costs, transaction costs, property value reductions, unmonetized costs of evacuations and sheltering-in-place, the costs of potential health risks from exposure to toxic chemicals, and productivity losses, but due to a lack of data, could not estimate their magnitudes or values. A second reason is that some accidents may not be reported because the facility goes out of business before filing the RMP report, resulting in an underestimate of historical damages. Lack of data also meant that other benefits of the rule, such as improved information, could not be quantified. Finally, when EPA examined updated facility estimates of the magnitudes of impacts reported, facilities that reported corrected estimates have tended to increase the magnitudes.
STAA Information
Potential cost savings not estimated. It is important to note that while EPA has estimated the cost of STAA implementation, EPA has not estimated the cost savings facilities may gain from implementing these STAA measures. To the extent that facilities do reap cost savings from these new technologies, EPA’s estimates of gross costs can be offset partially by those cost savings.
Example technologies and approach to practicability study cost estimate. While what constitutes safer technologies will vary for each specific RMP process, identification of safer technologies should be based on recognized approaches by chemical process designers. EPA realizes that safer technology determinations will vary among industry sectors, as will what is considered practicable and included in a practicability analysis. To estimate the costs of the practicability assessment of safer technologies, EPA relied on estimates of costs of example technologies, which may, of course, differ from the actual technologies studied by firms complying with the requirement. In addition, the assumption that a practicability assessment costs approximately 1.2% of reference project costs is highly simplistic. The result for EPA’s analysis of the STAA requirement is that costs for some facilities may be overestimated, while costs for others may be underestimated. See Sections 4.4.2 and 5.1.3 for a more detailed discussion.
Dated information from prior proposed rule.
The cost estimates for rule familiarization, STAA, and emergency response coordination are based in part on public comments made in response to EPA requests for information during the proposed rule stage of the 2017 amendments rule. For this final rule, which restored aspects of those provisions, cost estimates were based on some of those same public comments EPA received on the 2017 amendments rule. However, there may have been subsequent changes to these costs. A more accurate cost analysis would rely on data compiled by independent researchers or on an EPA survey of regulated facilities. However, time and resource constraints prevented EPA from compiling such data.
Model facility approach.
The analysis used a model facility approach so that each estimate represents the average for a group of facilities, not a point estimate for any one facility. This analysis has attempted to develop reasonable central estimates, recognizing that the range of costs incurred by individual facilities could be wide. For example, in the analysis, the estimated third-party audit cost for a complex facility is the same for all complex facilities, but it is unlikely that an auditor will charge the largest facility, which has more than 30 covered processes, the same fee as a facility with only one or two covered processes.
CHAPTER 11: Analyses Required Under Applicable Statutes and Executive Orders
11.1 Executive Order 12866: Regulatory Planning and Review and Executive Order 14094 Modernizing Regulatory Review
This action is a “significant regulatory action”, as defined under section 3(f)(1) of Executive Order 12866, as amended by Executive Order 14094. Accordingly, EPA submitted this action to OMB for Executive Order 12866 review. Documentation of any changes made in response to the Executive Order 12866 review is available in the docket.
11.2 Unfunded Mandates Reform Act
This action includes a Federal mandate which may result in the expenditure by State, local, and Tribal governments, in the aggregate, or by the private sector, of $100 million or more (adjusted for inflation) in any one year. EPA estimates annualized total costs of $256.9 million at a 3% discount rate and $296.9 million at a 7% discount rate. Of this amount, average annualized costs to State/local governments total $5.0 million at a 3% discount rate and $5.1 million at 7% discount rate consisting of estimated regulatory compliance costs for State/local governments that currently own or operate RMP-regulated sources plus costs to local governments (i.e., LEPCs, emergency response officials and State implementing agencies) for rule familiarization and voluntary participation in coordination activities, exercises and review of information submitted to LEPCs. The estimated average annualized cost to the private sector totals approximately $252.2 million at a 3% discount rate and $292.1 million at a 7% discount rate. See Appendix E of this document for more information that addresses requirements under Section 202 of UMRA. This action is not subject to the requirements of section 203 of UMRA because it contains no regulatory requirements that might significantly or uniquely affect small governments.
With regard to Section 205 of UMRA, the Agency considered finalizing the regulatory requirements as proposed as well as the regulatory alternatives considered in Chapter 7 of this RIA. However, none of the alternative options successfully fulfilled the objectives of the rule, which seek to seek to prevent or reduce the impacts of RMP accidents on communities near facilities. These objectives are accomplished by promoting prevention generally and through targeted enhanced measures at the most accident-prone facilities, which historically have had a disproportionate share of accidents and the costliest accidents. Some of these same facilities have widely known safer alternatives available. The objectives are also accomplished by enhancing emergency response training and planning through better information access and exchange among the facility, emergency responders, and the community potentially exposed to accidents. A market failure results when RMP accidents impose burdens on nearby communities. Firms do not have an appropriate level of incentive to prevent and/or mitigate these external costs. The Agency believes that the rule objectives to prevent or reduce the impacts of accidents on communities near facilities are best achieved by the selected provisions for this final rule, particularly, implementation of process safeguards or IST/ISD to prevent accidents and allowing a wider segment of the public potentially affected by accidents to access emergency preparedness information.
11.3 Federalism
E.O. 13132 (64 FR 43255, August 10, 1999) requires Agencies to develop an accountable process to ensure “meaningful and timely input by State and local officials in the development of regulatory policies that have federalism implications.” Policies that have federalism implications are defined in the E.O. to include regulations that have “substantial direct effects on the States, on the relationship between the national government and the States, or on the distribution of power and responsibilities among the various levels of government.”
Under section 6 of E.O. 13132, Agencies may not issue a regulation that has federalism implications, that imposes substantial direct compliance costs, and that is not required by statute unless the Federal government provides the funds necessary to pay the direct compliance costs incurred by State and local governments or the agency consults with State and local officials early in the process of developing the regulation. The Agency also may not issue a regulation that has federalism implications and that preempts State law unless the Agency consults with State and local officials early in the process of developing the regulation.
The final rule will affect State and local government entities, including entities that own RMP-regulated facilities, LEPCs, and 13 State-and county- delegated implementing agencies. The final rule imposes both direct and indirect costs. Direct costs are associated with activities required by regulated facilities owned by government entities. Indirect costs are associated with 1) regulated facilities owned by government entities, LEPCs, and State implementing agencies reviewing the final rule, and 2) LEPCs coordinating with facilities.
Most of the government-owned facilities are water or wastewater treatment facilities, but some large swimming pools are covered as well. Most of the government entities are cities, but the universe includes larger special districts (e.g., the Metropolitan Water District of Southern California). In addition, 13 State-and county-delegated implementing agencies will face small costs from the final rule.
The EPA has concluded that this action will not have federalism implications. The maximum annual cost to State and local government entities, including LEPCs and the 13 delegated implementing agencies, is estimated to be $18.9 million in 2022 dollars.197 Therefore, the final rule will not have a substantial and direct effect on State and local governments when compared to the $25 million threshold which triggers federalism implications. In addition, the final rule does not change the relationship between State and local governments and the Federal government nor delegate new responsibilities from the Federal government to State and local governments.
11.4 Employment Impacts
The effects of environmental regulation on employment are generally a mixture of potential declines and gains in different areas of the economy over time with a general expectation that some workers will shift to activities that are more environmentally protective than before the regulation. Regulatory employment impacts can vary across occupations, regions, and industrial sectors; by labor and product demand and supply elasticities; and in response to other labor market conditions. There are significant challenges when trying to isolate the employment effects due to an environmental regulation from employment effects due to a wide variety of other possibly concurrent economic changes, including the state of the macroeconomy generally. Considering these challenges, the economics literature provides a constructive framework and empirical evidence. The current employment impacts analysis focuses on impacts on labor demand. (Environmental regulation may also affect labor supply through changes in worker health and productivity.198)
Economic research evaluating the employment impacts of environmental regulation has shown that the net effect on employment is ambiguous. Employment impacts may occur in the directly regulated sector, the environmental protection sector, and in upstream and other related sectors. Even within the directly regulated sector, multiple impacts may be experienced. New costs that are incurred to protect the environment may include labor, energy, capital, materials, and other costs Firms may pass along to consumers increased costs from environmental protection, leading demand for output to decrease, which could cause a decrease in labor demand. There may also be operational impacts experienced by regulated firms as they modify operations to comply with new regulatory requirements; the direction of that impact on labor demand is a function of the interaction between the regulatory requirements and the firm’s labor intensity of production. In general, the net effect of an environmental regulation on employment in regulated sectors, the sectors providing environmental protection, and the overall economy is indeterminate. Berman and Bui (2001)199 provide a theoretical model of employment effects of environmental regulation.
To put the costs of this final rule and their potential employment impacts into perspective, EPA collected data on employment, revenue, and average wages from 2016 to 2020 for the 324 and 325 NAICS sectors, the sectors expected to be most affected by the rule. All nominal dollar amounts have been adjusted for inflation to 2022 dollars using BEA’s GDP price deflator. Data on the number of employees for each sector came from the County Business Patterns (CBP) for the years 2016 through 2020. The 324 NAICS sector employed an average of approximately 107,000 workers over this time period, while the 325 NAICS sector employed an average of approximately 800,000. Over these five years, the 324 NAICS sector employment increased 6.7 percent, while the 325 NAICS sector employment increased 8.8 percent. Data collected from the BLS OEWS for the 324 and 325 NAICS sectors shows that average wages for each sector were $89,830 and $78,070 in 2020 compared to $86,291 and $77,178 in 2016, respectively. On the other hand, likely heavily influenced by the Covid 19 pandemic, the Annual Survey of Manufacturers (ASM) reported revenue declined from 2018 through 2020 to $407.3 billion for NAICS 324 and $788.0 billion for NAICS 325.200 Revenue figures typically exceed $700 billion and $800 billion for each sector, respectively. Labor productivity, calculated as revenue per employee, was $3.6 million for the 324 sector and $0.9 million for the 325 sector in 2020. These figures are well above the $0.3 million labor productivity average across all sectors of the economy.201 The annualized 7 percent discounted costs of the final rule in 2022, totaling $297 million, make up roughly 0.07 percent and 0.04 percent of revenues for the 324 and 325 NAICS sectors, respectively. While not all the costs of the final rule will be borne by the 324 and 325 NAICS sectors, these sectors largely make up the Program 3 facilities affected by this rule and will bear a large share of the costs estimated for the final rule. Exhibits 11-1 and 11-2 present this data for both sectors, respectively.
Exhibit 11-1: Employment, Average Wages, Revenue
and Labor Productivity for NAICS Sector 324
Year |
Employment |
Average Wages |
Revenue ($1,000) |
Labor Productivity (Revenue / Employment) |
2016 |
104,748 |
$86,291 |
- |
- |
2017 |
105,730 |
$85,706 |
- |
- |
2018 |
107,040 |
$87,238 |
$789,540,346 |
$7,376,124 |
2019 |
107,509 |
$88,166 |
$691,528,576 |
$6,432,285 |
2020 |
111,764 |
$89,830 |
$407,274,260 |
$3,644,056 |
Exhibit 11-2: Employment, Average Wages, Revenue
and Labor Productivity for NAICS Sector 325
Year |
Employment |
Average Wages |
Revenue ($1,000) |
Labor Productivity (Revenue / Employment) |
2016 |
766,771 |
$77,178 |
- |
- |
2017 |
784,725 |
$78,229 |
- |
- |
2018 |
798,028 |
$78,822 |
$889,826,800 |
$1,115,032 |
2019 |
817,229 |
$78,469 |
$843,620,095 |
$1,032,293 |
2020 |
834,524 |
$78,070 |
$788,044,252 |
$944,304 |
EPA also analyzed data on the demographic breakdown of these two sectors, presented in Exhibit 11-3, from the Current Population Survey (CPS) Annual Social and Economic Supplement (ASEC) for the year 2020. Both sectors predominantly employ male and white workers. Of all employees within the 324 and 325 NAICS sectors, 3.2 percent and 9.4 percent of employees were identified as belonging to a racial and/or ethnic minority.
Exhibit 11-3: NAICS Sectors 324 and 325 Demographic Characteristics
Demographic Characteristic |
NAICS 324 |
NAICS 325 |
Gender |
||
Male |
91.5% |
89.4% |
Female |
8.5% |
10.6% |
Race (Non-Hispanic) |
||
Asian |
2.2% |
6.6% |
Black |
0.1% |
0.9% |
White |
97.6% |
92.4% |
Native American or Hawaiian Pacific Islander |
0.1% |
0.1% |
Ethnicity (All races) |
||
Hispanic |
1.0% |
1.8% |
Minority Status |
||
Minority |
3.2% |
9.4% |
This RIA does not include a complete analysis of labor market effects of the final rule. However, in a year when a large complex facility will have to conduct a third-party audit, a root cause analysis and an initial evaluation of safer technologies, the total labor hours required will average significantly fewer than a single FTE. The STAA practicability assessment and STAA implementation will require additional labor, but EPA does not estimate labor hours for those requirements. STAA practicability assessments will likely involve labor for engineers to assess the technical practicability and for corporate managers to assess the financial practicability of different projects. STAA implementation that involves replacing, constructing, or installing equipment and structures will require labor as part of initial costs, as will developing new programs and procedures and training staff. Implemented measures may have recurring labor needs to operate and maintain equipment, programs, and procedures. Finally, third-party audit and root cause analysis provisions may generate work for consultants. In general, EPA does not expect any facility will need to hire new employees as a result of the requirements of the final rule.
11.5 Paperwork Reduction Act of 1995
The information collection activities in this rule will be submitted for approval to OMB under the Paperwork Reduction Act of 1995. The Information Collection Request (ICR) document that the EPA prepared has been assigned EPA ICR number 2725.02. You can find a copy of the ICR in the docket for this rule, and it is briefly summarized here. The information collection requirements are not enforceable until OMB approves them.
EPA believes that the Risk Management Program regulations, originally promulgated on June 20, 1996, codified as 40 CFR part 68, and later amended, have been effective in preventing and mitigating chemical accidents in the United States. However, EPA also believes that revisions could further protect human health and the environment from chemical hazards through advancement of PSM based on lessons learned. The revisions in this final rule are a result of reviewing the existing Risk Management Program and information gathered from the 2021 listening sessions. State and local authorities will use the information in RMPs to modify and enhance their community response plans. The agencies implementing the RMP rule use RMPs to evaluate compliance with 40 CFR part 68 and to identify sources for inspection because they may pose significant risks to the community. Citizens may use the information to assess and address chemical hazards in their communities and to respond appropriately in the event of a release of a regulated substance. These revisions are made under the statutory authority provided by section 112(r) of the CAA as amended (42 U.S.C. 7412(r)).
Respondents/affected entities: The industries that are likely to be affected by the requirements in the regulation fall into numerous NAICS codes. The types of stationary sources affected by the rule range from petroleum refineries and large chemical manufacturers to water and wastewater treatment systems; chemical and petroleum wholesalers and terminals; food manufacturers, packing plants, and other cold storage facilities with ammonia refrigeration systems; agricultural chemical distributors; midstream gas plants; and a limited number of other sources that use RMP-regulated substances. Among the stationary sources potentially affected, the Agency has determined that 2,636 are regulated private sector small entities and 630 are small government entities.
Respondent’s obligation to respond: Mandatory (CAA sections 112(r)(7)(B)(i) and (ii), CAA sections 112(r)(7)(B)(iii), 114(c), CAA 114(a)(1))).
Estimated number of respondents: 14,226.
Frequency of response: Occasional.
Total estimated burden: 1,190,991 hours (per year). Burden is defined at 5 CFR 1320.3(b).
Total estimated cost: $126,796,471 (per year); includes $12,413,710 annual operations and maintenance costs and $78,400 annual capital costs.
An agency may not conduct or sponsor, and a person is not required to respond to, a collection of information unless it displays a currently valid OMB control number. The OMB control numbers for the EPA’s regulations in 40 CFR are listed in 40 CFR part 9. When OMB approves this ICR, the Agency will announce that approval in the Federal Register and publish a technical amendment to 40 CFR part 9 to display the OMB control number for the approved information collection activities contained in this final rule.
11.6 National Technology Transfer and Advancement Act
Section 12(d) of the National Technology Transfer and Advancement Act (NTTAA) of 1995, Pub L. No. 104-113, Sec. 12(d) directs EPA to use voluntary consensus standards in its regulatory activities unless doing so will be inconsistent with applicable law or otherwise impractical. Voluntary consensus standards are technical standards (e.g., materials specifications, test methods, sampling procedures, and business practices) that are developed or adopted by voluntary consensus standard bodies. The NTTAA directs the EPA to provide Congress, through the OMB, explanations when the Agency decides not to use available and applicable voluntary consensus standards.
The regulatory options do not involve technical standards. Nothing in the regulatory options will prevent the use of voluntary consensus standards for any measurements, where available, and the EPA encourages permitting authorities and regulated entities to do so. Therefore, the EPA is not considering the use of any voluntary consensus standards.
11.7 Consultation and Coordination with Indian Tribal Governments
E.O. 13175 (65 FR 67249, November 6, 2000) requires EPA to develop an accountable process to ensure “meaningful and timely input by tribal officials in the development of regulatory policies that have tribal implications.” “Policies that have tribal implications” is defined in the E.O. to include regulations that have “substantial direct effects on one or more Indian Tribes, on the relationship between the Federal government and the Indian Tribes, or on the distribution of power and responsibilities between the federal government and Indian Tribes.”
This action has Tribal implications. However, it will neither impose substantial direct compliance costs on federally recognized Tribal governments, nor preempt Tribal law. Approximately 260 RMP facilities are located on Tribal lands. Tribes could be impacted by the final rule either as an owner or operator of an RMP-regulated facility or as a Tribal government when the tribal government conducts emergency response or emergency preparedness activities under EPCRA. One Tribal government owns three facilities that combined will incur less than $2,100 in costs and another Tribal government owns one facility that will incur less than $900 in costs.
11.8 Executive Order 13045: Protection of Children from Environmental Health Risks and Safety Risks
E.O. 13045 directs Federal agencies to include an evaluation of the health and safety effects of the planned regulation on children in Federal health and safety standards and explain why the regulation is preferable to potentially effective and reasonably feasible alternatives. This action is not subject to E.O. 13045 because the EPA does not believe the environmental health risks or safety risks addressed by this action present a disproportionate risk to children. EPA believes that the revisions to the Risk Management Program regulations made by this final rule will further protect human health, including the health of children, through advancement of process safety.
11.9 Executive Order 13211: Actions Concerning Regulations That Significantly Affect Energy Supply, Distribution, or Use
E.O. 13211 requires Agencies to prepare a Statement of Energy Effects when undertaking certain agency actions. Such Statements of Energy Effects shall describe the effects of certain regulatory actions on energy supply, distribution, or use, notably: (i) any adverse effects on energy supply, distribution, or use (including a shortfall in supply, price increases, and increased use of foreign supplies) should the proposal be implemented, and (ii) reasonable alternatives to the action with adverse energy effects and the expected effects of such alternatives on energy supply, distribution, and use. The OMB implementation memorandum for E.O. 13211 outlines specific criteria for assessing whether a regulation constitutes a “significant energy action” and will have a “significant adverse effect on the supply, distribution or use of energy.”202 Those criteria include:
Reductions in crude oil supply in excess of 10,000 barrels per day.
Reductions in fuel production in excess of 4,000 barrels per day.
Reductions in coal production in excess of 5 million tons per year.
Reductions in natural gas production in excess of 25 million mcf per year.
Reductions in electricity production in excess of 1 billion kilowatt-hours per year, or in excess of 500 megawatts of installed capacity.
Increases in the cost of energy production in excess of 1 percent.
Increases in the cost of energy distribution in excess of 1 percent.
Significant increases in dependence on foreign supplies of energy. Having other similar adverse outcomes, particularly, unintended ones.
The final rule will not impose adverse effects on the supply, distribution, or use of energy. Some refineries may face costs from the final rule, for example from STAA; however, the combined costs will result in a de minimis increase in the cost of energy production. As such, the final rule does not constitute a significant regulatory action under E.O. 13211 and the EPA did not prepare a Statement of Energy Effects.
APPENDIX A: Cost Estimates of HF Alkylation Conversion
Cost estimate ($millions) |
Technology or Location |
Year of Estimate |
Barrels per day (BPD) |
Description |
$50 |
Exelus, a chemical technology company |
2011 |
Not Available |
Conversion to solid acid catalyst203 to replace traditional liquid acids (no bpd provided).204 |
$87 |
Chevron Salt Lake City |
2016 |
4,500 |
Converting existing HF unit to ionic liquids (Honeywell process) 4,500 bpd. “Chevron will convert the existing 4,500-b/d HF alkylation unit at Salt Lake City to ISOALKY, a proprietary alkylation technology developed by Chevron USA Inc. and now licensed by Honeywell International Inc.’s UOP LLC, that uses ionic liquids instead of HF or sulfuric acids as a liquid alkylation catalyst for production of high-octane fuels, UOP said” (Oil & Gas Journal, 10/4/2016). Cost estimates for two contracts appear in Oil & Gas Journal 2/1/17: $67 million + $20 million.205 |
$900
|
Torrance Refinery in Torrance CA |
2017 |
30,000 |
Conversion to new sulfuric acid unit using Sulfuric Acid Alkylation Technology to produce 30,000 BPD of alkylate product: $600m for alkylation unit; $300m for acid regeneration plant.206 |
$300 (from a range of $100 to $500) |
American Fuel and Petrochemicals Manufacturers (AFPM) an association representing larger petroleum facilities. |
2015 |
Not Available |
AFPM members estimate costs to modify or replace an HF alkylation unit will more realistically range from $100 million to $500 million in capital, depending on facility-specific considerations.207 |
$100 |
Delek Louisiana |
2018 |
6,000 |
New conventional sulfuric acid alkylation unit 6,000 bpd. “HOUSTON (IC–)--US refiner Delek US Holdings will install a 6,000 bbl/day alkylation unit at its Krotz Springs, Louisiana, refinery, according to information made available on Tuesday. . . Total cost is estimated at $103m, according to the filing.”208 |
$300 |
Valero Houston |
2016 |
13,000 |
New conventional sulfuric acid alkylation unit 13,000 bpd. “The $300 million Houston alkylation project announced in January entered the detailed engineering, procurement, and construction phase of the development process during the quarter. This 13,000 BPD unit, which upgrades low-cost natural gas liquids into premium-value alkylate, is expected to be completed in the first half of 2019.”209 |
$400 |
Valero, St. Charles, Louisiana |
2017 |
25,000 |
New advanced sulfuric acid (requires less acid, and size equals the Torrance refinery in LA) 25,000 bpd. “Included in the growth investments is the construction of a new 25,000 barrels per day alkylation unit at the St. Charles refinery, which received final approval from the company’s Board of Directors last week. Total cost for the alkylation unit is estimated at $400 million, and completion is expected in the second half of 2020.”210 |
$155 |
DuPont Stratco |
2016 with 2010 labor rates |
25,000 |
Stratco Sulfuric Acid Alkylation unit to produce 25,000 bpd alkylate plus an Order of Magnitude cost estimate for a 250 STPD Sulfuric Acid Regeneration Plant (required capacity for a 25,000 bpd Alky Unit) is $45 million USD.211 |
$145 |
ExxonMobil |
2016 with 2010 labor rates |
25,000 |
ExxonMobil sulfuric acid for 25,000bpd plus an Order of Magnitude cost estimate for a 250 STPD Sulfuric Acid Regeneration Plant (required capacity for a 25,000 bpd Alky Unit) is $45 million USD.212 |
APPENDIX B: Property and Business Losses in the Petrochemical Sector
Type of Facility |
Location |
Date |
Property Damage $M (2021 Dollars) |
Business Loss $M (accident year $) |
Notes |
Refinery |
Texas City TX |
5/30/1978 |
$256 |
|
|
Refinery |
Romeoville IL |
7/23/1984 |
$603 |
|
|
Petrochemical |
Port Neal IA |
12/13/1994 |
$491 |
$60 |
|
Petrochemical |
Pampa TX |
11/14/1987 |
$627 |
$300 |
|
Petrochemical |
Henderson NV |
5/4/1988 |
$841 |
|
Plant destroyed |
Refinery |
Norco LA |
5/5/1988 |
$808 |
|
Demolished and rebuilt unit |
Refinery |
Richmond CA |
4/10/1989 |
$246 |
|
25% of capacity lost for 5 months, unit restored after 2 years |
Petrochemical |
Pasadena TX |
10/23/1989 |
$1,843 |
$680 |
Full production not restored for 2 years |
Petrochemical |
Seadrift TX |
3/12/1991 |
$235 |
$165 |
Production reduced for one year |
Petrochemical |
Sterlington LA |
5/1/1991 |
$313 |
$270 |
One unit destroyed |
Refinery |
Wilmington CA |
10/8/1992 |
$200 |
|
Production reduced by 53% max capacity for 7 months |
Petrochemical |
Belpre OH |
5/27/1994 |
$440 |
|
Production unit destroyed |
Petrochemical |
Cedar Bayou TX |
10/20/1994 |
$315 |
|
Includes business loss |
Refinery |
Pascagoula MS |
8/16/2007 |
$310 |
|
Major portion continued to operate |
Petrochemical |
Deer Park TX |
6/22/1997 |
$304 |
|
Unit shut down for 10 months |
Refinery |
Richmond CA |
3/25/1999 |
$248 |
$240 |
Unit shut down for one year |
Refinery |
Carson City CA |
4/23/2001 |
$248 |
|
Unit shut down for 2 months |
Refinery |
Lemont IL |
8/14/2001 |
$589 |
$330 |
Unit shut down for one year |
Petrochemical |
Illiopolis IL |
4/23/2004 |
$268 |
|
Up to 75% of plant destroyed |
Refinery |
Texas City TX |
3/23/2005 |
$340 |
|
|
Petrochemical |
Port Arthur TX |
4/29/2006 |
$325 |
|
Plant closed for 6 months |
Refinery |
Big Spring, TX |
2/18/2008 |
$551 |
|
Resumed some processing after 2 months, all after 8 months |
Refinery |
Wisconsin |
4/26/2018 |
$457 |
|
|
Refinery |
Philadelphia |
6/21/2019 |
$342 |
|
Refinery closed |
Petrochemical |
Port Neches TX |
11/27/2019 |
$434 |
|
|
Sources: Marsh JLT Specialty, "100 Largest Losses in the Hydrocarbon Industry," 27th ed., March 2022. https://www.marsh.com/us/industries/energy-and-power/insights/100-largest-losses/100-largest-losses-report-download.html. Marsh, “The 100 Largest Losses, 1974-2019, Large Property Damage Losses in the Hydrocarbon Industry,” 26th Edition, March 2020. https://www.marsh.com/us/industries/energy-and-power/insights/100-largest-losses-in-the-hydrocarbon-industry.html. Marsh, “The 100 Largest Losses 1974-2013 Large Property Damage Losses in the Hydrocarbon Industry,” 23rd Edition, March 2014. https://enatech.jrc.ec.europa.eu/download/attachment/244. The table includes 25 accidents that reflect only U.S. accidents in the refinery and petrochemical sectors from 1978 forward, only accidents that may have been related to a release of a regulated substance, and only damage unrelated to natural disasters except for the 1994 Cedar Bayou flooding and 2007 Pascagoula oil fire.
APPENDIX C: Small Entity Analysis Data Comparison
EPA received public comments questioning the Agency’s use of Data Axle data in the small entity analysis because the data are not publicly available due to Data Axle’s data privacy restrictions. To address these concerns, EPA used Dun & Bradstreet (D&B) Hoovers data on private firms impacted by the rule to develop a second, small entity analysis, which EPA is making publicly available in the docket for this rulemaking. This analysis also serves as a robustness check on the Data Axle small entity analysis results. EPA developed this comparison of small entity analysis results for both the proposed and final rule cost estimates.
C.1 Proposed Rule Data Comparison
This section compares the proposed rule small entity analysis using Data Axle data (referred to as the original analysis) with a duplicate analysis using D&B Hoovers data and found the results to be largely the same; i.e., the proposed rule would not have imposed a significant economic impact on a substantial number of small entities. For private sector entities, EPA estimates that based on Data Axle and D&B Hoovers data, respectively, 3.1 and 1.8 percent of (89 and 22) small entities would have experienced costs exceeding 1 percent of revenue, and only 0.2 and 0.2 percent of entities (5 and 5) would have incurred costs greater than 3 percent of revenue.
EPA retrieved data from Data Axle and D&B Hoovers on the revenue, NAICS code, and employee count for each entity, parent company, or corporate entity, as appropriate. A summary of the number of facilities, the number of unique entities, the breakdown of private sector and government entities, and their size classifications is provided in Exhibit C-1. To provide a direct comparison of the proposed rule results using the two data sources, the small parent entities are classified using 2019 SBA size standards, which differ from the size standard classifications that the Chapter 8 final rule RFA analysis uses.
Exhibit C-1: RMP Facility and Entity Counts.
|
D&B Hoovers |
Data Axle |
||
Number of Entities |
Percent |
Number of Entities |
Percent |
|
Total Facilities |
11,740 |
11,740 |
||
Total Entities |
5,508 |
5,649 |
||
Private Sector Entities |
4,480 |
81% of total entities |
4,538 |
80% of total entities |
Small |
2,189 |
49% of private sector entities |
2,911 |
64% of private sector entities |
Non-small |
2,242 |
51% of private sector entities |
1,627 |
36% of private sector entities |
Government Entities |
1,028 |
19% of total entities |
1,111 |
20% of total entities |
Small |
590 |
57% of government entities |
630 |
57% of government entities |
Non-small |
438 |
43% of government entities |
481 |
43% of government entities |
As Exhibit C-1 shows, in the proposed rule small entity analysis using Data Axle, EPA identified 5,649 unique entities owning RMP-regulated facilities. Of those 5,649 unique entities, EPA was able to determine that 1,111 (20 percent) are government entities (e.g., State and local governments, LEPCS, special water districts, etc.) and the remaining 4,538 (80 percent) are private entities. In the revised analysis using D&B Hoovers, EPA identified 5,508 unique entities owning RMP regulated facilities. Of those 5,508 unique entities, EPA was able to determine that 1,028 (19 percent) are government entities and the remaining 4,474 (81 percent) are private sector entities.
Each facility is “assigned” an associated business entity, or if applicable, an ultimate parent entity. This means that some facilities not associated with an ultimate parent entity in the Data Axle data may be associated with an ultimate parent entity in the D&B Hoovers data, and vice versa, and which explains the differences in entity counts and size classification. Data Axle has an algorithm matching facility addresses with known businesses and uses their database to connect those businesses to any parent companies. EPA’s original analysis assigned facilities to entities using company name. D&B Hoovers uses the DUNS number reported in the RMP or FRS Databases. DUNS numbers then connect to businesses in the D&B Hoovers database and can be connected to any parent companies. In the analysis, DUNS numbers are used to assign facilities to entities. Government counts differ slightly between datasets due to a different method of assigning facilities to entities.
Exhibits C-2 and C-3 present an analysis of facilities and the size of ownership entity associated with them to provide an understanding of the distribution of private sector owned facilities by Program Level. The results show that Program 3 has a larger proportion of facilities owned by non-small private sector entities than Programs 2 and 1 facilities. That is, based on Data Axle and D&B Hoovers data, respectively, non-small private sector entities own 59 and 82 percent of Program 3 facilities (3,781 of 6,422 and 5,239 of 6,387) compared to 48 and 55 percent of Program 2 facilities (1,526 of 3,163 and 1,719 of 3,137) and 43 and 79 percent of Program 1 facilities (282 of 651 and 502 of 634).
Exhibit C-2: Analysis of Private Sector Facility Ownership by Program Level, Data Axle.
|
Number of P1 Facilities |
Number of P2 Facilities |
Number of P3 Facilities |
Total Facilities |
660 |
3,975 |
7,105 |
# of facilities owned by: Private Sector Entities |
651 |
3,162 |
6,422 |
Small |
369 |
1,636 |
2,641 |
Non-small |
282 |
1,526 |
3,781 |
Exhibit C-3: Analysis of Private Sector Facility Ownership by Program Level, D&B Hoovers.
|
Number of P1 Facilities |
Number of P2 Facilities |
Number of P3 Facilities |
Total Facilities |
648 |
3,942 |
7,058 |
# of facilities owned by: Private Sector Entities |
634 |
3,137 |
6,387 |
Small |
132 |
1,418 |
1,148 |
Non-small |
502 |
1,719 |
5,239 |
Exhibits C-4 and C-5 present an analysis of facilities and the size of entity associated with them to provide an understanding of the distribution of government-owned facilities by program level. Both analyses show a similar distribution. Based on Data Axle and D&B Hoovers data, respectively, non-small government sector entities own 48 and 46 percent of Program 3 facilities (331 facilities out of 683 and 330 of 671) compared to 45 and 49 percent of Program 2 facilities (369 facilities out of 813 and 367 of 805). There are few Program 1 government-owned facilities.
Exhibit C-4: Analysis of Government Sector Facility Ownership by Program Level, Data Axle.
|
Number of P1 Facilities |
Number of P2 Facilities |
Number of P3 Facilities |
Total Facilities |
660 |
3,975 |
7,105 |
# of facilities owned by Government Entities |
9 |
813 |
683 |
Small |
2 |
444 |
352 |
Non-small |
7 |
369 |
331 |
Exhibit C-5: Analysis of Government Sector Facility Ownership by Program Level, D&B Hoovers.
|
Number of P1 Facilities |
Number of P2 Facilities |
Number of P3 Facilities |
Total Facilities |
648 |
3,942 |
7,058 |
# of facilities owned by: Government Entities |
14 |
805 |
671 |
Small |
3 |
438 |
341 |
Non-small |
11 |
367 |
330 |
EPA estimated the cost for each facility to comply with the final rule. These estimates are applied to the same facilities across data sources. This was done by applying cost estimates for the following cost categories to facilities in the affected universe, per facility or per process:
Rule Familiarization
STAA
Root Cause Analysis
Third-Party Audits
Employee Participation Plan
Emergency Backup Power
Community Notification Plan
Information Availability
The costs used for each cost category are consistent with the costs described in the proposed rule RIA, Chapter 4: Unit Costs of Proposed Rule Provisions, and are applied to the same facilities across data sources. The differences in facility matching between the two data sources drive the differences in average small entity cost in Exhibit C-6 and Exhibit C-7.
The comparison results of the analysis for private sector small entities are presented in Exhibits C-6 and C-7, below. The analyses using Data Axle and D&B Hoovers show similar cost-to-revenue impacts, with estimates that 96.9 and 99.0 percent of small entities will incur cost impacts of less than 1 percent of their revenue and the same estimate of 0.2 percent of small entities with impacts greater than 3 percent, respectively. Only 3.1 percent of small private sector entities using Data Axle, and 1.0 percent using D&B Hoovers are estimated to face impacts greater than 1 percent. In both analyses, of the entities with impacts greater than 3 percent, one small entity associated with a facility with a HF Alkylation faces STAA costs, which creates a large increase in the average small entity cost. Removing the entity facing this STAA cost results in a much smaller average small entity cost to the entities with impacts greater than 3 percent, with average cost decreasing from $636,278 to $49,519 using Data Axle and from $1.0 million to $41,413 using D&B Hoovers.
Exhibit C-6: Cost Impacts as a Proportion of Total Revenue for
Small Private Sector Entities, Data Axle.
Proportion of Revenue Impacted |
Number of Small Entities |
% of Small Entities |
Average Small Entity Cost ($) |
Average Small Entity Revenue |
< 1% |
2,822 |
96.9% |
$10,618 |
$51,340,929 |
1% - 3% |
84 |
2.9% |
$108,921 |
$6,638,322 |
Total >3% |
5 |
0.2% |
$636,278 |
$4,955,000 |
Total >3% without HF Alkylation |
4 |
0.1% |
$49,519 |
$1,218,750 |
Small entity with HF Alkylation |
1 |
0.03% |
$2,983,317 |
$19,900,000 |
Exhibit C-7: Cost Impacts as a Proportion of Total Revenue for
Small Private Sector Entities, D&B Hoovers.
Proportion of Revenue Impacted |
Number of Small Entities |
% of Small Entities |
Average Small Entity Cost ($) |
Average Small Entity Revenue |
< 1% |
2,167 |
99.0% |
$34,352 |
$162,876,973 |
1% - 3% |
17 |
0.8% |
$44,391 |
$3,708,068 |
Total >3% |
5 |
0.2% |
$1,022,048 |
$7,326,442 |
Total >3% without HF Alkylation |
4 |
0.18% |
$41,413 |
$1,039,664 |
Small entity with HF Alkylation |
1 |
0.05% |
$2,983,317 |
$19,900,000 |
The primary sectors subject to the rule and the SBA size standards for small parent entities that were in effect when the proposed rule was published are shown in Exhibit C-8.213
Exhibit C-8: SBA Industry Sector Small Entity Size Standards, 2019.
NAICS |
Sector |
Size Standard |
111 |
Crop Production |
$0.75 million |
112 |
Animal Production and Aquaculture |
$0.75 -$15 million |
115 |
Support Activities for Agriculture and Forestry |
$7.5 - $27.5 million |
211111 |
Crude Petroleum and Natural Gas Extraction |
1,250 FTE |
221112 |
Fossil Fuel Electric Power Generation |
750 FTE |
22131 |
Water Supply and Irrigation Systems |
$27.5 million |
22132 |
Sewage Treatment Facilities |
$20.5 million |
3111 |
Animal Food Manufacturing |
500 - 1,000 FTE |
3112 |
Grain and Oilseed Milling |
500 - 1,000 FTE |
3113 |
Sugar and Confectionery Product Manufacturing |
750 - 1,250 FTE |
3114 |
Fruit and Vegetable Preserving and Specialty Food Manufacturing |
750 - 1,250 FTE |
3115 |
Dairy Product Manufacturing |
750 - 1,250 FTE |
3116 |
Animal Slaughtering and Processing |
750 - 1,250 FTE |
3117 |
Seafood Product Preparation and Packaging |
750 FTE |
3118 |
Bakeries and Tortilla Manufacturing |
750 - 1,250 FTE |
3119 |
Other Food Manufacturing |
750 - 1,250 FTE |
3121 |
Beverage Manufacturing |
750 - 1,250 FTE |
322 |
Paper Manufacturing |
500 - 1,500 FTE |
32411 |
Petroleum Refineries |
1,500 FTE |
3254 |
Pharmaceutical and Medicine Manufacturing |
1,000 - 1,250 FTE |
3255 |
Paint, Coating, and Adhesive Manufacturing |
500 - 1,000 FTE |
3256 |
Soap, Cleaning Compound, and Toilet Preparation Manufacturing |
750 - 1,250 FTE |
3259 |
Other Chemical Product and Preparation Manufacturing |
500 - 1,500 FTE |
326 |
Plastics and Rubber Products Manufacturing |
500 - 1,250 FTE |
327 |
Nonmetallic Mineral Product Manufacturing |
500 - 1,250 FTE |
331 |
Primary Metal Manufacturing |
500 - 1,250 FTE |
332 |
Fabricated Metal Product Manufacturing |
500 - 1,500 FTE |
333 |
Machinery Manufacturing |
500 - 1,500 FTE |
334 |
Computer and Electronic Product Manufacturing |
500 - 1,250 FTE |
335 |
Electrical Equipment, Appliance, and Component Manufacturing |
500 - 1,500 FTE |
336 |
Transportation Equipment Manufacturing |
1,000 - 1,500 FTE |
337 |
Furniture and Related Product Manufacturing |
500 - 1,000 FTE |
339 |
Miscellaneous Manufacturing |
500 - 1,000 FTE |
42 |
Wholesale Trade |
100 - 150 FTE |
44422 |
Nursery, Garden Center, and Farm Supply Stores |
$11m |
45431 |
Fuel Dealers |
100 FTE |
48691 |
Pipeline Transportation of Refined Product |
1,500 FTE |
48821 |
Support Activities for Rail Transportation |
$15m |
C.2 Final Rule Data Comparison
EPA conducted the final rule small entity analysis using both Data Axle and D&B Hoovers. The analysis indicates that the final rule will not impose a significant economic impact on a substantial number of small entities using either data source. For private sector entities, EPA estimates that 9.3 and 7.8 percent of small entities will experience costs exceeding 1 percent of revenue, and only 2.8 and 1.9 percent of entities will have costs greater than 3 percent of revenue based on Data Axle and D&B Hoovers data, respectively.
EPA retrieved data from Data Axle and D&B Hoovers on the revenue, NAICS code, and employee count for each entity, parent company, or corporate entity as appropriate. A summary of the number of facilities, the number of unique entities, the breakdown of private sector and government entities, and their size classifications is provided in Exhibit C-9. To provide a direct comparison of the final rule results using the two data sources, the small parent entities are classified using March 17, 2023 SBA size standards.
Exhibit C-9: RMP Facility and Entity Counts.
|
D&B Hoovers |
Data Axle |
||
|
Number of Entities |
Percent
|
Number of Entities |
Percent
|
Total Facilities |
11,740 |
11,740 |
||
Total Entities |
5,649 |
5,508 |
||
Private Sector Entities |
4,538 |
80% of total entities |
4,480 |
81% of total entities |
Small |
2,636 |
58% of private sector entities |
2,263 |
51% of private sector entities |
Non-small |
1,902 |
42% of private sector entities |
2,214 |
49% of private sector entities |
Government Entities |
1,111 |
20% of total entities |
1,028 |
19% of total entities |
Small |
630 |
57% of government entities |
590 |
57% of government entities |
Non-small |
481 |
43% of government entities |
438 |
43% of government entities |
In the final rule small entity analysis using Data Axle data, EPA identified 5,649 unique entities owning RMP regulated facilities. Of those 5,649 unique entities, EPA determined that 1,111 (20 percent) are government entities and the remaining 4,538 (80 percent) are private sector entities. In the revised analysis using D&B Hoovers data, EPA identified 5,508 unique entities owning RMP regulated facilities. Of those 5,508 unique entities, EPA determined that 1,028 (19 percent) are government entities and the remaining 4,480 (81 percent) are private sector entities.
Each facility is “assigned” an associated owner entity, or if applicable, an ultimate parent entity. This means that some facilities not associated with a parent entity in the Data Axle data may be associated with a parent entity in D&B Hoovers data, and vice versa, which explains the differences in entity counts and size classification. Data Axle has an algorithm matching facility addresses with known business and uses their database to connect those businesses to any parent entity. EPA’s original analysis assigned facilities to entities using company name. D&B Hoovers uses the DUNS number reported in the RMP or FRS Databases. DUNS numbers then connect to businesses in the D&B Hoovers database and can be connected to any parent companies. In the analysis, DUNS numbers are used to assign facilities to entities. Government counts differ slightly due to a different method of assigning facilities to entities. Additionally, Data Axle proposed rule and final rule small entity counts differ slightly due to outliers found in the final rule analysis.
Exhibits C-10 and C-11 present an analysis of facilities and the size of entity associated with them to provide an understanding of the distribution of private sector owned facilities by program level. The results show that Program 3 has a larger proportion of facilities owned by non-small private sector entities than Program 2 and 1 facilities. That is, based on Data Axle and D&B Hoovers data, respectively, roughly 65 percent and 82 percent of Program 3 facilities, respectively, (4,148 of 6,422 and 5,212 of 6,387) are owned by a non-small private sector entity compared to 51 percent and 55 percent of Program 2 facilities (1,612 of 3,162 and 1,710 of 3,137) and 48 percent and 79 percent of Program 1 facilities (310 of 651 and 500 of 634).
Exhibit C-10: Analysis of Private Sector Facility Ownership by Program Level, Data Axle.
|
Number of P1 Facilities |
Number of P2 Facilities |
Number of P3 Facilities |
Total Facilities |
660 |
3,975 |
7,105 |
# of facilities owned by: Private Sector Entities |
651 |
3,162 |
6,422 |
Small |
341 |
1,550 |
2,274 |
Non-small |
310 |
1,612 |
4,148 |
Exhibit C-11: Analysis of Private Sector Facility Ownership by Program Level, D&B Hoovers.
|
Number of P1 Facilities |
Number of P2 Facilities |
Number of P3 Facilities |
Total Facilities |
648 |
3,942 |
7,058 |
# of facilities owned by: Private Sector Entities |
634 |
3,137 |
6,387 |
Small |
134 |
1,427 |
1,175 |
Non-small |
500 |
1,710 |
5,212 |
Exhibits C-12 and C-13 present an analysis of facilities and the size of entity associated with them to provide an understanding of the distribution of government-owned facilities by program level. The analyses show a similar distribution across program level. Based on Data Axle and D&B Hoovers data respectively, non-small government sector entities own 48 and 49 percent of Program 3 facilities (331 facilities out of 683 and 330 of 671) compared to 45 and 46 percent of Program 2 facilities (369 facilities out of 813 and 367 of 805). There are few Program 1 government-owned facilities.
Exhibit C-12: Analysis of Government Sector Facility Ownership by Program Level, Data Axle.
|
Number of P1 Facilities |
Number of P2 Facilities |
Number of P3 Facilities |
Total Facilities |
660 |
3,975 |
7,105 |
# of facilities owned by: Government Entities |
9 |
813 |
683 |
Small |
2 |
444 |
352 |
Non-small |
7 |
369 |
331 |
Exhibit C-13: Analysis of Government Sector Facility Ownership by Program Level,
D&B Hoovers.
|
Number of P1 Facilities |
Number of P2 Facilities |
Number of P3 Facilities |
Total Facilities |
648 |
3,942 |
7,058 |
# of facilities owned by: Government Entities |
14 |
805 |
671 |
Small |
3 |
438 |
341 |
Non-small |
11 |
367 |
330 |
EPA estimated the cost for each facility to comply with the final rule. These estimates are applied to the same facilities across data sources. This was done by applying cost estimates for the following cost categories to facilities in the affected universe, per facility or per process:
Rule Familiarization
STAA
Root Cause Analysis
Third-Party Audits
Employee Participation Plan
Employee Participation Plan Training
Translation
Emergency Backup Power
Justifications
Community Notification Plan
Information Availability
The costs used for each cost category are consistent with the costs described in this final rule’s Chapter 4: Unit Costs of Final Rule Provisions and are applied to the same facilities across data sources. The comparison results of the analysis for private sector small entities are presented in Exhibits C-14 and C-15, below. The differences in facility matching between the two data sources drive the differences in average small entity cost. The results show that the analyses using Data Axle and D&B Hoovers are similar in impact. Based on Data Axle and D&B Hoovers data, respectively, an estimated 90.8 and 94.0 percent of small entities will incur cost impacts that are less than 1 percent of their revenue and an estimate of 2.8 and 1.9 percent of small entities with impacts greater than 3 percent. Only 9.2 percent of small private sector entities using Data Axle, and 6.0 percent using D&B Hoovers, are estimated to face impacts greater than 1 percent. In both analyses, of the entities with impacts greater than 3 percent, one small entity associated with a facility with a HF Alkylation faces STAA costs, which creates a large increase in the average small entity cost. Removing the entity facing this STAA cost results in a much smaller average small entity cost to the entities with impacts greater than 3 percent. Average cost decreases from $1,083,824 to $964,491 using Data Axle and from $590,327 million to $279,599 using D&B Hoovers.
The small entity analysis indicates that the final rule will not impose a significant economic burden on small entities by imposing a cost to a substantial number of entities exceeding the threshold amount of 1 percent of small entity revenues. This analysis using D&B Hoovers data further confirms that the final rule will not impose a significant economic burden and suggests that the final rule has a smaller impact on small private sector entities.
Exhibit C-14: Cost Impacts as a Proportion of Total Revenue for Small Private Sector Entities, Data Axle.
Proportion of Revenue Impacted |
Number of Small Entities* |
% of Small Entities |
Average Small Entity Cost ($)** |
Average Small Entity Revenue** |
< 1% |
2,393 |
90.8% |
$72,525 |
$72,392,517 |
1% - 3% |
167 |
6.3% |
$629,271 |
$41,222,630 |
Total >3% |
75 |
2.8% |
$1,083,824 |
$19,034,833 |
Total >3% without HF Alkylation |
74 |
2.8% |
$964,591 |
$19,018,195 |
Small entity with HF Alkylation |
1 |
0.04% |
$7,283 ,931 |
$19,900,000 |
*Small entity count differs slightly from Exhibit C-9 due to rounding.
** For entities that are determined by revenue, the average small entity cost and revenue are considerably lower ($31.5 thousand and $6.0 million, respectively).
Exhibit C-15: Cost Impacts as a Proportion of Total Revenue for
Small Private Sector Entities, D&B Hoovers.
Proportion of Revenue Impacted |
Number of Small Entities |
% of Small Entities |
Average Small Entity Cost ($)* |
Average Small Entity Revenue* |
< 1% |
2,128 |
94.0% |
$80,820 |
$162,812,788 |
1% - 3% |
92 |
4.1% |
$382,763 |
$23,460,790 |
Total >3% |
43 |
1.9% |
$590,327 |
$5,800,884 |
Total >3% without HF Alkylation |
42 |
1.9% |
$279,599 |
$5,181,077 |
Small entity with HF Alkylation |
1 |
0.04% |
$7,292,953 |
$19,900,000 |
* For entities that are determined by revenue, the average small entity cost and revenue are considerably lower ($72.500 and $8.7 million, respectively).
APPENDIX D: STAA Implementation Measure Costs
The below table presents data used to develop the per measure costs used to estimate costs of STAA implementation. The “Sector” column presents the NAICS 324 or NAICS 325 sector that the data is applicable to. In some cases, this is a single sector based on the source of data providing information and cost data on a measure for the particular sector. In other cases, when the sector could not be determined from the source, both sectors are considered. The “Measure” column contains a brief description of the measure, as best described in the source where the measure was identified. “Capital Cost” and “Recurring Cost” fields present data converted to 2022 dollars as sources reported cost data in a variety of dollar years. Not all sources reported recurring costs and therefore some are left as “N/A”. In addition, some sources reported a range of capital costs and in those cases the range of original values are reported. EPA uses a mid-point when there was a range. The “Measure Identification Source” column indicates where the example measure was identified from with the following “Measure URL” column containing the source link. In some cases, the name of a measure was identified in this column but there was no accompanying cost data. In the “Notes on Measure Cost” column EPA presents additional links and notes, particularly when the measure identified has costs from a different source.
Sector |
Measure |
Capital Cost 2022 Dollars |
Recurring Annual Cost 2022 Dollars |
Recurring Cost as a % of Capital Cost |
Minimum Capital Cost |
Maximum Capital Cost |
Measure Identification Source |
Measure URL |
Notes on Measure Cost |
324 |
Pressure vessel design |
$550,000 |
$10,000 |
2% |
$100,000 |
$1,000,000 |
PrimaTech |
https://www.primatech.com/technical/safer-technologies-and-alternative-analysis |
Recurring cost from: https://www.maintenanceandengineering.com/2020/04/15/what-is-the-real-cost-of-pressure-vessel-repair/ . Repair costs run into tens of thousands of dollars. |
324 |
Major piping replacement |
$12,155,797 |
N/A |
N/A |
N/A |
N/A |
Amendments Rule |
|
|
324 |
Replace all carbon steel piping that transports corrosive liquids with more corrosion-resistant chrome-alloy piping |
$17,712,288 |
N/A |
N/A |
N/A |
N/A |
Safety.BLR.com: Chevron to pay $1 million to settle Richmond Refinery citations (2 Aug 2017) |
||
324 |
Major upgrades to HF alkylation unit (e.g., rapid acid transfer system upgrades, water mitigation system upgrades, HF detection system upgrades, process heater/burner management upgrades) |
$6,000,000 |
N/A |
N/A |
$2,000,000 |
$10,000,000 |
ERG |
|
|
324 |
Develop and implement criteria and new innovative procedures to monitor equipment to ensure safe operation of process safety equipment and alert operators when equipment should be replaced |
$5,904,096 |
$354,246 |
6% |
N/A |
N/A |
Safety.BLR.com: Chevron to pay $1 million to settle Richmond Refinery citations (2 Aug 2017) |
Chevron reports 2018 operating costs equal 6% of value of property, capital, and equipment at cost ($20,544 million / $340,244 million): https://chevroncorp.gcs-web.com/static-files/87b5b33d-4328-494b-afe9-6a0dc01dd556
|
|
324/325 |
Storage vessel controls: install internal floating roof storage vessel (IFR) with proper seals and install enhanced fitting controls to reduce emissions |
$144,433 |
$12,999 |
9% |
$48,144 |
$398,394 |
CAA Section 112(d)(6) Technology Review for Storage Vessels Located in the Ethylene Production Source Category |
https://www.regulations.gov/document/EPA-HQ-OAR-2017-0357-0015
|
Cost per facility with ethylene production units (including petroleum refineries). Recurring costs are 5% of capital costs for maintenance + 4% of capital costs for property taxes, insurance, and administration. |
324/325 |
Storage vessel retrofit with geodesic domes: convert external floating roof storage vessels (EFRs) to IFRs via use of geodesic domes to reduce emissions |
$1,777,428 |
$71,097 |
4% |
$274,423 |
$4,946,830 |
CAA Section 112(d)(6) Technology Review for Storage Vessels Located in the Ethylene Production Source Category |
https://www.regulations.gov/document/EPA-HQ-OAR-2017-0357-0015 |
Cost per facility with ethylene production units (including petroleum refineries). Recurring costs are 4% of capital costs for property taxes, insurance, and administration. |
324/325 |
Storage vessel enhanced monitoring: liquid level overfill warning monitors and roof landing warning monitors on storage vessels with IFR or EFR (or leak detection and repair for fittings on fixed roof storage vessels) to reduce emissions |
$22,447 |
N/A |
N/A |
$5,657 |
$51,153 |
CAA Section 112(d)(6) Technology Review for Storage Vessels Located in the Ethylene Production Source Category |
https://www.regulations.gov/document/EPA-HQ-OAR-2017-0357-0015 |
Cost per facility with ethylene production units (including petroleum refineries). |
324/325 |
Infrared camera for gas leak detection (e.g., FLIR GFx320, GF306, or GF620) |
$106,089 |
N/A |
N/A |
$29,083 |
$145,417 |
Summary of Data Gathering Efforts: Emission Control and Emission Reduction Activities |
https://www.regulations.gov/document/EPA-HQ-OAR-2010-0682-0194 |
Teledyne FLIR example: https://www.flir.com/products/gfx320/?model=74902-0102&vertical=optical+gas&segment=solutions |
324/325 |
Small STAA project: human factors techniques (program ring back feature on alarms, program warning alarms, consistency of read outs, alarms on inlet streams, changes to make consolidation of control rooms possible, nominations screens) |
$121,558 |
N/A |
N/A |
$1,216 |
$121,558 |
Amendments Rule |
|
Human factors techniques in chemical process industry to reduce risks to humans. See: Attwood, Dennis and David Fennell, “Cost-effective Human Factors Techniques for Process Safety,” CCPS International Conference and Workshop, October 2-5, 2001, Toronto, ON, CANADA. |
324/325 |
New responder training |
N/A |
$49,832 |
N/A |
$19,933 |
$79,731 |
Amendments Rule |
https://www.regulations.gov/document/EPA-HQ-OEM-2015-0725-0029 |
|
325 |
Piping replacement |
$1,215,580 |
$48,623 |
4% |
N/A |
N/A |
Amendments Rule |
Small scale piping replacement project costs about $1 million. See public comment EPA-HQ-OEM-2015-0725-0579, pp 142. Comment submitted by AFPM. Also see public comment EPA-HQ-OEM-2015-0725-0536-29 submitted by API. Labor and maintenance costs in conventional ethylene plant are 3-5% of fixed capital investment: https://vdoc.pub/documents/plant-design-and-economics-for-chemical-engineers-2e23idrq1qf0 |
|
325 |
Upgrade facility, install new plating line, and implement a closed-loop water treatment system |
$4,862,319 |
N/A |
N/A |
N/A |
N/A |
TURI |
Costs based on implementation by Columbia Manufacturing: https://www.turi.org/content/download/9921/168937/file/Columbia+Manufacturing+OTA.+2015.pdf |
|
325 |
Add trivalent chromium plating |
$56,329 |
$24,318 |
43% |
N/A |
N/A |
TURI |
Costs associated with Independent Plating: https://www.mass.gov/files/2017_competitiveness_report_ota_and_turi_6.pdf |
|
325 |
Parametric monitoring equipment for CO emissions using temperature and other combustion operating parameters |
$63,916 |
$47,243 |
74% |
N/A |
N/A |
Cost Reports and Guidance for Air Pollution Regulations: EPA Airport Pollution Control Manual |
Emissions control costs: https://www.epa.gov/sites/default/files/2020-07/documents/cs2ch4.pdf |
|
325 |
Sprinkler system that is triggered by smoke or heat |
$568,803 |
$27,808 |
5% |
$252,801 |
$884,804 |
National Academy of Sciences; The Use and Storage of Methyl Isocyanate (MIC) at Bayer CropScience |
https://nap.nationalacademies.org/resource/13385/MIC-Summary-Final.pdf |
Cost based on average sf NAICS 325: https://www.eia.gov/consumption/manufacturing/data/2010/pdf/Table9_1.pdf) *$2-7 (price per sf estimate for adding sprinkler system): https://smokeguard.com/blog/2022/february/02/what-is-the-cost-of-a-commercial-fire-sprinkler-system#:~:text=If%20your%20project%20is%20new,per%20square%20foot%20of%20coverage Maintenance cost = $0.03-0.22/sq ft for larger facilities: https://www.costowl.com/b2b/security/security-fire-sprinkler-system/#:~:text=Installing%20fire%20sprinklers%20costs%20%241-%242%20per%20square%20foot,or%203%C2%A2-22%C2%A2%20per%20square%20foot%20for%20larger%20facilities |
325 |
Inerting dust cloud by N2, CO2 and rare gases |
$250,000 |
$107,719 |
43% |
$100,000 |
$400,000 |
Amyotte, Khan, & Klez |
Large nitrogen generator: https://gasgenerationsolutions.com/nitrogen-generator-price/ https://nitrogen-generators.com/nitrogen-generator-price/. Cost for measure & metering stations, inert gas sluices, nozzles for injecting liquid N2 into gas stream, & inert blanketing in tanks. 2015 article on cost for N2 system foundation + gas recovery unit + N2 recovery electric costs + maintenance: N2 supply system, 10-hp blower, convey line, 2x10ft^3 hoppers, 6" rotary airlock, dust filter, air operated discharge valve, N2 recovery line: https://www.chemengonline.com/combustible-dust-explosions-inerting/?pagenum=1 |
|
325 |
Custom refrigerated condenser system (including a refrigeration unit, a VOC condenser, and a recovery tank) used for emissions control |
$177,959 |
$29,701 |
17% |
N/A |
N/A |
Cost Reports and Guidance for Air Pollution Regulations: EPA Airport Pollution Control Manual |
$145,000 capital cost = {[($46,480 refrigeration unit + $13,210 VOC condenser + $4,751 recovery tank)*1.18 for instrumentation, controls, taxes, & freight]*1.71 install factor}*1.10 contingency factor. $24,200 recurring cost = operating labor + maintenance + utilities + overhead + admin charges + property tax + insurance. |
|
325 |
New chromatography system: R&D & testing & medium pressure liquid chromatography equipment |
$116,716 |
N/A |
N/A |
N/A |
N/A |
TURI |
Costs based on implementation by ChemGenes: https://www.mass.gov/files/chemgenes_corp_-_2018.pdf |
|
325 |
Solvent recovery system |
$35,701 |
N/A |
N/A |
N/A |
N/A |
TURI |
Costs based on ChemGenes: https://www.mass.gov/files/chemgenes_corp_-_2018.pdf |
|
325 |
Install a new zinc oxide dispensing system that reduces toxic waste and materials handling |
$56,069 |
N/A |
N/A |
N/A |
N/A |
TURI |
Costs based on implementation by Acushnet Rubber Company: https://www.mass.gov/files/acushnet-rubber-company_5.pdf |
|
325 |
Good management practices/standard operating procedures |
N/A |
$184,000 |
N/A |
N/A |
N/A |
National Academy of Sciences; The Use and Storage of Methyl Isocyanate (MIC) at Bayer CropScience |
https://nap.nationalacademies.org/resource/13385/MIC-Summary-Final.pdf |
Cost based on good manufacturing practices (GMP) compliance cost per medium establishment: https://instantgmp.com/support/gmp-compliance/gmp-compliance-cost/ |
325 |
Operator training |
N/A |
$20,000 |
N/A |
N/A |
N/A |
National Academy of Sciences; The Use and Storage of Methyl Isocyanate (MIC) at Bayer CropScience |
https://nap.nationalacademies.org/resource/13385/MIC-Summary-Final.pdf |
Cost from heavy equipment operator training cost: https://totalequipmenttraining.com/blog/how-much-does-heavy-equipment-operator-training-cost/ . Alternative source: https://www.cat.com/en_US/support/cat-training/Heavy-Equipment-Operator-Training.html#tabs-5f3b6b54f8-item-724efa7516-tab |
325 |
Management systems (e.g., alarm management program) |
$195,621 |
N/A |
N/A |
$167,675 |
$223,567 |
National Academy of Sciences; The Use and Storage of Methyl Isocyanate (MIC) at Bayer CropScience |
https://nap.nationalacademies.org/resource/13385/MIC-Summary-Final.pdf |
|
325 |
Smaller-scale and larger-scale procedural measures |
$50,000 |
N/A |
N/A |
$5,000 |
>$50,000 |
ERG correspondence with EPA |
|
|
325 |
Pressure vessel design |
$30,000 |
$10,000 |
33% |
$3,500 |
$60,000 |
PrimaTech |
https://www.primatech.com/technical/safer-technologies-and-alternative-analysis |
Cost based on H2: https://www.energy.gov/sites/default/files/2016/09/f33/fcto_h2_storage_700bar_workshop_2_james.pdf . Potential alternate source: https://www.halvorsenusa.com/resources/pressure-vessel-cost-estimations-pricing-rates-expenses/#:~:text=Small%20pressure%20vessels%20such%20as,%241%2C000%2C000.00%20to%20manufacture%20and%20deliver . Recurring cost from: https://www.maintenanceandengineering.com/2020/04/15/what-is-the-real-cost-of-pressure-vessel-repair/ . Repair costs run into tens of thousands of dollars. |
325 |
Modular spill containment berms |
$19,450 |
N/A |
N/A |
$4,238 |
$28,943 |
PrimaTech |
https://www.primatech.com/technical/safer-technologies-and-alternative-analysis |
Best-selling modular spill containment berm cost: https://store.interstateproducts.com/products/ultratech-modular-gorilla-spill-containment-berm-55-x-55-x-6.html . Minimum cost is for a one-step spill containment berm: https://store.interstateproducts.com/products/one-step-spill-containment-berm-12-x-36-x-24.html . Maximum cost is most expensive containment berm with a listed price (more expensive require quotes): https://store.interstateproducts.com/products/ultra-containment-wall-system-61-x-61-x-3-8795.html . |
325 |
Blast wall |
$923,773 |
N/A |
N/A |
$473,042 |
$1,568,020 |
PrimaTech |
https://www.primatech.com/technical/safer-technologies-and-alternative-analysis |
Cost from: https://blog.redguard.com/blast-resistant-building-cost |
325 |
Alarms (e.g., commercial fire alarm system) |
$1,011,205 |
$101,120 |
10% |
$505,602 |
$1,516,807 |
PrimaTech |
https://www.primatech.com/technical/safer-technologies-and-alternative-analysis |
Cost based on average sf NAICS 325: https://www.eia.gov/consumption/manufacturing/data/2010/pdf/Table9_1.pdf) *$4-12 (price per sf to add complicated or retrofit fire alarm system): https://www.thepricer.org/commercial-fire-alarm-system-cost/#:~:text=Holding%20other%20elements%20constant%2C%20a%20typical%20system%20%E2%80%93,%246%20per%20square%20foot%20covered%20by%20the%20system) . $50-100/month monitoring & miscellaneous annual fees of 10% of total project cost: https://www.costowl.com/b2b/security/security-fire-alarm-system/ . |
325 |
TURA measure |
$217,476 |
N/A |
N/A |
$8,551 |
$217,476 |
Benefit-Cost Analysis of the Massachusetts Toxics Use Reduction Act |
Average capital costs per facility under TURA in 1997 (appears to be upward trend in average capital costs 1990-1997). |
|
APPENDIX E: UMRA Written Statement
I. Introduction
Title II of the 1995 Unfunded Mandates Reform Act (UMRA; 2 U.S.C. 1531-1538) requires Federal agencies, unless otherwise prohibited by law, to assess the effects of their regulatory actions on State, local, and tribal governments and the private sector. Specifically, Section 202 of UMRA generally requires Federal agencies to prepare a written statement, including a cost-benefit analysis, for each proposed and final rule with "Federal mandates" that may result in expenditures by State, local, and tribal governments, in the aggregate, or to the private sector, of $100 million or more in any one year. Section 202 requires that “Written Statements” contain five elements of information:
1. An identification of the provision of Federal law under which the rule is being promulgated;
2. A qualitative and quantitative assessment of the anticipated costs and benefits of the Federal mandate, including the costs and benefits to State, local, and tribal governments or the private sector, as well as the effect of the Federal mandate on health, safety, and the natural environment;
3. Estimates by the agency, if and to the extent that the agency determines that accurate estimates are reasonably feasible, of:
(a) the future compliance costs of the Federal mandate; and
(b) any disproportionate budgetary effects of the Federal mandate upon any particular regions of the nation or particular State, local, or tribal governments, urban or rural or other types of communities, or particular segments of the private sector;
4. Estimates by the agency of the effect on the national economy, such as the effect on productivity, economic growth, full employment, creation of productive jobs, and international competitiveness of U.S. goods and services, if and to the extent that the agency in its sole discretion determines that accurate estimates are reasonably feasible and that such effect is relevant and material; and
5. Description of the extent of the agency’s prior consultation with elected representatives (under section 204) of the affected State, local, and tribal governments, including a summary of the comments and concerns that were presented by State, local, or tribal governments either orally or in writing to the agency; and a summary of the agency’s evaluation of those comments and concerns.
This document constitutes the “Written Statement” to meet this requirement for the RMP rule. The EPA has conducted a cost-benefit analysis for this action, which is included in this RIA.
II. Response to Five Information Elements
Identification of the Provision of Federal Law under Which the Rule is Being Promulgated
The statutory authority for the RMP rule is provided by section 112(r) of the CAA as amended (42 U.S.C. 7412(r)). Each of the portions of the RMP rule EPA implemented in this notice are based on EPA’s rulemaking authority under section 112(r)(7) of the CAA (42 U.S.C. 7412(r)(7)
2. Cost to State, Local, and Tribal Governments and the Private Sector
As estimated in the RIA, approximately 11,740 facilities have filed RMPs with EPA and are potentially affected by the rule changes. These facilities range from petroleum refineries and large chemical manufacturers to water and wastewater treatment systems; chemical and petroleum wholesalers and terminals; food manufacturers, packing plants, and other cold storage facilities with ammonia refrigeration systems; agricultural chemical distributors; midstream gas plants; and a limited number of other sources that use RMP-regulated substances.
EPA estimates annualized costs of $256.9 million at a 3% discount rate and $296.9 million at a 7% discount rate. Of this amount, average annualized costs to State/local governments total $5.0 million at a 3% discount rate and $5.1 million at 7% discount rate consisting of estimated regulatory compliance costs for State/local governments that currently own or operate RMP-regulated sources plus costs to local governments (i.e., LEPCs, emergency response officials and state implementing agencies) for rule familiarization and voluntary participation in coordination activities, exercises and review of information submitted to LEPCs. The estimated average annualized cost to the private sector totals approximately $252.2 million at a 3% discount rate and $292.1 million at a 7% discount rate.
Although there are RMP facilities located on tribal lands, EPA does not have information on the number of tribal-owned regulated facilities, and therefore, has not estimated costs to tribes in the RIA for the rule.
3. Extent to Which Costs to State, Local, and Tribal Governments May be Paid by EPA or Other Federal Agencies, or to which there are Available Federal/EPA Resources to Carry out a Federal Intergovernmental Mandate
EPA does not provide funding to State, local or tribal governments for implementation of the RMP rule; or to fund costs for participation in emergency response coordination activities and facility exercises; or review information submitted to LEPC.
4. Estimates of Future Compliance Costs and Budgetary Effects on Particular Regions of the Country, or Particular State, Local, or Tribal Governments or Communities, or Particular Segments of the Private Sector
The RIA assessed potential effects of the RMP rule on regulated entities (including government entities subject to the rule) and voluntary costs to State and local governments that participate in emergency response coordination activities, facility exercises, and review of reports submitted to LEPCs or local emergency response officials.
5. Extent of EPA’s Prior Consultation with Affected State, Local, and Tribal Governments
Over the 23 years of implementing the RMP program and, most recently through EO 13990 listening sessions, meetings, and public hearings, EPA has engaged States and local communities to discuss chemical safety issues. In the two EO 13990 listening sessions and three proposal hearings, held in July 2021 and September 2022, States and local communities identified lack of facility coordination with local responders and the community as a key barrier to successful local community preparedness. Additionally, EPA has held consultations with States and local communities through participation in the NASTTPO annual meetings to discuss key issues related to chemical facility and local community coordination and the areas of the RMP regulations which need to be modernized to facilitate this coordination and improve local emergency preparedness and prevention. Key priority options discussed with NASTTPO States and local communities included improving emergency response coordination between RMP facilities and LEPCs/first responders.
This action is not subject to the requirements of section 203 of UMRA because it contains no regulatory requirements that might significantly or uniquely affect small governments. On April 7, 2022, September 1, 2022, and September 5, 2023, EPA met with small governments concerning the regulatory requirements that might affect them. Also, through the May 28, 2021, notice of virtual public listening sessions; request for public comment (86 FR 28828) and August 31, 2022, NPRM (87 FR 53556), EPA sought feedback from governmental entities while formulating the revisions in this action.
1 Note that the acronym RMP is used generally to refer to both the Risk Management Program and risk management plans. For clarity, throughout this RIA, RMP will refer to the Risk Management Program, and the term “risk management plan” will be written out.
2 EPA is making RMP information publicly available to allow facilities to identify and locate proximate facilities.
3 EPA believes this distance to be reasonable given that 90 percent of all toxic worst-case distances to endpoints are 6 miles or less, and almost all flammable worst-case distances are less than 1 mile.
4 EPA plans to make RMP locational information for the entire regulated community available online. Currently, members of the public can determine whether a neighboring facility is an RMP facility through searching EPA’s Envirofacts.
5Additional data on quantified damages caused by RMP-reportable accidents at RMP facilities for prior time periods, including from 2004 to 2013 and from 2014 to 2016, are presented in Chapter 3, Exhibit 3-16. Note that the averages include accidents for which the damages were zero in individual categories (but non-zero in at least one category). The impacts also include environmental damage categories, including soil and water contamination, among others, which EPA was not able to monetize. Information on additional unmonetized or unquantified damages is also presented in Chapter 3 and Chapter 6.
6 See Chapter 3, Exhibit 3-16, for presentations of monetized damages for prior time periods. To obtain those estimates, EPA re-estimated unit damage costs for the prior time periods by applying the same set of assumptions used for the current final rule analysis and updating dollars to 2022. In particular, EPA re-estimated the costs assuming a fatality is valued at $10.4 million instead of $8.6 million (using the BEA GDP deflator), hospitalization costs of $45,000 instead of $36,000, and BLS mean hourly wage rates of $28.88 instead of $22.65. Previously, mean hourly wage was estimated as the cost per hour to shelter-in-place or evacuate. Relying on updated guidance, this final rule analysis uses mean hourly wage plus voluntary benefits less taxes, which is estimated at $36.66. For 2004 to 2013, estimated monetized damages from RMP facility accidents are $473.2 million (2022$) on average per year; for 2014 to 2016, estimated monetized damages are $441.7 million (2022$) on average per year. In total, over the 2004 to 2020 time period, the average per year is $482.8 and the average per accident is $3.4 million (2022$). EPA also updated accident data which can be continuously updated in RMP filings. This resulted in differences in the raw accident data between the December 31, 2020, RMP data used in this final rule and RMP data used in the amendments rule and reconsideration rule RIAs.
7 Federal Emergency Management Agency. Phillips Petroleum Chemical Plant Explosion and Fire. October 1989. https://www.interfire.org/res_file/pdf/Tr-035.pdf.
8 Hay, Alastair, A Technical Report on What Caused Italy’s Dioxin Disaster Has Too Many Loopholes, Nature, 281, 521 (October 18, 1979). http://www.nature.com/nature/journal/v281/n5732/pdf/281521a0.pdf.
9 40 CFR 68.3 defines hot work as work involving electric or gas welding, cutting, brazing, or similar flame or spark-producing operations.
10 Guidance documents for propane storage, refrigeration, water/wastewater treatment, warehouses, chemical distributors, and others are available at: https://www.epa.gov/rmp/guidance-facilities-risk-management-programs-rmp.
11 EPA. April 2004. General Guidance on Risk Management Programs for Chemical Accident Prevention (40 CFR Part 68). EPA-550-B-04-001. Chapter 2. http://www2.epa.gov/sites/production/files/2013-10/documents/chap-02-final.pdf.
12 For more detail on the West Texas explosion and other accidents that led to the 2017 amendments rule (Accidental Release Prevention Requirements: Risk Management Programs Under the Clean Air Act), see the 2017 amendments rule RIA.
13 https://www.whitehouse.gov/the-press-office/2013/08/01/executive-order-improving-chemical-facility-safety-and-security.
14 In 2013 and 2014, as part of the E.O. 13650 activities, the federal government held a dozen listening sessions, supplemented by two online webinars. For a list of locations and link to the notes for these sessions go to https://www.regulations.gov/search?filter=DHS-2013-0075.
15 OSHA’s RFI was published on December 9, 2013 (78 FR 73756) and EPA’s RFI was published on July 31, 2014 (79 FR 44604).
16 RMP Coalition’s Petition for Reconsideration and Request for Agency Stay Pending Reconsideration of Final RMP rule (82 FR 4594, January 13, 2017), February 28, 2017. Hogan Lovells U.S. LLP, Washington, DC. Document ID: EPA-HQ-OEM-2015-0725-0759 (RMP Coalition petition).
17 The Chemical Safety Advocacy Group (CSAG) Petition and Reconsideration and Stay Request of the Final RMP rule (82 FR 4594, January 13, 2017) March 13, 2017. Hunton & Williams, San Francisco, CA. Document No. EPA-HQ-OEM-2015-0725-0766 (CSAG petition).
18 Petition for Reconsideration and Stay Submitted by The States of Louisiana, Arizona, Arkansas, Florida, Kansas, Texas, Oklahoma, South Carolina, Wisconsin, West Virginia, and the Commonwealth of Kentucky by and through Governor Matthew Bevin, March 14, 2017. Document ID: EPA-HW-OEM-2015-0725-0762 (States petition).
19 https://www.whitehouse.gov/briefing-room/presidential-actions/2021/01/20/executive-order-protecting-public-health-and-environment-and-restoring-science-to-tackle-climate-crisis/
20 EPA is making RMP facility location information publicly available to allow facilities to identify and locate proximate facilities.
21 EPA believes this distance to be reasonable given that 90 percent of all toxic worst-case distances to endpoints are 6 miles or less, and almost all flammable worst-case distances are less than 1 mile.
22 EPA plans to make RMP location information for the entire regulated community available online. Currently, the public can determine whether a neighboring facility is an RMP facility through searching EPA’s Envirofacts.
23 Swimming pools will not be regulated under RMP if they use or store chlorine below the threshold amount of 2,500 lbs. There have been no RMP-reportable accidents from regulated swimming pools.
24 More detail on the RMP database, including access to the RMP database is available at https://www.epa.gov/rmp/accessing-rmp-data.
25 See Section 1.1 History, for an explanation.
26 Some facilities that listed themselves as Program 2 have either selected the wrong program level on their RMP submission or have incorrectly indicated that they are not subject to PSM, even though they handle OSHA PSM chemicals in quantities far above the OSHA threshold. Because of errors in the other direction among the public systems (i.e., facilities in States not subject to PSM that listed themselves as Program 3), the analysis did not attempt to correct the errors.
27 August 2021 RMP Database.
28 Cal. Code Regs. tit. 8, § 5189.1(l), Process Safety Management for Petroleum Refineries, Hierarchy of Hazard Controls Analysis.
29 The RMP program requires facilities to report accidents that have certain impacts such as fatalities, injuries, evacuations, property damage and so on – these are labeled RMP-reportable accidents. Facilities sometimes report accidents with no RMP-reportable impacts, which are labeled nonreportable accidents. EPA has dropped the nonreportable accidents from the analysis.
30 The accidents included those that occurred at facilities that may have subsequently deregistered from the RMP Program. As such, some accidents analyzed may have occurred at facilities no longer subject to the RMP rule. Offsetting these, however, is the registration of new facilities after 2020.
31 For a description of damages from this case see Section 3.2.1 CSB Report, Fire and Explosions at Philadelphia Energy Solutions Refinery Hydrofluoric Acid Alkylation Unit, Factual Update, October 16, 2019, https://www.phila.gov/media/20191204161826/US-CSB-PES-Factual-Update.pdf.
32 CSB 2022a. Fire and Explosions at Philadelphia Energy Solutions Refinery Hydrofluoric Acide Alkylation Unit. Investigation Report. 2022. October 11. https://www.csb.gov/philadelphia-energy-solutions-pes-refinery-fire-and-explosions-/
33 Ibid.
34 Maykuth, Andrew. 2020. “Refinery to reimburse city $1.8 million – Philadelphia Energy Solutions says it will repay the costs of emergency response to a fire and explosion that led to its closure.” Philadelphia Inquirer. April 18.
35 CSB. 2022a.
36 CSB. 2022a.
37 Miller, Jeanette and Sylvia Bennett. 2022. “3 years after refinery fire, we’re still worried – Residents remain concerned about benzene emissions as redevelopment continues at the site.” Philadelphia Inquirer. June 21.
38 CSB. 2022a.
39 Maykuth, Andrew. 2020.
40 Sutton, Joe and Madeline Holcombe. 2019. “A fire at a Philadelphia oil refinery sparked an explosion felt for miles.” CNN. June 21. https://www.cnn.com/2019/06/21/us/philadelphia-refinery-fire/index.html
41 Ibid.
42 Ibid.
43 McCoy, Craig R. and William Bender. 2019. “Despite explosions and fire, the city dodged a catastrophe.” Philadelphia Inquirer. June 30.
44 Marsh JLT Specialty, "100 Largest Losses in the Hydrocarbon Industry," 27th ed., March 2022. https://www.marsh.com/us/industries/energy-and-power/insights/100-largest-losses/100-largest-losses-report-download.html .
45 Maykuth, Andrew. 2019. “Safety Questioned – False gas reading at refinery fire cited by experts as a need for better protections.” Philadelphia Inquirer. July 25.
46 Schmidt, Sophia. 2022. “Community benefits agreement talks to start in 2023 for Philly refinery redevelopment." WHYY. November 18. https://whyy.org/articles/pes-refinery-redevelopment-community-benefits-agreement/
47 Sutton, Joe and Madeline Holcombe. 2019.
48 CSB. 2022a.
49 CSB. 2022b. Recommendations: Philadelphia Energy Solutions (PES) Refinery Fire and Explosions (5 Recommendations). October 11. https://www.csb.gov/recommendations/?F_InvestigationId=3604
50 CSB. 2022c. Popcorn Polymer Accumulation, Pipe Rupture, Explosions, and Fires at TPC Group Chemical Plant Butadiene Unit. Investigation Report. 2022. December.
51 Ibid.
52 Ibid.
53 Ibid.
54 U.S. Chemical Safety and Hazard Investigation Board. 2022c. Popcorn Polymer Accumulation, Pipe Rupture, Explosions, and Fires at TPC Group Chemical Plant Butadiene Unit. Investigation Report. 2022. December.
55 Dick, Jacob, Kim Brent, Monique Batson, Ronnie Crocker, and Kaitlin Bain. 2019. “SE Texas town rocked by chemical plant explosion.” Houston Chronicle. November 27. https://www.chron.com/news/article/The-latest-Explosion-at-Port-Neches-plant-14866093.php
56 Kennedy, Merrit. 2019. “Massive Explosion Rips Through Texas Chemical Plant.” National Public Radio. November 27. https://www.npr.org/2019/11/27/783263942/massive-explosion-rips-through-texas-chemical-plant
57 CSB. 2022c.
58 Dick et al. 2019.
59 Kennedy. 2019.
60 CSB. 2022c.
61 Ibid.
62 CBS News. 2019. 60,000 people forced to evacuate after explosions at Texas chemical plant. November 27. https://www.cbsnews.com/news/explosion-texas-plant-port-neches-chemical-plant-texas-tcp-fire-lanxess-charleston-south-carolina-emergency-today/
63 CSB. 2022c.
64 CBS News. 2019.
65 Toal, Margaret, Nicholas Bogel-Burroughs and Manny Fernandez. 2019. “Thousands Evacuated in Texas After Explosion at Port Neches Chemical Plant.” The New York Times. November 27. https://www.nytimes.com/2019/11/27/us/texas-explosion-port-neches-tpc.html
66 Dick et al. 2019.
67 Ibid.
68 CSB. 2022c.
69 Ibid.
70 Toal et al. 2019.
71 Ibid.
72 CSB. 2022c.
73 CSB. 2022c.
74 The Guardian. 2019. Texas: city residents urged to evacuate after chemical plant explosions. December 5. https://www.theguardian.com/us-news/2019/dec/05/texas-port-neches-evacuation-air-quality-chemical-plant-explosions
75 TPC Group – Port Neches Operation, RMP Plan, received by EPA December 10, 2020
76 Marsh JLT Specialty. 2022.
77 TPC Group. 2020.
78 Kennedy. 2019.
79 CSB. 2022c.
80 Dick et al. 2019.
81 Toal et al. 2019.
82 CSB. 2022c.
83 TPC Group. 2020.
84 After Two Major Refinery Accidents, Valero and Benicia Take Steps To Work Better Together https://www.kqed.org/news/11756861/after-two-major-refinery-accidents-valero-and-benicia-take-steps-to-work-better-together .
85 https://www.kqed.org/news/11756861/after-two-major-refinery-accidents-valero-and-benicia-take-steps-to-work-better-together .
87 For time valuation guidelines, see: https://www.epa.gov/environmental-economics/epa-valuing-time-handbook-2020. BLS data is from: http://www.bls.gov/news.release/ecec.t01.htm. Census data is from: https://www.census.gov/data/tables/2022/demo/income-poverty/p60-276.html.
88 Freeman III, A.M. 2003. The Measurement of Environmental and Resource Values: Theory and Methods. 2nd Ed. Washington, D.C.: Resources for the Future.
89 HHS estimates the average hospital charge per emergency department visit was $5,587 in 2020 and the average hospital cost per emergency department visit was $757 per visit (http://hcupnet.ahrq.gov ). Charges differ from costs because they are based on prices for services set by the health care provider before any discounts.
90 EPA assumes the value of time equals the value of an average worker’s after-tax wage and voluntary benefits (https://www.epa.gov/environmental-economics/epa-valuing-time-handbook-2020). BLS data estimate the September 2022 mean hourly wage at $28.88 across all workers. BLS data estimate that wage is 6% and voluntary benefits are 23.9% of mean total compensation. EPA estimates that mean voluntary benefits equal 34.6% of mean wage by dividing 23.9% by 69%. See: http://www.bls.gov/news.release/ecec.t01.htm. EPA estimates the income tax share of pretax income from 2022 Census data as: (median household income – post-tax median household income) / median household income = ($70,784 - $65,345) / $70,784 = 7.7%. See:
https://www.census.gov/data/tables/2022/demo/income-poverty/p60-276.html. EPA estimates the value of time per hour as $28.88 – 7.7% x $28.88 + 34.6% x $28.88 = $36.66.
91 The shelteringduration assumption is consistent with that used in the amendments rule RIA. In addition, CDC suggests sheltering-in-place in response to a chemical accident will be “a few hours” but recognizes that every emergency is different. https://emergency.cdc.gov/planning/Shelteringfacts.asp.
92 The evacuation duration assumption is consistent with that used in the amendments rule RIA. CDC data from the 1999-2008 Hazardous Substances Emergency Events Surveillance (HSEES) suggested that evacuations can last from a few minutes to 84 days, with a median duration of 2 hours and an average duration of 11 days (https://www.cdc.gov/mmwr/pdf/ss/ss6402.pdf ). Another study by Kim and Cho (2020) models evacuations completing in 5 hours https://pubmed.ncbi.nlm.nih.gov/33339315/.
93 To obtain these estimates, EPA re-estimated unit damage costs for the prior time periods by applying the same set of assumptions used for the current final rule analysis and updating dollars to 2022. In particular, EPA re-estimated the costs assuming a fatality is valued at $10.4 million instead of $8.6 million (using the BEA GDP deflator), hospitalization costs of $45,000 instead of $36,000, and BLS mean hourly wage rates of $28.88 instead of $22.65. Previously, mean hourly wage was estimated as the cost per hour to shelter-in-place or evacuate. Relying on updated guidance, this final rule analysis uses mean hourly wage plus voluntary benefits less taxes, which is estimated at $36.66. For 2004 to 2013, estimated monetized damages from RMP facility accidents are $473.2 million (2022$) on average per year; for 2014 to 2016, estimated monetized damages are $441.7 million (2022$) on average per year. In total, over the 2004 to 2020 time period, the average pr year is $482.8 and the average per accident is $3.4 million (2022$). EPA also updated accident data which can be continuously updated in RMP filings. This resulted in differences in the raw accident data between the December 31, 2020 RMP data used in this final rule and RMP data used in the amendments rule and reconsideration rule RIAs.
94 For discussion of these estimates, see Chapter 6 in the Amendments Rule RIA. Regulatory Impact Analysis Accidental Release Prevention Requirements: Risk Management Programs Under the Clean Air Act, Section 112(r)(7). U.S. Environmental Protection Agency (EPA), Office of Land and Emergency management (OLEM), Office of Emergency Management (OEM) 1200 Pennsylvania Ave., NW (Mail Code 5104A), Washington, DC 20460. February 14, 2016. Also see Chapter 6 in the Reconsideration Rule RIA, Regulatory Impact Analysis Reconsideration of the 2017 Amendments to the Accidental Release Prevention Requirements: Risk Management Programs Under the Clean Air Act, Section 112(r)(7), ). U.S. Environmental Protection Agency (EPA), Office of Land and Emergency management (OLEM), Office of Emergency Management (OEM) 1200 Pennsylvania Ave., NW (Mail Code 5104A), Washington, DC 20460. November 18, 2019.
95 Previous RMP RIAs include the 2019 reconsideration rule RIA (EPA-HQ-OEM-2015-0725-2089, available at: https://www.regulations.gov/document/EPA-HQ-OEM-2015-0725-2089 , 2017 amendments rule RIA (EPA-HQ-OEM-2015-0725-0734), available at: https://www.regulations.gov/document/EPA-HQ-OEM-2015-0725-0734 , and the 1996 “Economic Analysis in Support of Final Rule on Risk Management Program Regulations for Chemical Accident Release Prevention, as Required by Section 112(r) of the Clean Air Act” EPA-HQ-OAR-2004-0365-0066 (available at: https://www.regulations.gov/document/EPA-HQ-OAR-2004-0365-0066).
97 BLS Employer Costs for Employee Compensation. For December 2022, Table 1 shows that for civilian workers, on average for the nation, fringe benefits were 31.0% of total compensation, and 44.9% of wages.
98 For details explaining this approach, please see Handbook on Valuing Changes in Time Use Induced by Regulatory Requirements and Other EPA Actions, National Center for Environmental Economics, EPA-236-B-15-001 December 9, 2020.
99 Labor hours taken from average unit cost estimate submitted by Public Comment EPA-HQ-OEM-2015-0725-0579 provided by AFPM. EPA derived labor hours from the unit cost estimate provided by the commenter using standard wage rates.
100 Labor hours taken from the midpoint of the high and low labor hour estimates submitted by Public Comment EPA-HQ-OEM-2015-0725-0594 made by CSAG. EPA used the midpoint of the commenter’s high and low labor hour estimates to represent the labor burden of small/medium complex facilities.
101 Mackenzie, W. and N. Cusworth. 2007. “The Use and Abuse of Feasibility Studies.” Project Evaluation Conference. Melbourne, Vic, 19-20 June 2007. Noort, D J and Adams, C, 2006. Effective mining project management systems, in Proceedings International Mine Management Conference, pp 87-96 (The Australasian Institute of Mining and Metallurgy: Melbourne). http://www.enthalpy.com.au/wp-content/uploads/2013/09/The-Use-and-Abuse-of-Feasibility-Studies-Enthalpy.pdf .
102 McLeod, S. 2021. “Feasibility studies for novel and complex projects: Principles synthesized through an integrative review,” Project Leadership and Society.
103 For a detailed explanation of how the estimate was developed, see Appendix D in the amendments Rule Final RIA: US EPA. Regulatory Impact Analysis. Accidental Release Prevention Requirements: Risk Management Programs Under the Clean Air Act, Section 112(r)(7). Dec 16, 2016. (EPA-HQ-OEM-2015-0725-0734).
104 See AWWA comments on the proposed RMP amendments rule (EPA-HQ-OEM-2015-0725-0554).
105 AFPM provided a range of estimates from $100 million to $500 million, which EPA represents with a single value of $300 million. See AFPM comments on the proposed RMP amendments rule (EPA-HQ-OEM-2015-0725-0579).
106 See Jenkins, Scott (2017) “Lower costs for converting alkylation units from hydrofluoric to sulfuric acid,” Chemical Engineering. Nov 1.; Menachery, Martin (2017) “DuPont launches hydrofluoric acid alkylation conversion, expansion technology,” Refining & Petrochemicals. Sep 7 and Presley, Shane, Randy Peterson, Diwakar Rana, and Jason Nunez (2017) “Advances in HF acid alkylation conversion and expansion,” Digital Refining. December.
107 See Appendix D “STAA Project Cost Data” and “Estimating Practicability Study Costs”, pp 148-152. US EPA, 2016. Regulatory Impact Analysis, Accidental Release Prevention Requirements: Risk Management Programs Under the Clean Air Act, Section 112(r)(7).
108 See Appendix D. Measures from past EPA documents include: three from EPA-HQ-OAR-2022-0730-0073, which is a 2023 memorandum from ERG with subject “Clean Air Act Section 112(d)(6) Technology Review for Storage Vessels Located in the SOCMI Source Category that are Associated with Processes Subject to HON, Storage Vessels Associated with Processes Subject to Group I Polymers and Resins NESHAP, and Storage Vessels Associated with Processes Subject to Group II Polymers and Resins NESHAP” (available from: https://www.regulations.gov/document/EPA-HQ-OAR-2022-0730-0073); two from the EPA Airport Pollution Control Manual (available from https://www.epa.gov/economic-and-cost-analysis-air-pollution-regulations/cost-reports-and-guidance-air-pollution); and one from EPA-HQ-OAR-2010-0682-0194, which is a 2005 “Summary of Data Gathering Efforts: Emission Control and Emission Reduction Activities” (available from https://www.regulations.gov/document/EPA-HQ-OAR-2010-0682-0194). The Benefit-Cost Analysis of the Massachusetts Toxics Use Reduction Act is available from https://p2infohouse.org/ref/34/33463.pdf. The Toxic Use Reduction Institute case studies include: “Columbia Manufacturing, Inc. Plating Operations Achieve Zero Wastewater Discharge” (available from https://www.turi.org/content/download/9921/168937/file/Columbia+Manufacturing+OTA.+2015.pdf), "Toxics Use Reduction and Resource Conservation: Competitiveness Impacts for Massachusetts Businesses” (available from https://www.mass.gov/files/2017_competitiveness_report_ota_and_turi_6.pdf), “ChemGenes Corporation Toxics Use Reduction Case Study: Cumulative, Decade-long Assistance from OTA and TURI Allow ChemGenes to Significantly Reduce Toxics and Save Thousands” (available from https://www.mass.gov/files/chemgenes_corp_-_2018.pdf), and “Acushnet Rubber Company Toxics Use Reduction Case Study: Company Achieves ISO 14001 Certification” (available from https://www.mass.gov/files/acushnet-rubber-company_5.pdf). Five measures come from website of STAA consulting firm Primatech (available from https://www.primatech.com/technical/safer-technologies-and-alternative-analysis). Four measures come from the 2012 National Academy of Sciences report “The Use and Storage of Methyl Isocyanate (MIC) at Bayer CropScience” (available from https://nap.nationalacademies.org/resource/13385/MIC-Summary-Final.pdf). The Business & Learning Resources (BLR) news article “Chevron to pay $1 million to settle Richmond Refinery citations” published August 2, 2017 is available from https://safety.blr.com/workplace-safety-news/safety-administration/OSHA-and-state-safety-compliance-enforcement/Chevron-to-pay-1-million-to-settle-Richmond-Refine/ .
109 Four examples of facilities in Massachusetts achieving potential offsetting cost savings from implementing STAA-type measures are detailed in reports from the Massachusetts Office of Technical Assistance and the Massachusetts Toxic Use Reduction Institute:
Massachusetts Office of Technical Assistance and Technology (April 2015). “Columbia Manufacturing, Inc. Plating Operations Achieve Zero Wastewater Discharge.” Massachusetts Executive Office of Energy and Environmental Affairs. Accessed in April 2023 from: https://www.turi.org/content/download/9921/168937/file/Columbia+Manufacturing+OTA.+2015.pdf.
Massachusetts Toxic Use Reduction Institute and Massachusetts Office of Technical Assistance and Technology (September 2017). “Toxic Use Reduction and Resource Conservation: Competitiveness Impacts for Massachusetts Businesses”. TURI Report #2017-002. Accessed in April 2023 from: https://www.mass.gov/files/2017_competitiveness_report_ota_and_turi_6.pdf.
Massachusetts Office of Technical Assistance and Technology (April 2016). “ChemGenes Corporation Toxics Use Reduction Case Study: Cumulative, Decade-long Assistance from OTA and TURI Allow ChemGenes to Significantly Reduce Toxics and Save Thousands.” Massachusetts Executive Office of Energy and Environmental Affairs. Accessed in April 2023 from: https://www.mass.gov/files/chemgenes_corp_-_2018.pdf.
Massachusetts Office of Technical Assistance (February 1997). Acushnet Rubber Company Toxics Use Reduction Case Study: Company Achieves ISO 14001 Certification.” Massachusetts Executive Office of Environmental Affairs. Accessed in April 2023 from: https://www.mass.gov/files/acushnet-rubber-company_5.pdf.
110 BEA National Income and Product Accounts (NIPA) Table 1.1.9. Implicit Price Deflators for Gross Domestic Product. https://apps.bea.gov/iTable/iTable.cfm?reqid=19&step=3&isuri=1&nipa_table_list=13&categories=survey .
111 Power requirements for a variety of continuous emissions monitoring systems can be found in reports at https://www.epa.gov/emc/emc-continuous-emission-monitoring-systems. For example, Ammonia CEMS specification tables list power requirements, http://www.epa.gov/sites/default/files/2020-08/documents/04-nh3_cems.pdf .
112 One example sensor has a maximum power requirement of 5 watts (https://www.rkiinstruments.com/product/gd-70d-sample-draw-gas-detector/). One example 64-channel controller requires 150 watts. (https://www.rkiinstruments.com/product/mc-6400-fixed-systems-controller/). A 2023 Environmental Integrity Project report map appears to show Valero’s refinery in Texas City having 48 benzene sensors along its perimeter (https://storymaps.arcgis.com/stories/9cc8aa37cb34444dbb053a097c22ba07 ).
115 EPA identified translation websites (e.g., translate.com, translationpartner.com, and thetranslationcompany.com) with prices ranging from $0.06 to $0.40 per word. EPA assumes all facilities will translate 1,500 words for exercises, LEPC contact information, and new requirements. EPA averaged the number of words for regulated substance information, accident history, and emergency response program in an RMP (1,341 simple and 3,452 complex) and the number of regulated substances (1.5 simple and 15.5 complex) each from two simple facilities (California Dairies Fresno CA RMP and City of Saginaw WW Treatment Saginaw MI RMP) and from two complex facilities (Hexion Hope AR RMP and Valero Port Arthur TX RMP). Assuming one SDS per regulated substance and 2,576 words per SDS (the number of words in sample SDS from OSHA: https://www.osha.gov/sites/default/files/2020-04/Sample%20SDS%20Handout.pdf ), EPA estimates an average simple facility will translate (1,500 + 1,341 + 1.5 x 2,576) = 6,705 words and an average complex facility will translate (1,500 + 3,452 + 15.5 x 2,576) = 44,880 words per language. Rounding to the nearest thousand, EPA assumes 7,000 words per simple facility and 45,000 words per complex facility per language.
116 Value per hour of leisure = (average hourly wage) x (1 – income tax share of pretax income + voluntary benefits as a percent of wages) = $28.88 x (1 - 7.7% + 34.6%) = $36.66. Average hourly wage comes from Wages and salaries (all workers), Table 1 Employer Costs of Employee Compensation by ownership, Sep 2022: https://www.bls.gov/ecec/tables.htm. Income tax share of pretax income = (median household income – median post-tax income) ÷ median household income = ($70,784 - $65,354 ÷ $70,784) = 7.7%. Median household income and median post-tax income come from https://www.census.gov/data/tables/2022/demo/income-poverty/p60-276.html. Voluntary benefits as a percent of wages = voluntary benefits share of total compensation / wage share of total compensation = 0.239 ÷ 0.69 = 34.6%, which comes from https://www.bls.gov/news.release/ecec.t01.htm.
117 Travel cost per in-person ID verification = (travel cost per mile) x (miles of travel) = $0.983 x 12 miles = $11.79. For travel cost per mile, EPA uses the 2023 IRS standard mileage rate of $0.655 (based on a study of an individual’s fixed and variable costs of operating an automobile, see: https://www.irs.gov/newsroom/irs-issues-standard-mileage-rates-for-2023-business-use-increases-3-cents-per-mile ) inflated by 50% to $0.983 to account for other travel costs. EPA assumes 12 miles of travel, reflecting the maximum round-trip distance given that facilities must make information available only to residents and workers within six miles of the facility.
118 OMB Circular A-4, Regulatory Analysis. September 17, 2003.
119 Information on typical facility financing behavior obtained from communication with ICF engineers and limited data on refinery project finance investment from https://esfccompany.com/en/projects/oil-and-gas/refineries-lending-and-financing/
120 For affected facilities without accidents, EPA assumes 20% will have major updates to STAA in years 6-10 and 80% will simply revalidate. EPA assumes major updates will cost 50% of a full STAA review cost and revalidation will cost 10%. Some facilities may conduct a full STAA initial evaluation if a new or simple facility begins a complex process. Some facilities without accidents may conduct a full STAA practicability assessment in years 6-10 if a new or simple facility begins a complex process within a mile of a complex facility or if a complex facility is within one mile of a simple facility that begins a complex process. However, EPA does not estimate the frequency with which STAA will newly apply to a facility. Instead, EPA assumes the number of facilities conducting a full STAA in years 6-10 will equal the number of complex P3 facilities that had an accident between 2016 and 2020 but are not within 1 mile of another complex facility and does not have an HF unit.
121 EPA recognizes that subsequent to the final rule being finalized, accident rates may change.
122 The number of audits may be overstated because some facilities had multiple accidents in the same three-year period, resulting in only one third-party audit.
123 Practicability as defined in this final action means the capability of being successfully accomplished within a reasonable time, accounting for environmental, legal, social, technological and economic factors. Environmental factors would include consideration of potential transferred risks for new risk reduction measures.
124 Carroll, J.S., J.W. Rudolph, and S. Hatakenaka. “Lessons Learned from Non-Medical Industries: Root Cause Analysis as Culture Change at a Chemical Plant.” Qual Saf Health Care. 2002 Sep, 11(3) 266-9.
125 Percarpio, Katherine B., Vince B. Watts, and William B. Weeks. “The Effectiveness of Root Cause Analysis: What Does the Literature Tell Us?” The Joint Commission Journal on Quality and Patient Safety, 34(7). 2008, July. 391-8.
126 Percarpio, Katherine B., and Vince Watts. “A Cross-Sectional Study on the Relationship Between Utilization of
Root Cause Analysis and Patient Safety at 139 Department of Veterans Affairs Medical Centers.” The Joint Commission Journal on Quality and Patient Safety, 39(1). 2013. January. pp 32-7.
127 CSB, “Formosa Plastics Vinyl Chloride Explosion,” last modified Mar. 6, 2007, https://www.csb.gov/formosa-plastics-vinyl-chloride-explosion/ .
128 CSB, “BP America Refinery Explosion,” last modified Mar. 20, 2007, https://www.csb.gov/bp-america-refinery-explosion/ .
129 CSB, “Millard Refrigerated Services Ammonia Release,” last modified Jan. 15, 2015, https://www.csb.gov/millard-refrigerated-services-ammonia-release/ .
130 Duflo, Esther, Michael Greenstone, Rohini Pande, and Nicholas Ryan. “Truth-Telling by Third-Party Auditors and The Response of Polluting Firms: Experimental Evidence from India,” 128 Q. J. OF ECON. 4 at 1499-1545 (2013).
131 Kunreuther, Howard C., Patrick J. McNulty, and Yong Kang. “Third-Party Inspection as an Alternative to Command and Control Regulation.” Risk Analysis Vol 22, Issue 2, April 2002, pp 309-318.
132 Oberholzer-Gee, F. and M. Mitsunari. “Information Regulation: Do the Victims of Externalities Pay Attention?”
Journal of Regulatory Economics. 2006. 30: 141.
133 Mastromonaco, Ralph. “Do Environmental Right-to-Know Laws Affect Markets? Capitalization of Information in the Toxic Release inventory,” Journal of Environmental Economics and Management, 71. 2015. May. Pp 54-70. To support this statement, the author cites Hamilton (1995), Khanna et al. (1998), Bui (2005), Bui and Mayer (2003), Banzhaf and Walsh (2008) and Konar and Cohen (1997).
134 See footnote 43 for the full Mastromonaco (2015) citation.
135 EPA estimated the values of injuries and deaths that occurred in Pasadena using the same values applied to injuries and deaths at RMP facility-reported accidents. See Exhibit 3-15 in the accompanying RIA for specific values and Section 3.2.5.1 “Fatalities and Injuries” in the RIA for detailed explanations of how those values were estimated. The $1.8 billion in property damage was estimated by Marsh JLT Specialty, "100 Largest Losses in the Hydrocarbon Industry," 27th ed., March 2022. https://www.marsh.com/us/industries/energy-and-power/insights/100-largest-losses/100-largest-losses-report-download.html.
136 EPA instructions for RMP submissions specifically direct the owner or operator not to include any losses incurred as a result of business interruption. See page 74 of the RMP*eSubmit User’s Manual (EPA, August 2019); http://www.epa.gov/rmp/rmpesubmit-users-manual.
137 Marsh JLT Specialty, "100 Largest Losses in the Hydrocarbon Industry,” 27th Edition, March 2022. Accessed from https://www.marsh.com/uk/industries/energy-and-power/insights/100-largest-losses.html. Marsh provides estimates of large property damage losses in the hydrocarbon industry from 1974 to 2021 in current and 2021 dollars and in a few cases, business loss costs.
138 Marsh JLT Specialty, "The 100 Largest Losses 1974-2015: Large property damage losses in the hydrocarbon industry,” 24th Edition, March 2016. Accessed from https://www.marsh.com/uk/industries/energy-and-power/insights/100-largest-losses.html. Marsh provides estimates of large property damage losses in the hydrocarbon industry and in a few cases, business loss costs.
139 Marsh JLT Specialty, “The 100 Largest Losses 1972-2001: Large property damage losses in the hydrocarbon-chemical industries,” 20th Edition, February 2003. Accessed from https://enatech.jrc.ec.europa.eu/download/attachment/123.
140 RAND, Cost-Benefit Analysis of Proposed California Oil and Gas Refinery Regulations. https://www.rand.org/content/dam/rand/pubs/research_reports/RR1400/RR1421/RAND_RR1421.pdf .
141 http://www.nytimes.com/1989/10/25/us/reverberations-for-industries-but-not-for-us-households.html .
142 See Marsh (2022), March 25,1999 Richmond, CA explosion.
143 See Marsh (2022), Shell Norco explosion.
144 Guignet, Dennis, Robin R. Jenkins, James Belke, and Henry Mason. 2023b. The property value impacts of industrial chemical accidents. Journal of Environmental Economics and Management. 120 (2023) 102839.
145 Guignet, Dennis, Robin R. Jenkins, Christoph Nolte, and James Belke. 2023a. The External Costs of industrial Chemical Accidents: A Nationwide Property Value Study. Journal of Housing Economics. 62 (2023) 101954.
146For a review of papers that have estimated the impacts of hazardous industrial facilities on property values, see Grislain-Letrémy, C. and A. Katossky 2014. The impact of hazardous industrial facilities on housing prices: A comparison of parametric and semiparametric hedonic price models. Regional Science and Urban Economics 49: 93-107 for a review of the literature. (Their Appendix A.1 summarizes findings.)
147 Carroll, T.M., Clauretie, T.M., Jensen, J. and Waddoups, M. September 1996. The Economic Impact of a Transient Hazard on Property Values: The 1988 PEPCON Explosion in Henderson, Nevada. The Journal of Real Estate Finance and Economics, Volume 13, Issue 2, pp 143-167.
148 An important difference between a pipeline and a chemical facility is that pipelines may not be as noticeable. Pipeline accidents may increase awareness of baseline risks as well as change perceptions of post-accident risks.
149 Cheng, N., Li, M., Liu, P., Luo, Q., Tang, C., Zhang, W., 2022. Pipeline Incidents and Property Values: A Nationwide Hedonic Analysis. Social Science Research Network. May. Available at. https://papers.ssrn.com/sol3/papers.cfm?abstract_id=4116305.
150 Hansen, J. L., E. D. Benson and D. A. Hagen. 2006. Environmental Hazards and Residential Property Values: Evidence from a Major Pipeline Event. Land Economics 82(4): 529-541.
151 Average daily rate (ADR) of a hotel stay was $154.32 https://www.costar.com/article/78750475/str-us-hotel-rate-revenue-per-available-room-improve-in-september.
152 Bonanno, G. A., Brewin, C. R., Kaniasty, K., & Greca, A. M. L. (2010). Weighing the Costs of Disaster: Consequences, Risks, and Resilience in Individuals, Families, and Communities. Psychological Science in the Public Interest, 11(1), 1–49. https://doi.org/10.1177/1529100610387086 https://journals.sagepub.com/doi/10.1177/1529100610387086.
153 Carlson, D et al. Monetizing Bowser: A Contingent Valuation of the Statistical Value of Dog Life. (2019). Journal of Benefit-Cost Analysis, 11(1), 131-149. doi:10.1017/bca.2019.33 https://www.cambridge.org/core/journals/journal-of-benefit-cost-analysis/article/monetizing-bowser-a-contingent-valuation-of-the-statistical-value-of-dog-life/86EB120F86F7376DC366F6578C8CFEF1.
154 $650,000 per month in Flint, Michigan https://www.freep.com/story/news/local/michigan/flint-water-crisis/2018/04/06/flint-water-bottled-drinking/493954002/.
155 Jakus, Paul & Shaw, William & Nguyen, To & Walker, Mark. (2009). Risk Perceptions of Arsenic in Tap Water and Consumption of Bottled Water. Water Resources Research. 45. 10.1029/2008WR007427. https://agupubs.onlinelibrary.wiley.com/doi/full/10.1029/2008WR007427.
156 Bonanno, G. A., Brewin, C. R., Kaniasty, K., & Greca, A. M. L. (2010). Weighing the Costs of Disaster: Consequences, Risks, and Resilience in Individuals, Families, and Communities. Psychological Science in the Public Interest, 11(1), 1–49. https://doi.org/10.1177/1529100610387086 https://journals.sagepub.com/doi/10.1177/1529100610387086.
157 https://www.epa.gov/children/what-you-can-do-protect-children-environmental-risks
158 https://www.oecd.org/education/The-economic-impacts-of-coronavirus-covid-19-learning-losses.pdf.
159 Property value losses reflect and overlap with values of risks to human health, reduced ecosystem services, and negative impacts on aesthetic appeal experienced by nearby residents.
160 Guignet, Dennis, Robin R. Jenkins, Christoph Nolte, and James Belke. 2023b. The External Costs of industrial Chemical Accidents: A Nationwide Property Value Study. Journal of Housing Economics. 62 (2023) 101954.
161 Marsh JLT Specialty, "The 100 Largest Losses 1974-2015: Large property damage losses in the hydrocarbon industry,” 24th Edition, March 2016. Accessed from https://www.marsh.com/uk/industries/energy-and-power/insights/100-largest-losses.html. Marsh provides estimates of large property damage losses in the hydrocarbon industry and in a few cases, business loss costs.
162 See Chapter 3, Exhibit 3-16, for presentations of monetized damages for prior time periods. To obtain those estimates, EPA re-estimated unit damage costs for the prior time periods by applying the same set of assumptions used for the current final rule analysis and updating dollars to 2022. In particular, EPA re-estimated the costs assuming a fatality is valued at $10.4 million instead of $8.6 million (using the BEA GDP deflator), hospitalization costs of $45,000 instead of $36,000, and BLS mean hourly wage rates of $28.88 instead of $22.65. Previously, mean hourly wage was estimated as the cost per hour to shelter-in-place or evacuate. Relying on updated guidance, this final rule analysis uses mean hourly wage plus voluntary benefits less taxes, which is estimated at $36.66. For 2004 to 2013, estimated monetized damages from RMP facility accidents are $473.2 million (2022$) on average per year; for 2014 to 2016, estimated monetized damages are $441.7 million (2022$) on average per year. In total, over the 2004 to 2020 time period, the average per year is $482.8 and the average per accident is $3.4 million (2022$). EPA also updated accident data which can be continuously updated in RMP filings. This resulted in differences in the raw accident data between the December 31, 2020 RMP data used in this final rule and RMP data used in the amendments rule and reconsideration rule RIAs.
163 Marsh, The "100 Largest Losses in the Hydrocarbon Industry,” 27th Edition 2022. Accessed from https://www.marsh.com/uk/industries/energy-and-power/insights/100-largest-losses.html.
Marsh provides estimates of large property damage losses in the hydrocarbon industry from 1974 to 2021 in current and 2021 dollars and in a few cases, business loss costs.
164 Some small governments serve substantial populations associated with businesses, particularly irrigation districts that serve large farming areas but few residences, and small cities that have large tourist-related businesses.
165 See Chapter 2 of Final Guidance for EPA Rulewriters: Regulatory Flexibility Act, http://www.epa.gov/rfa/documents/Guidance-RegFlexAct.pdf .
167 SBA definitions of small businesses apply to a firm’s parent company and all affiliates as a single entity. Size standards effective March 17, 2023 https://www.sba.gov/document/support-table-size-standards
168 In some cases, NAICS codes are disaggregated to 5 digits and in others 6 digits. SBA does not include all 6-digit codes in its regulation.
169 5 U.S.C. 602.
170 NAICS codes are chosen by the entity which own the RMP facilities based on the largest source of revenue for the parent entity. The entity’s NAICS code is not necessarily the NAICS code associated with the RMP process in the facility.
171 U.S. Census Bureau, Census of Governments. https://www.census.gov/programs-surveys/gov-finances/data/historical-data.html.
172 Norton Virginia CNW Sewer Authority, https://www.nortonva.gov/72/CNW-Sewer-Authority. Accessed March 4, 2022.
173 U.S. Census Bureau 2020. QuickFacts: Eden city, North Carolina. Retrieved from https://www.census.gov/quickfacts/fact/table/edencitynorthcarolina/BZA210219.
174 City of Eden Financial Statements. June 30, 2020.
https://www.edennc.us/home/showpublishe%20ddocument/3781/637623947334730000
175 EPA (2022). Learn About Environmental Justice. https://www.epa.gov/environmentaljustice/learn-about-environmental-justice. Accessed February 10, 2022.
176 EPA (2016). Technical Guidance for Assessing Environmental Justice in Regulatory Analysis. https://www.epa.gov/sites/production/files/2016-06/documents/ejtg_5_6_16_v5.1.pdf.
177 EPA (2018). Guidance on Considering Environmental Justice During the Development of Regulatory Actions. https://www.epa.gov/sites/default/files/2015-06/documents/considering-ej-in-rulemaking-guide-final.pdf.
178 EPA (2016). Technical Guidance for Assessing Environmental Justice in Regulatory Analysis. https://www.epa.gov/sites/production/files/2016-06/documents/ejtg_5_6_16_v5.1.pdf.
179 Differential impacts on population groups of concern can only be identified in relation to a comparison group. A comparison group can be defined in multiple ways, for instance in terms of individuals with similar socioeconomic characteristics located at a broader geographic level or with different socioeconomic characteristics within an affected area. The goal is to select a comparison group that allows one to identify how the effects of the regulation vary by race, ethnicity, and income separate from other systematic differences across groups or geographic areas.
180 The facility universe is based on the RMP Database as of August 1, 2021. The facility universe differs slightly from the universe considered in other chapters as it includes only those facilities for which there were accurate coordinate locations. For this analysis, 49 facilities were removed from the facility universe because they did not have accurate coordinate locations.
181 For this analysis, low-income individuals are defined as individuals earning less than or equal to twice the federal poverty level.
182 Facilities provide information to households living up to six miles away, reflective of a worst-case chemical release scenario, but this analysis focused on communities most likely to be affected by the rulemaking.
183 To generate a consistent comparison group that was not inclusive of the communities likely to be affected by the rulemaking, EPA used the population outside of the one-mile buffers since it would be a relevant comparison population for both the one-mile and three-mile buffers.
184 RMP facilities have less than 1 to more than 27,000,000 times the regulatory threshold quantities of regulated chemicals.
185 Note that the large difference between the size of the affected population within one mile of RMP facilities versus the size of those within three miles is caused the fraction of urban areas that intersect with the buffers. While only portions of large cities intersect with one-mile buffers, most large cities are almost completely covered by the three-mile buffers. As such, the number of affected individuals increases drastically between the one to three-mile buffers.
186 The tail end of the distribution corresponds to fewer than five RMP facilities.
187 EPA could not calculate a chemical process quantity multiplier for ten RMP facilities that were then excluded from this analysis.
188 USGCRP. (2018). Impacts, Risks, and Adaptation in the United States: Fourth National Climate Assessment, Volume II [Reidmiller, D.R., C.W. Avery, D.R. Easterling, K.E. Kunkel, K.L.M. Lewis, T.K. Maycock, and B.C. Stewart (eds.)]. U.S. Global Change Research Program, Washington, DC, USA, 1515 pp. doi: 10.7930/NCA4.2018.
189 USGCRP. (2016): The Impacts of Climate Change on Human Health in the United States: A Scientific Assessment. Crimmins, A., J. Balbus, J.L. Gamble, C.B. Beard, J.E. Bell, D. Dodgen, R.J. Eisen, N. Fann, M.D. Hawkins, S.C. Herring, L. Jantarasami, D.M. Mills, S. Saha, M.C. Sarofim, J. Trtanj, and L. Ziska, Eds. U.S. Global Change Research Program, Washington, DC, 312 pp. http://dx.doi.org/10.7930/J0R49NQX.
190 Oppenheimer, M., M. Campos, R.Warren, J. Birkmann, G. Luber, B. O’Neill, and K. Takahashi. (2014). Emergent risks and key vulnerabilities. In: Climate Change 2014: Impacts, Adaptation, and Vulnerability. Part A: Global and Sectoral Aspects. Contribution of Working Group II to the Fifth Assessment Report of the Intergovernmental Panel on Climate Change [Field, C.B., V.R. Barros, D.J. Dokken, K.J. Mach, M.D. Mastrandrea, T.E. Bilir, M. Chatterjee, K.L. Ebi, Y.O. Estrada, R.C. Genova, B. Girma, E.S. Kissel, A.N. Levy, S. MacCracken, P.R. Mastrandrea, and L.L.White (eds.)]. Cambridge University Press, Cambridge, United Kingdom and New York, NY, USA, pp. 1039-1099.
191 Porter, J.R., L. Xie, A.J. Challinor, K. Cochrane, S.M. Howden, M.M. Iqbal, D.B. Lobell, and M.I. Travasso, (2014). Food security and food production systems. In: Climate Change 2014: Impacts, Adaptation, and Vulnerability. Part A: Global and Sectoral Aspects. Contribution of Working Group II to the Fifth Assessment Report of the Intergovernmental Panel on Climate Change [Field, C.B., V.R. Barros, D.J. Dokken, K.J. Mach, M.D. Mastrandrea, T.E. Bilir, M. Chatterjee, K.L. Ebi, Y.O. Estrada, R.C. Genova, B. Girma, E.S. Kissel, A.N. Levy, S. MacCracken, P.R. Mastrandrea, and L.L.White (eds.)]. Cambridge University Press, Cambridge, United Kingdom and New York, NY, USA, pp. 485-533.
192 Smith, K.R., A.Woodward, D. Campbell-Lendrum, D.D. Chadee, Y. Honda, Q. Liu, J.M. Olwoch, B. Revich, and R. Sauerborn (2014). Human health: impacts, adaptation, and co-benefits. In: Climate Change 2014: Impacts, Adaptation, and Vulnerability. Part A: Global and Sectoral Aspects. Contribution of Working Group II to the Fifth Assessment Report of the Intergovernmental Panel on Climate Change [Field, C.B., V.R. Barros, D.J. Dokken, K.J. Mach, M.D. Mastrandrea, T.E. Bilir, M. Chatterjee, K.L. Ebi, Y.O. Estrada, R.C. Genova, B. Girma, E.S. Kissel,A.N. Levy, S. MacCracken, P.R. Mastrandrea, and L.L.White (eds.)]. Cambridge University Press, Cambridge, United Kingdom and New York, NY, USA, pp. 709-754.
193 IPCC. (2018). Global Warming of 1.5°C. An IPCC Special Report on the impacts of global warming of 1.5°C above pre-industrial levels and related global greenhouse gas emission pathways, in the context of strengthening the global response to the threat of climate change, sustainable development, and efforts to eradicate poverty [Masson-Delmotte, V., P. Zhai, H.-O. Pörtner, D. Roberts, J. Skea, P.R. Shukla, A. Pirani, W. Moufouma-Okia, C. Péan, R. Pidcock, S. Connors, J.B.R. Matthews, Y. Chen, X. Zhou, M.I. Gomis, E. Lonnoy, T. Maycock, M. Tignor, and T. Waterfield (eds.)]. In Press.
194 National Research Council. (2011). America's Climate Choices. Washington, DC: The National Academies Press. https://doi.org/10.17226/12781.
195 National Academies of Sciences, Engineering, and Medicine. (2017). Communities in Action: Pathways to Health Equity. Washington, DC: The National Academies Press. https://doi.org/10.17226/24624.
196 EPA. (2021). Climate Change and Social Vulnerability in the United States: A Focus on Six Impacts.
U.S. Environmental Protection Agency, EPA 430-R-21-003. www.epa.gov/cira/social-vulnerability-report.
197 For the purposes of defining “maximum annual cost to government entities” the $18.9 million reflects if all government entities were to face costs in the same year which is very conservative.
198 Zivin Joshua Graff and Neidell Matthew. “Air Pollution’s Hidden Impacts.” Science 359, no. 6371 (January 5, 2018): 39–40. https://doi.org/10.1126/science.aap7711.
199 Berman, Eli, and Linda Bui. “Environmental Regulation And Productivity: Evidence From Oil Refineries.” The Review of Economics and Statistics 83, no. 3 (2001): 498–510.
200 Only data for the years 2018 through 2020 were collected from the ASM.
201 This figure was derived using 2017 Economic Census data, in which the revenue across all sectors amounted to $37.0 trillion. When divided by 124.6 million employees in 2017, the labor productivity per employee equals $296,550. Adjusting for inflation to 2022 dollars increases the labor productivity to $315,687 per employee.
202 E.O. 13211 was issued May 18, 2002. The OMB later released an Implementation Guidance memorandum on July 13, 2002.
203 EPA located two additional estimates of Solid Acid alkylation projects estimated as costing $25m and $23m but given that this technology is relatively new, EPA limited the representation of it to a single conservative data point – the $50m estimate included in the table. For a description of the two additional estimates see Zhang, S., L. Wilkinson, L. Ogunde, R. Todd, C. Steves, and S Haydel. 2016. Norton Engineering: Alkylation Technology Study: Final Report. South Coast Air Quality Management District (SCAQMD). September 9. https://www.aqmd.gov/docs/default-source/permitting/alkylation-technology-study-final-report.pdf
204 Hamby, Chris. 2011. “New oil refinery in South Dakota says it will use alternative to toxic acid.” The Center for Public Integrity. March 28. Citing James Nehlsen, a process development manager at Exelus, Inc. Available at: https://publicintegrity.org/inequality-poverty-opportunity/workers-rights/worker-health-and-safety/fueling-fears/new-oil-refinery-in-south-dakota-says-it-will-use-alternative-to-toxic-acid/ .
205 Oil and Gas Journal, “Chevron’s Salt Lake City refinery plans alkylation unit revamp.” Oct 4, 2016. Available at: https://www.ogj.com/refining-processing/article/17250762/chevrons-salt-lake-city-refinery-plans-alkylation-unit-revamp; Oil and Gas Journal, “Chevron’s Utah refinery lets contract for alkylation technology retrofit.” Feb 8, 2017. Available at: https://www.ogj.com/refining-processing/article/17290342/chevrons-utah-refinery-lets-contract-for-alkylation-technology-retrofit
206 Letter from Torrance Refining Company, Torrance, CA to Bruce Moe, City Manager, Manhattan Beach CA, dated March 16, 2018. Burns/McDonnell, PBF Energy, Report Brief: Alkylation Study & Estimate, Torrance Refinery, Project No. 98037. July 2017, see Tab 1. Available at: https://torrancerefinery.com/wp-content/uploads/2018/03/TORC-Comment-Letter-with-Attachments-Agenda-Item-No.-K.11.pdf; South Coast AQMD, Governing Board Meeting, “Status Update on PR 1410 – Hydrogen Fluoride Storage and Use at Petroleum Refineries.” Diamond Bar, CA February 1, 2019. Available at: http://www.aqmd.gov/docs/default-source/Agendas/Governing-Board/2019/2019-feb1-025.pdf?sfvrsn=6; Buhl, Larry. “Activists and Oil Refiners Square Off Over Hydrofluoric Acid,” Undark. October 10, 2018. Available at: https://undark.org/2018/10/10/hydrofluoric-acid-oil-refining-explosion/.
207 See public comment on 2015 proposed RMP amendments rule EPA-HQ-OEM-2015-0725-0579, pp 142. Comment submitted by AFPM.
208 Communities for a Better Environment citing (https://www.cbecal.org/wp-content/uploads/2019/02/CBE-fact-sheet-MHF-replacement-COST-greatly-exagerated-01312019.pdf): US Delek Holdings to add alkylation unit at Louisiana refinery, Independent Commodity Intelligence Services (ICIS) News, 2018/01/16, from refinery SEC filing: https://www.icis.com/explore/resources/news/2018/01/16/10183692/us-delek-holdings-to-add-alkylation-unit-at-louisiana-refinery/ .
209 Communities for a Better Environment citing (https://www.cbecal.org/wp-content/uploads/2019/02/CBE-fact-sheet-MHF-replacement-COST-greatly-exagerated-01312019.pdf): Valero Energy Reports First Quarter 2016 Results, 13,000 bpd unit, GlobeNewsWire, 05/03/2016. Available at: https://www.globenewswire.com/news-release/2016/05/03/835929/0/en/Valero-Energy-Reports-First-Quarter-2016-Results.html .
210 Communities for a Better Environment citing (https://www.cbecal.org/wp-content/uploads/2019/02/CBE-fact-sheet-MHF-replacement-COST-greatly-exagerated-01312019.pdf): Valero Energy Reports First Quarter 2016 Results, 13,000 bpd unit, GlobeNewsWire, 05/03/2016. Available at: https://www.globenewswire.com/new s-release/2016/05/03/835929/0/en/Valero-Energy-Reports-First-Quarter-2016-Results.html .
211 Zhang, S.; L. Wilkinson; L. Ogunde; R. Todd; C. Steves; S. Haydel. Norton Engineering: Alkylation Technology Study: FINAL REPORT. South Coast Air Quality Management District, 09/09/2016. Available at: https://www.aqmd.gov/docs/default-source/permitting/alkylation-technology-study-final-report.pdf.
212 Zhang, S.; L. Wilkinson; L. Ogunde; R. Todd; C. Steves; S. Haydel. Norton Engineering: Alkylation Technology Study: FINAL REPORT. South Coast Air Quality Management District, 09/09/2016. Available at: https://www.aqmd.gov/docs/default-source/permitting/alkylation-technology-study-final-report.pdf.
213 SBA definitions of small businesses apply to a firm’s parent company and all affiliates as a single entity.

| File Type | application/vnd.openxmlformats-officedocument.wordprocessingml.document |
| Author | Wendy Hoffman |
| File Modified | 0000-00-00 |
| File Created | 2024-07-26 |
© 2026 OMB.report | Privacy Policy