Supporting_Statement_Part B_Final_20240618
Supporting_Statement_Part B_Final_20240618.docx
Survey of Occupational Injuries and Illnesses
OMB: 1220-0045
Survey of Occupational Injuries and Illnesses
OMB Control Number: 1220-0045
OMB Expiration Date: 10/31/2024
SUPPORTING STATEMENT FOR
SURVEY OF OCCUPATIONAL INJURIES AND ILLNESSES
OMB CONTROL NO. 1220-0045
COLLECTIONS OF INFORMATION EMPLOYING STATISTICAL METHODS
The statistical methods used in the sample design of the survey are described in this section. The documents listed below are attached or available at the hyperlink provided. These documents are either referenced in this section or provide additional information.
Overview of the Survey of Occupational Injuries and Illnesses Sample Design and Estimation Methodology – Presented at the 2008 Joint Statistical Meetings (10/27/08) – https://www.bls.gov/osmr/research-papers/2008/pdf/st080120.pdf
Deriving Inputs for the Allocation of State Samples (05/01/2013)
The growth in cases with Restricted Activity or Job Transfer (08/2011)
Summary Variance and Relative Standard Errors (RSE) (08/24/2023)
Calculate CD Variance and Relative Standard Errors (RSE) (07/13/2023)
BLS Handbook of Methods – Survey of Occupational Injuries and Illnesses (10/30/2020) – https://www.bls.gov/opub/hom/soii/home.htm
Nonresponse Bias in the Survey of Occupational Injuries and Illnesses (10/2013) https://www.bls.gov/osmr/research-papers/2013/pdf/st130170.pdf
Sample Allocation to Increase the Expected Number of Publishable Cells in the Survey of Occupational Injuries and Illnesses (10/2015) – https://www.bls.gov/osmr/research-papers/2015/pdf/st150070.pdf
Deep neural networks for worker injury autocoding (09/2017) – https://www.bls.gov/iif/automated-coding/deep-neural-networks.pdf
1. Describe (including a numerical estimate) the potential respondent universe and any sampling or other respondent selection methods to be used. Data on the number of entities (e.g., establishments, State and local government units, households, or persons) in the universe covered by the collection and in the corresponding sample are to be provided in tabular form for the universe as a whole and for each of the strata in the proposed sample. Indicate expected response rates for the collection as a whole. If the collection had been conducted previously, include the actual response rate achieved during the last collection.
Description of universe and sample
Universe. The main source for the SOII sampling frame is the BLS Quarterly Census of Employment and Wages (QCEW) (BLS Handbook of Methods, Quarterly Census of Employment and Wages from https://www.bls.gov/cew/). The QCEW is a near quarterly census of employers collecting employment and wages by ownership, county, and six-digit North American Industry Classification System (NAICS) code. States have an option to either use the QCEW or supply public sector sampling frames for state and local government units. Business census files are utilized to create a sampling frame for Guam, whose establishment data are not available in QCEW. The number of states providing their own public sector frame are provided in Table 1:
Table 1: Number of states providing frames by ownership type
Year |
State Frame |
Local Frame |
Private Frame |
2023 |
6 |
4 |
1 |
2024 |
6 |
4 |
1 |
2025 |
7 |
4 |
1 |
The potential number of respondents (establishments) covered by the scope of the survey is approximately 9.2 million, although only about 1.4 million employers keep required injury and illnesses records on a routine basis due to recordkeeping exemptions defined by OSHA for employers in low hazard industries and employers with fewer than 11 employees. The occupational injury and illness data reported through the annual survey are based on records that employers in the following North American Industry Classification System (NAICS) industries maintain under the Occupational Safety and Health Act:
Table 2: NAICS Industry Sectors Covered by SOII
Sector |
Description |
11 |
Agriculture, forestry, fishing and hunting |
21 |
Mining, quarrying, and oil and gas extraction |
22 |
Utilities |
23 |
Construction |
31, 32, 33 |
Manufacturing |
42 |
Wholesale trade |
44,45 |
Retail trade |
48,49 |
Transportation and warehousing |
51 |
Information |
52 |
Finance and insurance |
53 |
Real estate and rental and leasing |
54 |
Professional, scientific, and technical services |
55 |
Management of companies and enterprises |
56 |
Administrative and support and waste management and remediation services |
61 |
Educational services |
62 |
Health care and social assistance |
71 |
Arts, entertainment, and recreation |
72 |
Accommodation and food services |
81 |
Other services (except public administration) |
92 |
Public Administration |
Excluded from the national survey collection are:
Self-employed individuals;
Farms with fewer than 11 employees (Sector 11);
Employers regulated by other Federal safety and health laws;
United States Postal Service and;
Federal government agencies.
Mining and railroad industries are not covered as part of the sampling process. Injury and illness data from these industries are obtained directly from the Mine Safety and Health Administration and the Federal Railroad Administration, respectively, and used to produce state and national estimates.
Data collected for reference year 2008 and published in calendar year 2009 marked the first time state and local government agency data were collected and published for all participating states and for the nation as a whole. The SOII is a federal/state cooperative program, in which the federal government and participating states share the costs of participating in state data collection activities. State participation in the survey may vary by year. Sample sizes are determined by the participating states based on budget constraints and independent samples are selected for each state annually. Data are collected by BLS regional offices for non-participating states.
For the 2024 survey, 42 states plus the District of Columbia plan to participate in the survey. For the remaining eight states which are referred to as Non-State Grantees (NSG), a smaller sample is selected and collected by BLS regional offices to provide data which contribute to national estimates only. The eight NSG states for 2024 are:
Table 3: Non-State Grantees for the SOII, 2024
Florida |
Idaho |
Mississippi |
New Hampshire |
North Dakota |
Rhode Island |
South Dakota |
Georgia |
Additionally, estimates are tabulated for three U.S. territories – Guam, Puerto Rico, and the Virgin Islands – but data from these territories are excluded from the tabulation of national estimates.
Sample. The SOII utilizes a stratified probability sample design with strata defined by state, ownership, industry, and size class. The first characteristic enables all the state grantees participating in the survey to produce state-level estimates. Ownership is defined into three categories: State government, local government, and private industry. There are varying degrees of industry stratification levels within each state. This is desirable because some industries are more prevalent in some states compared to others. Also, some industries can be relatively small in employment but have high injury and illness rates which make them likely to be designated for estimation. Thus, states determine which industries are most important in terms of publication and the extent of industry stratification is set independently within each state. BLS sets some minimal levels of desired industry publication to ensure sufficient coverage for national estimates. These industry classifications are defined using the North American Industry Classification System (NAICS, https://www.census.gov/naics/) and are referred to as Target Estimation Industries (TEI).
Finally, establishments are classified into five size classes based on average annual employment and defined as follows:
Table 4: Establishment Size Classes for SOII
Size Class |
Average Annual Employment |
1 |
10 or fewer |
2 |
11-49 |
3 |
50-249 |
4 |
250-999 |
5 |
1,000 or greater |
After each establishment is assigned to its respective stratum, a systematic selection with equal probability is used to select a sample from each sampling cell (stratum). As mentioned earlier, a sampling cell is defined as state/ownership/TEI/size class. Prior to sample selection, units are sorted by employment within each stratum. This sorting ensures that the sampled establishments have varying numbers of employees. Full details of the survey design are provided in Section 2.
For survey year 2024, the sample size will be approximately 228,200 (2.26) percent of the total 10.1 million establishments in state, local, and private ownerships.
Response rate. The survey is mandatory, except for state and local government units in the following states:
Table 5: Mandatory Exceptions
Alabama |
Arkansas |
Colorado |
Delaware |
District of Columbia |
Florida |
Georgia |
Idaho |
Illinois |
Kansas |
Louisiana |
Mississippi |
Missouri |
Nebraska |
New Hampshire |
North Dakota |
Pennsylvania |
Rhode Island |
South Dakota |
Texas |
Each year, establishments in the SOII are notified via mail or email of their requirement to participate. All nonrespondents are sent up to two nonresponse mailings as a follow-up to the initial mailing. Some states choose to send a third or fourth nonresponse mailing to nonrespondents late in the collection period. For survey year 2023, approximately two-thirds of the states will send an optional third nonresponse mailing to most of the nonrespondents at that point in time, and fewer than five percent of the states will send a fourth nonresponse mailing. In addition, states may contact respondents via telephone for additional nonresponse follow-up. A form which respondents can complete to fax their survey responses is included with the second nonresponse mailing as an additional response option. States may also use email follow-up for some respondents who have expressed a preference for communication via email. No systematic establishment level data on the number of telephone or email nonresponse follow-up contacts is captured.
As mentioned earlier, public sector establishments were included in the 2008 survey for all states, including those from which no public sector data had been collected in the past. In these states, public sector establishments have no mandate to provide data to the SOII; their participation is voluntary. Starting with survey year 2008, the rates for both state and local government decreased, primarily due to the addition of the voluntary state and local government establishments.
In 2010, an in-depth response rate analysis was undertaken. Aggregate response rates in the SOII were shown to be above 90 percent due to the mandatory nature of the survey and the excellent efforts to obtain survey data by BLS state and regional partners. However, it was also shown that states with voluntary reporting status for the state and local governments had low response rates for the government units. In subsequent years, this study was updated to continually monitor the item and establishment nonresponse. SOII response rates are relatively high and have decreased slightly over the years. The SOII response rate declined for 2019 due to the Covid-19 pandemic. The response rate has risen for more recent collections but has not yet returned to pre-pandemic levels.
The chart below illustrates the establishment level response rates from 2005-2022:
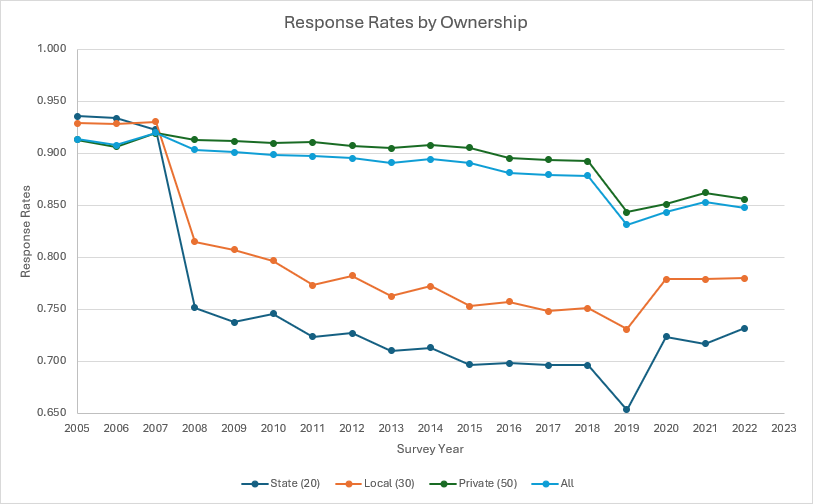
Although response rates for the SOII program have historically been high, the expansion of public sector collection in voluntary states resulted in a response rate of 75 percent in state government in 2008. Per OMB statistical guidelines, a nonresponse bias study was initiated and completed in 2013 (See “Nonresponse Bias in the Survey of Occupational Injuries and Illnesses” in the supporting documents). This work concluded that, in states where participation is voluntary, there is statistically significant evidence to suggest that counts for establishments identified by a model as being ‘likely’ to respond are lower than establishments that were identified as ‘unlikely’ to respond. Similarly, the mean case rates for establishments identified by a model as being ‘likely’ to respond were higher than those identified as being ‘unlikely’ to respond. This apparent contradiction between the biases in the measures was explained by the changes in the estimates of the hours worked that are included in the rate estimate. Given these voluntary state/local units comprised 1.3 percent of the total survey, efforts to address these observed biases were deferred due to resource constraints.
Additional response efforts will be considered as time and resources allow to analyze response rates for several key data elements collected for each establishment in the survey. Data elements for NAICS (industry), SOC (Standard Occupational Classification), source, nature, part, and event for each case with days away from work, job transfer or restriction are coded by BLS regional staff and/or state partners. As such, these fields are always available for collected data. Other data elements such as race or ethnicity, whether the event occurred before/during/after the work shift, the time of the event, and the time the employee began work are optionally reported and may be missing from collected data. BLS may consider future response analysis efforts for these other data elements to identify specific response rates and the characteristics of respondents versus nonrespondents for these variables.
Regional offices are also working with states on collection practices to improve response for voluntary units.
BLS will continue to monitor response rates for all segments of the survey scope and will conduct further analysis as needed to make recommendations for improvements to data collection process. BLS will conduct a nonresponse bias analysis for groups of establishments with response rates below 80 percent and investigate potential nonresponse bias issues for any specific data elements with item response rates below 70 percent.
2. Describe the procedures for the collection of information including:
Statistical methodology for stratification and sample selection,
Estimation procedure,
Degree of accuracy needed for the purpose described in the justification,
Unusual problems requiring specialized sampling procedures, and
Any use of periodic (less frequent than annual) data collection cycles to reduce burden.
Survey
design.
The survey is based on probability survey design theory and
methodology at both the national and state levels. This methodology
provides a statistical foundation for drawing inference to the full
universe being studied.
Research was done to determine what measure of size was most appropriate for the allocation module. Discussion with the Occupational Safety and Health Statistics (OSHS) Management Team narrowed the choices to the rates for Total Recordable Cases (TRC); Cases with Days Away from Work (DAFW); and Cases with Days Away from Work, Job Transfer, or Restriction (DART).
Rates from the 2003 SOII were studied for all 1,251 TEIs for each of the above case categories. The average case rate, standard deviation (SD), and coefficient of variation (CV) for each set of rates were calculated. The CV is the standard deviation divided by the estimate, which is commonly used to compare estimates in relative terms. The results are shown below:
Description Ave. Rate SD CV
DAFW 1.5540 1.078 0.69
DART 3.0479 2.000 0.66
TRC 5.5300 3.229 0.58
Based on this information it was recommended that the TRC rate be used as the measure of size for the sample allocation process for the survey. The lower CV indicates that it is the most stable indicator.
Additionally, to fulfill the needs of users of the survey statistics, the sample provides industry estimates. A list of the industries for which estimates are required is compiled by the BLS after consultation with the principal Federal users. The sample is currently designed to generate national data for all targeted NAICS levels that meet publication standards.
Allocation procedure. The principal feature of the survey’s probability sample design is its use of stratified random sampling with Neyman allocation. The characteristics used to stratify the units are state, ownership (whether private, state, or local government), industry code, and employment size class. Since these characteristics are highly correlated with the characteristics that the survey measures, stratified sampling provides a gain in precision and thus results in a smaller sample size.
Using Neyman allocation, optimal sample sizes are determined for each stratum within each state. Historical case data are applied to compute sampling errors used in the allocation process. Details about this process can be found in Deriving Inputs for the Allocation of State Samples (05/01/2013).
The
first simplifying assumption for allocation is that for each TEI
size class stratum h,
the employment in each establishment is the same, which is denoted by
 .
BLS also ignores weighting adjustments. In addition, BLS assumes that
the sampling of establishments in each stratum is simple random
sample with replacement (It is actually without replacement, but this
is a common assumption to simplify the formulas).
.
BLS also ignores weighting adjustments. In addition, BLS assumes that
the sampling of establishments in each stratum is simple random
sample with replacement (It is actually without replacement, but this
is a common assumption to simplify the formulas).
One consequence of these assumptions is that the estimate of the overall employment is constant and as a result the estimated incidence rate of recordable cases in the universe is the estimated number of recordable cases divided by this constant. Therefore, the optimal allocation for the total number of recordable cases and the incidence rate of recordable cases are the same. BLS will only consider the optimal allocation for the total number of recordable cases.
BLS introduces the following notation. For sampling stratum h let:
 denote
the number of frame units
denote
the number of frame units
 denote
the number of sample units
denote
the number of sample units
 denote
the sample weight
denote
the sample weight
 denote
the total employment in stratum h
denote
the total employment in stratum h
 denote
the incident rate for total recordable cases
denote
the incident rate for total recordable cases
 denote
the unweighted sample number of recordable cases
denote
the unweighted sample number of recordable cases
Also let:
 denote
the estimated number of recordable cases in the entire universe.
denote
the estimated number of recordable cases in the entire universe.
Then
 (1)
(1)
 (2)
(2)
where V denotes variance.
Now
BLS will obtain
 under two different assumptions. Assumption (a) is:
(a)
All employees in stratum h
have either 0 or 1 recordable cases and the probability that an
employee has a recordable case is
.
In
this case
can be considered to have a binomial distribution with
 trials and
is the probability of success in each trial and consequently
trials and
is the probability of success in each trial and consequently
 (3)
(3)
Assumption (b) is:
(b)
The total recordable case rate for the
sample establishments in stratum h
has a binomial distribution with
trials and
is the probability of success in each trial. In that case
 (4)
(4)
Although
BLS will derive the optimal allocations under both assumptions, BLS
prefers assumption (b) since under assumption (a) the variance of the
recordable case rate among establishments in stratum h
will be unrealistically small, particularly for strata with large
.
To derive the optimal allocation under assumption (a) we substitute (3) into (2) obtaining
 (5)
(5)
Regarding
(5) as a function of the variables
and minimizing (5) with respect to these variables by means of the
method of Lagrange multipliers from advanced calculus, BLS obtains
that (5) is minimized when the
are proportional to
 (6)
(6)
As for the preferred assumption (b), to derive the optimal allocation, BLS similarly substitutes (4) into (2) obtaining
 (7)
(7)
Minimizing
(7) as BLS minimized (5), BLS obtains that (7) is minimized when the
are proportional to
 (8)
(8)
which is the preferred allocation.
Sample procedure. Once the sample is allocated, the process of selecting the specific units is done by applying a systematic selection with equal probability independently within each sampling cell. Because the frame is stratified by employment size within each TEI before sample selection, no additional value would be gained by selecting the sample by PPS (probability proportional to size).
The survey is conducted by mail and email questionnaire through the BLS-Washington and regional offices and participating state statistical grant agencies. Survey participants can respond to the survey via the Internet, by phone, by fax, or by mail via a paper questionnaire. SOII respondents have been asked to provide a preferred method for notification of participation in future surveys. Starting with survey year 2016, employers who have expressed a preference of email notifications have been notified both of their requirement to maintain injury and illness records for the upcoming reference year and for notifying participants of their responsibility to report their data during collection. These email notifications are done in accordance with BLS policy on the use of email for data collection.
Estimation procedure. The survey's estimates of the number of injuries and illnesses for the population are based on the Horvitz-Thompson estimator, which is an unbiased estimator. The estimates of the incidence of injuries or illnesses per 100 full-time
workers are computed using a ratio estimator. The estimates of the incidence rates are calculated as
where:
C = number of injuries and illnesses
 =
total hours worked by all employees during a calendar year
=
total hours worked by all employees during a calendar year
200,000 = base for 100 full-time equivalent workers (working 40 hours per week, 50 weeks per year).
The estimation system has several major components that are used to generate summary estimates. The first four components generate factors that are applied to each unit’s original weight to determine a final weight for the unit. These factors were developed to handle various data collection issues. The original weight that each unit is assigned at the time the sample is drawn is multiplied by each of the factors calculated by the estimation system to obtain the final weight for each establishment. The following is a synopsis of these four components.
When a unit cannot be collected as assigned, it is assigned a Reaggregation factor. For example, if XYZ Company exists on the sample with 1,000 employees but the respondent reports for only one of two locations with 500 employees each, it is treated as a reaggregation situation. The Reaggregation factor is equal to the target (or sampled) employment for the establishment divided by the reported employment for collected establishments. It is calculated for each individual establishment.
In cases where a sampled unit is within scope of the survey but does not provide data, it is treated as a nonrespondent. Units within scope are considered viable units. This would include collected units as well as nonrespondents. The Nonresponse adjustment factor is the sum of the weighted viable employment within the sampling stratum divided by the sum of the weighted usable employment for an entire sampling stratum. The nonresponse adjustment factor is applied to each unit in a stratum.
In some cases, collected data is so extreme that it stands apart from the rest of the observations. For example, suppose in a dental office (which is historically a low incidence industry for injuries and illnesses), poisonous gas gets in the ventilation system which causes several employees to miss work for several days. This is a highly unusual circumstance for that industry. This situation would be deemed an outlier for estimation purposes and handled with the outlier adjustment. If any outliers are identified and approved by the national office, the system calculates an Outlier adjustment factor so that the outlier represents only itself. In addition, the system calculates outlier adjustment factors for all other
non-outlier units in the sampling stratum. This ensures that the re-assigned weight is distributed equally amongst all units in the strata.
Benchmarking is done to account for the time lapse between the sampling frame used for selecting the sample and the latest available frame information. Thus, a factor is computed by dividing the target employment (latest available employment) for the sampling frame by the weighted reported employment for collected units.
The system calculates the final weight for each unit. The final weight is a product of the original weight and all four of the factors. All estimates are the sum of the weighted (final weight) characteristic of all the units in a stratum.
In 2010 a pilot study to measure rates of cases with Days of Job Transfer or Restriction (DJTR) for selected industries was begun using data from the 2011 survey reference year. The first public release of the case and circumstances data for DJTR cases from this pilot occurred on April 25, 2013. The study concluded in 2019 and BLS incorporated biennial DJTR estimates into its SOII production cycle and released the first nationally-representative and state-level biennial case and demographic estimates in November 2023 covering the 2021-22 reference years. See the Days of Job Transfer or Restriction testing section below for details.
3. Describe methods to maximize response rates and to deal with issues of non-response. The accuracy and reliability of information collected must be shown to be adequate for intended uses. For collections based on sampling, a special justification must be provided for any collection that will not yield "reliable" data that can be generalized to the universe studied.
Survey sampling errors. The survey utilizes a full probability survey design that makes it possible to determine the reliability of the survey estimates. Standard errors are produced for all injury and illness counts and case and demographic data as well as for all data directly collected by the survey.
The variance estimation procedures are described in detail in the attached documents mentioned earlier:
Summary Variance and Relative Standard Errors (RSE) (08/24/2023)
Calculate CD Variance and Relative Standard Errors (RSE) (07/13/2023)
4. Describe any tests of procedures or methods to be undertaken. Testing is encouraged as an effective means of refining collections of information to minimize burden and improve utility. Tests must be approved if they call for answers to identical questions from 10 or more respondents. A proposed test or set of tests may be submitted for approval separately or in combination with the main collection of information.
The survey was first undertaken in 1972 with a sample size of approximately 650,000. Since then, the BLS has made significant progress toward reducing respondent burden by employing various statistical survey design techniques; the present sample size is approximately 228,200. The BLS is continually researching methods that will reduce the respondent burden without jeopardizing the reliability of the estimates.
Data Quality Research. BLS is conducting ongoing research into the completeness of the injury and illness counts from the Survey of Occupational Injuries and Illnesses (SOII). The purpose of this research is to better understand the undercount of occupational injuries and illnesses reported by the SOII and to investigate possible reasons behind it. BLS uses results from this research to actively address SOII data quality issues that are identified. Several articles and papers describing this research and actions taken are available at https://www.bls.gov/iif/data-quality-research/data-quality.htm.
BLS continues to evaluate the results of the data quality research that has been completed, as well as to pursue further research. These efforts include evaluating reporting practices employed by establishments and testing the feasibility of collection of injury and illness data directly from workers.
Employer reporting practices were investigated by conducting a follow-back study of a subsample of respondents to the 2013 SOII. The results of this study are available at https://www.bls.gov/iif/data-quality-research/westat-soii-national-recontact-survey-final-report.pdf. Additionally, a separate employer study was conducted to estimate the prevalence of compliant and noncompliant recordkeeping practices in four states. The results of this study are available at https://www.bls.gov/iif/data-quality-research/four-state-data-report.pdf.
BLS has continued to evaluate the feasibility of collecting injury and illness data directly from workers. BLS conducted a pilot test of a worker survey in 2017-2018, the results of which are available at https://www.bls.gov/opub/mlr/2020/article/the-survey-of-occupational-injuries-and-illnesses-respondent-follow-up-survey.htm.
In 2023, BLS continued investigating the feasibility of collecting data from workers as a potential complementary measure to employer-reported work-related injuries and illnesses. A pilot study was conducted to qualitatively investigate the collection of self-coded injury and illness data from workers as an early step toward a larger series of research studies on the development of household data collection methods. BLS is currently evaluating the results of this pilot study to determine next steps.
Computer-Assisted Coding. BLS is constantly researching ways to minimize the impact of human error in data collection. Because much of the occupational data are provided in narrative form, BLS and its state partners traditionally had to manually translate these narratives into codes. While BLS has incrementally developed rules for identifying human coding errors, inconsistency remained a concern. In 2012, BLS began researching the concept of using computer learning algorithms to “autocode” free-form written case narratives from survey respondents. Initial results proved promising and indicated that computer-assisted coding was feasible.
BLS began with the 2014 survey to automatically assign select occupation codes and found that it could successfully assign occupation codes automatically to about one-quarter of 2014 SOII cases. Autocoding was expanded incrementally over several years to include all six primary coding tasks (occupation, nature, part, source, secondary source, and event) with the model assigning approximately 85 percent of these codes in 2019. (https://www.bls.gov/iif/automated-coding/deep-neural-networks.pdf).
Starting with survey year 2020, BLS implemented state-of-the-art machine learning algorithms known as transformers or a large-language model to process SOII cases with increased accuracy and precision across all six primary coding tasks. The Autocoder coded approximately 92 percent of all codes for survey years 2021 and 2022, respectively (https://www.bls.gov/iif/automated-coding.htm).
For the ongoing collection of the 2023 SOII, the Autocoder has averaged coding 83 percent of all codes, following anticipated temporary declines in performance due to added noise from reduced training data with the transition to the new Occupational Injury and Illness Classification System (OIICS) version 3 coding taxonomy. Autocoder performance is expected to return to previous levels over the coming years as new training data are added from ongoing collection and coding.
BLS uses research output as part of the annual review of the codes state coders have assigned to occupation and case circumstances for more than a quarter million nonfatal injuries and illnesses. BLS will continue to develop and evaluate computer-assisted coding with the twin goals of improving consistency and freeing personnel for more complex assignments where staff expertise is critically needed.
Days of Job Transfer or Restriction Testing. BLS conducted a series of pilot tests over survey years 2011-19 to test the collection of case and demographic data for injury and illness cases that required only days of job transfer or restriction (DJTR). The purpose of this pilot study was to evaluate feasibility to collect these cases and to learn more about occupational injuries and illnesses that resulted in days of job transfer or work restriction. The results of the first three years of collection were successful and demonstrated that these data could be collected and processed accurately for a limited set of industries. Results from the DJTR study are available at https://www.bls.gov/iif/nonfatal-injuries-and-illnesses-tables/soii-case-and-demographic-characteristics-historical-data/days-of-job-transfer-or-restriction.htm.
DJTR details were collected from a second set of industries covering the 2014-2016 SOII, results from which are available at https://www.bls.gov/opub/reports/job-transfer-or-work-restriction/2016/home.htm. Data for a third set of industries were collected from the 2017-2019 SOII. Results from these pilot studies confirmed that collection of details for DJTR cases was feasible and that these details provided important information that were otherwise unavailable to help inform research and policy decisions impacting the safety and health of America’s workers.
BLS regards the collection of DJTR cases as a significant addition to its coverage of the American workforce. The DJTR Simulation Team was formed to determine how best to implement the collection of these data along with days away from work cases in future survey years.
To retain the level of detail for DAFW case and demographic estimates published and to publish similar estimates for DJTR cases, a greater number of cases would need to be collected from employers. Based on the results from simulation studies, BLS modified the case subsampling process for employers to reduce the number of cases each employer must submit from 15 DAFW cases to 8 DART cases. This helped keep the total number of cases the same, or burden neutral, and maintained pre-existing agreements with state partners to be workload neutral. Additionally, the publication of case and demographic estimates was changed from an annual to a biennial (two-year) basis. This offset decreases due to collecting fewer DAFW cases and helps reduce the variance, which improves the reliability of estimates. The first biennial case and demographic estimates including details for DJTR cases from survey years 2021-22 were published for the first time in November 2023 and marked the biggest expansion in SOII data in more than two decades.
OSHA Electronic Reporting. The Occupational Safety and Health Administration (OSHA) amended its recordkeeping rules to add requirements for the electronic submission of injury and illness information from specified establishments. Beginning with calendar year 2016 data, establishments with 250 or more employees in all industries and establishments with 20-249 employees in certain industries with historically high rates of occupational injuries and illnesses were required to electronically submit to OSHA information from their OSHA Form 300A (Summary of Work-Related Injuries and Illnesses). OSHA further amended its recordkeeping rule in 2023 to require covered establishments to report detailed case information from the OSHA Form 300 (Log of Work-Related Injuries and Illnesses) and OSHA Form 301 (Injury and Illness Incident Report).
The OSHA reporting rule changes did not add to or change any employer’s obligation to record and retain injury and illness records under OSHA’s regulations for recording and reporting occupational injuries and illnesses. The rule also did not change any employer’s obligation to complete the SOII. These data that employers are required to submit to OSHA are similar to those collected by the BLS injury and illness survey. OSHA requires establishment-specific data to target interventions such as inspections, consultations, and technical assistance.
BLS formed a working group with OSHA to assess data quality, including timeliness, accuracy, and public use of the collected data, as well as to align the Injury Tracking Application (ITA) collection with the BLS Survey of Occupational Injuries and Illnesses. BLS continues to research methods to evaluate ways to utilize OSHA administrative data with SOII data to reduce respondent burden and has implemented an application programming interface (API) that provides an opportunity for OSHA covered establishments to securely import their OSHA ITA into the SOII Internet Data Collection Facility (IDCF).
BLS modified its IDCF for the 2018 SOII to add collection of OSHA ID from SOII respondents who are also required to report to OSHA. BLS can determine, based on industry and employment, which SOII sampled establishments are also required to report to OSHA ITA and these “covered” establishments encounter a screen in SOII IDCF for matching and import of data from ITA. OSHA amended its reporting rules in 2019 to begin collecting the federal Employer Identification Number (EIN) to further aid BLS in matching establishments that have reported to OSHA to attempt to import their data in SOII IDCF. Beginning with survey year 2020, eligible IDCF users have been prompted to enter their assigned OSHA ID which is used to link to reported data in OSHA ITA. If a match is found, additional matching criteria, including EIN, must be satisfied to ensure a definitive establishment match. For matched establishments, summary establishment data were imported from OSHA ITA into the SOII IDCF database for survey years 2020 through 2022. For survey year 2022, approximately 13 percent of OSHA covered establishments attempted to use this API feature to import their OSHA ITA data to SOII IDCF, and approximately 57 percent of these establishments successfully imported their data (7.5 percent of all eligible users).
Following the most recent changes to OSHA’s rule that requires covered establishments to report case details from their OSHA Form 300 and OSHA Form 301, BLS worked closely with the DOL Office of the Chief Information Officer to further expand the API import capability. For the reference year 2023 SOII data collection (currently underway), the expanded API will allow respondents to import details for cases with days away from work, job restriction, or transfer that they are newly required to report, in addition to summary data from their OSHA Form 300A. BLS anticipates this API will allow more than 6,200 respondents to import their summary data and details for more than 24,200 cases from OSHA ITA to SOII IDCF, reducing reporting burden for these respondents.
BLS will use data collected from OSHA ITA to research ways in which these data may be used to improve SOII estimates. For example, OSHA ITA and SOII data linkage could have potential to improve SOII estimation and produce better quality data products. Besides reducing response burden, linked SOII and OSHA ITA data could potentially be used to impute missing cases, to correct illegible or unusable reported cases, or to produce small domain estimates. In addition, linked SOII and OSHA ITA data could be used to evaluate and improve current SOII weighting and estimation accuracy and bias, including nonresponse bias. BLS will continue to evaluate potential uses of linked OSHA ITA and SOII data to improve SOII outputs.
Test for Pre-Collection Letter. The SOII is a mandatory survey that has traditionally experienced relatively high response rates compared to other establishment surveys. However, the SOII response rate has been trending lower for several years and was significantly impacted by the pandemic. BLS will conduct a one-year field test to evaluate the effectiveness for improving response rates by using a pre-collection letter that will be mailed (USPS) to a small sample of establishments. This letter will be mailed 1.5-2 months before the start of collection for the survey to remind respondents and to prepare them for submitting data when the survey opens. The test letter will ask the respondent to verify their establishment information, to advise BLS of any errors, and to provide contact information for the individual who is able to report information on workplace injuries and illnesses at the sampled establishment. The program will work with our Office of Survey Methods Research to evaluate results from the test and to determine the effectiveness of this pre-collection letter for improving survey response. If determined to be effective, BLS will evaluate potential options for expanding the use of the letter to improve response in future surveys.
5. Provide the name and telephone number of individuals consulted on statistical aspects of the design and the name of the agency unit, contractor(s), grantee(s), or other person(s) who will actually collect and/or analyze person(s) who will actually collect and/or analyze the information for the agency.
The
Division Chief of Statistical Methods Group, Xingyou Zhang is
responsible for the sample design which includes selection and
estimation. His telephone number is 202-691-6082. The sample design
of the survey conforms to professional statistical standards and to
OMB Circular No. A46.
| File Type | application/vnd.openxmlformats-officedocument.wordprocessingml.document |
| Author | petrie_a |
| File Modified | 0000-00-00 |
| File Created | 2024-07-24 |
© 2026 OMB.report | Privacy Policy