Supporting Statement Part B
Supporting Statement Part B.docx
Workforce Innovation and Opportunity Act Joint Quarterly Narrative Performance Report
OMB: 1205-0448
SUPPORTING STATEMENT FOR REQUEST FOR OMB APPROVAL
UNDER THE PAPERWORK REDUCTION ACT
PART B –
COLLECTION OF INFORMATION EMPLOYING STATISTICAL METHODS
1. Description of Universe and Selection Methods Used
As described in Part A of the Supporting Statement, the data validation methodology consists of two parts:
1) Report validation. ETA assures the validity of the Senior Community Service Employment Program (SCSEP) aggregate reports by using SCSEP’s Department of Labor (DOL) provided case management system to automatically generate the grantee-level aggregate reports based on the grantee’s individual record files entered into the system and the performance reporting specifications for the quarterly and final year-end report. Edits built into the system assure the validity of SCSEP’s performance reports.
Data element validation assesses the accuracy of participant data records. For SCSEP, the universe for data element validation comprises all SCSEP records submitted to ETA during the prior program year. This information is drawn from the DOL provided case management system. Data element validation is performed by reviewing samples of participant records against source documentation to ensure compliance with federal definitions and to verify the accuracy of the information contained in the system.
The data validation process results in an estimate of the error rates for each data element and each reported count. Error rates are estimated separately for each grantee for SCSEP.
The methodology for data element validation employs sampling to improve the efficiency of the validation process. To minimize grantees’ burden in performing validation consistent with producing a reliable estimate of the error rates, the data element validation process is designed to compute a reliable error rate using the smallest possible sample size. To accomplish these objectives, two sampling techniques are used:
Variable sampling rates among grantees are used to reduce the burden on small grantees as much as possible.
Oversampling of high-risk and high-importance cases is used to provide a more accurate estimate of the error rate.
These sampling methods consider the number of records so that the overall burden is reduced as much as possible, while still achieving a reliable estimate of error.
To reduce the burden on grantees, the DOL provided case management system includes a validation system that calculates the validation values, imports the reported counts, draws the data element validation samples, produces online and paper validation worksheets, calculates error rates, and produces the validation reports.
Data validation relies on existing records from grantee data in the system and case files. Response rates are not an issue with the data validation process because the data are sampled from the entire participant file and so do not require survey responses.
SCSEP currently funds 75 grantees. This includes 19 national grantees – two of which have both general and set-aside grants – operating in 47 states, the District of Columbia (DC) and Puerto Rico, and 56 state and territory grantees.
-
Grantee Type
Number of Grantees
National Grantees
19 (two operate both general and set-aside grants)
State and Territory Grantees
56
Total:
75
2. Procedures for the Collection of Information
A. Statistical Methodology for Stratification and Sample Selection
As noted above, report validation does not require grantees to obtain information via surveys because the entire participant file is utilized during this validation procedure.
For data element validation, multistage samples of participant records are drawn. Two independent samples are selected for each grantee: eligibility and performance. The following table describes the population frame for each sample.
Sample |
Population |
Eligibility Sample |
Count of enrollments where the initial assignment date for the enrollment is within the program year and the enrollment was not connected with a transfer or a defunct sub-grantee. |
Performance Sample |
Count of enrollments where the participant exited in the retention cohort for the last four quarters of the program year and the enrollment was not connected with a transfer or a defunct sub-grantee. |
Stratification is not employed within the samples in the selection of grantees or records. Records are randomly sampled directly for the eligibility sample, with no weighting. For the performance sample, each record has a probability of selection proportional to its weight.
To increase the efficiency of the process, records in the performance sample receive a risk weight of 1, 2, or 3 based upon two factors: whether the record is a success for calculating performance (i.e., whether the SCSEP participant was employed in the first quarter after exit), and the risk that the data used to calculate performance are in error.
The table below details the actual size of the eligibility and performance samples from Program Year 2020 and 2021, as example of sample sizes in future data validation cycles.
|
Program Year 2020 |
Program Year 2021 |
Eligibility Sample |
2,245 |
3,443 |
Performance Sample |
5,073 |
3,876 |
Total |
7,318 |
7,319 |
SCSEP Methodological Details
The SCSEP sampling algorithms draw a weighted performance sample from those participants who exited during the retention time period. Each record in the retention cohort is assigned a weight of 1, 2, or 3. Records are sampled with a probability proportional to their size. Thus, instead of selecting records directly as is done with the eligibility sample, records are selected based upon their weight. The details below explain how to draw the SCSEP validation sample. It provides methodological details on the sample frame (i.e. the universe of records from which the sample will be drawn), the sample size, the weighting scheme, and the selection process.
IMPORTANT NOTE: Several of the variables developed during the sampling process are necessary to calculate the error rates for data element validation. The following fields are particularly important for the calculation: each record’s weight (whether or not the record was sampled), each record R_Seli value, n (the calculated samples size), and n_Non_Cert. In addition, other variables are needed to test the sampling algorithm.
Calculate the number of enrollments where the participant exited in the retention cohort
First, we will calculate the number of enrollments where the participant exited in the retention cohort for the last four cohorts. The retention cohort is defined as those whose 4th quarter after exit quarter is within the program year for the sample. Enrollments involved in a transfer, associated with defunct sub-grantees and withdrawn enrollments are excluded from the sample.
Calculate the Sample Size
We use the following formula to determine the sample size based in part on the number of enrollments identified in the cohort.
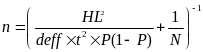
Where n = sample size, HL is the half-length of the confidence interval, N is the number or records, t = 1.96, deff = 2 and P = 0.95. If n is not an integer the number is rounded up to the nearest integer > n.
If the count of enrollments in the retention cohort for the grantee is greater than 500, then the confidence interval (CI) = 0.035, Else CI = 0.04.
The maximum sample size allowed for a grantee is 250.
Assigning Risk Weights to Each Record
For each retention exiter:
Assign a risk weight of 3 if the exiter has indicated they have earned wages in the second and fourth quarter after exit quarter and have indicated that their earnings in the 2nd quarter after exit quarter are greater than zero.
Assign a risk weight of 2 if the exiter has indicated they have earned wages in the second quarter after exit quarter.
Assign a risk weight of 1 to all remaining exiters who have not been assigned a risk weight.
Set key variables for record selection algorithm
In order to accurately generate the sample using the algorithm, we determine the following values:
Total weight = sum of all risk weights for retention exiters
Sampling interval = the Total weight divided by the sample size
Select first round of records with certainty
Select all records where weight of record is greater than or equal to the Sampling interval. If this would result in selecting more than n records, randomly select n records where the risk weight of the record is greater than or equal to the Sampling interval.
Calculate variables related to the second round of sampling
If we were not able to select all the records for the sample in the first round, we will establish some values to allow us to generate a second round of sampling.
Total_Weight_Non_Cert = Sum of the Risk Weight for all of the retention exiters whose weight is less than Sampling_Interval.
n_Non_Cert = sample size (n) – (number of records with weight >= Sampling_Interval).
Sampling_Interval_Non_Cert = Total_Weight_Non_Cert / n_Non_Cert.
Select second round of records with certainty
Select all records where the risk weight is greater than or equal to Sampling_Interval_Non_Cert and the record has not already been selected in a prior round. If this would result in selecting more than n_Non_Cert records, randomly select records with weight 2 until n_Non_Cert records are selected. For all records selected in this step.
If certainty records are selected, update and recalculate variables.
Variables referenced earlier and used to determine the selection of the second round should be recalculated at the end of the second round based on the remaining records in the retention exiter population that have not already been sampled.
Select records randomly to complete the sample
For the remaining records that have not been selected, we will need to determine how many of these records need to be selected to build a sample equal to the sample size. If all records are needed to complete the sample, we are going to include all remaining records.
If the number of remaining records exceeds the number of records needed to equal the sample size, we will firstly, determine a random number between 0 and a sampling interval defined as the total risk weight of the remaining records divided by the number of remaining records. Then, we will select all remaining records with a risk weight greater than or equal to the newly defined sampling interval.
After we have looped through the remaining records and determined if each record meets the criteria for selection, we will then reset the initial values for the remaining records in the sample and repeat the review of remaining records until we have selected the predetermined amount of retention exiters in the sample.
B. Estimation Procedure
Estimation encompasses computing sample weights and error rates. Validators compare the data from the samples to source documentation. Once all the data have been evaluated, error rates are calculated for each data element. These error rates are estimated using data weighted to account for differences in probability of selection. The validation software computes the sampling errors for each grantee, taking into account the multistage design and the use of unequal weights.
SCSEP Error Rate Calculation
The first step to calculating the weight is to determine the probability of selection for each record. This is used to calculate the record’s error weight, which determines how it impacts the error rate calculations. To calculate the error rates, the weights of the records that are in error are divided by the weights of all records validated, or all records sampled depending on the type of error rate calculation. Error rates are calculated for each data element.
For each record, set Error_w(j) = 1/p_selectioni, p_selectioni = 1 if (R_seli = Certainty), else

Two error rates must be calculated for each data element validated. The numerator is the same for both – the sum of the error weights for those records for which the appropriate data element failed. The denominators differ. For the reported data error rate, the denominator equals the sum of the error weights for all records sampled for the funding stream that should be validated. On the other hand, the overall error rate denominator equals the sum of the error weights for all records sampled for the funding stream. Because users can constantly change their validation results, the results need to be calculated when opened.
REPORTED DATA ERROR RATE = (Error_w(j) * P_FDE) for each record sampled/ (Error_w(j) * VAL(j)) for each record sampled, where P_FDE = 1 if the element failed the validation and P_FDE = 0 if the element passed the validation or if the grantee was not required to validate the element for this record.
VAL(j) = 1 if the grantee was required to validate the element for the record. VAL(j) = 0 if the grantee was not required to validate the element for the record.
OVERALL ERROR RATE = (Error_w(j) * P_FDE) for each record sampled for the / Error_w(j) for each record sampled, where P_FDE = 1 if the element failed the validation and P_FDE = 0 if the element passed the validation or if the grantee was not required to validate the element for this record.
Note that each data element gets its own error rate calculation.
C. Degree of Accuracy Needed for Purpose Described in the Justification
Error rates for each data element have confidence intervals varying with the size of the sample, from 3.5 percent to 4 percent.
D. Unusual Problems Requiring Specialized Sampling Procedures
The discussion above indicates that the methodology uses specialized sampling procedures. The rationale for using these procedures rather than pure stochastic methods is to minimize the burden that data element validation imposes upon the grantees.
3. Response Rates
As mentioned in Part 1, response rate issues do not arise in the data validation program. Data validation relies on existing records from the SCSEP Performance and Reporting System and case files. Through the use of valid sampling techniques, the validation process results in estimates of data accuracy that can be generalized to the universe of data reported to ETA on program performance and activities.
4. Tests of Procedures or Methods
SCSEP has been conducting validation for ten years. The grantees received training prior to beginning validation and receive ongoing training and technical assistance from ETA’s data validation contractor and national office staff throughout the validation process. Results of these data validation activities indicate that the methodology has functioned as intended and has enabled states to identify and address reporting errors.
5. Individuals Consulted on Statistical Aspects of the Design
William S. Borden Senior Fellow Mathematica Policy Research, Inc. (609) 275-2321
|
Donsig Jang Vice President and Director NORC at the University of Chicago (301) 634-9415 |
| File Type | application/vnd.openxmlformats-officedocument.wordprocessingml.document |
| File Modified | 0000-00-00 |
| File Created | 0000-00-00 |
© 2026 OMB.report | Privacy Policy