OMB Memo
AIES Pilot Phase II OMB Letter FINAL_mc_clean.docx
Generic Clearance for Census Bureau Field Tests and Evaluations
OMB Memo
OMB: 0607-0971
Annual Integrated Economic Survey (AIES) Phase II Pilot Research Program1
Submitted Under Generic Clearance for Field Tests and Evaluations
Request:
The U.S. Census Bureau plans to conduct additional research under the Generic Clearance for Census Bureau Field Tests and Evaluations (OMB Control Number 0607-0971). We will be conducting a suite of multi-method research in support of the development of the Annual Integrated Economic Survey (AIES); previous research in support of this survey has been conducted under the generic clearance for questionnaire pretesting research2. Most recently, the Census Bureau has completed Phase I of the pilot which informs this request. The goal of this specific request is to conduct further pilot testing of the harmonized annual survey for AIES through deployment of the updated instrument, followed by qualitative follow-up interviews and a short survey to understand response processes, gauge burden, and identify barriers to survey completion.
This memo details a request for Phase II of this testing and includes findings from Phase I as they pertain to Phase II.
Background on the AIES:
The Census Bureau’s Economic Directorate asked the National Academy of Sciences (NAS) to convene an expert panel to review their appropriated annual economic surveys and recommend improved methodologies for conducting and processing them. The panel started work in July 2015 and the final report was released in May 2018 (Reengineering the Census Bureau's Annual Economic Surveys). From these recommendations, the Economic Directorate is conducting research towards the goal of harmonizing and simplifying the design and production process for these surveys and the Economic Census.
The research described herein represents the culmination of incremental projects designed to harmonize disparate annual surveys across economic sectors. This research program began with a series of focus groups and interviews to determine the record-keeping practices of medium-sized multi-unit companies, beginning in July 2019. The findings from this research informed a further exploration of the accessibility of various data by topic (including revenue, expenditures, and others) by unit of analysis (including company, establishment, state, and others), beginning in October 2020 (see Attachment E for an overview of this project). At the same time, survey operations staff in the Economic Directorate began the process of consolidating contact information for the largest firms, leading to a multi-year pilot focused on coordinated contact for the current annual surveys. The first two rounds of contact consolidation were supported by two rounds of debriefing interviews: the first, beginning in March 2020, examined the impact of the contact strategies used in the pilot (see Attachment F), while the second, beginning in August 2021, focused on non-respondents and barriers to completion (see Attachment H).
The results of all this research have been incorporated to compile a single harmonized survey instrument designed to be administered as an economy-wide program, regardless of firm size, industry, or other characteristics. In December 2021, we received approval to conduct the first phase of pilot research in support of the new instrument. We have also conducted cognitive testing on the harmonized instrument (see Attachments I and J).
This request, then, moves the integrated survey program forward toward the calendar year 2024 (survey year 2023) full implementation goal by providing additional opportunities for survey implementation research.
Purpose:
Building on the success of Phase I of the pilot, the research laid out in this request is the next step in further instrument refinement and scalability of the pilot. For continuity, we are retaining the research questions identified in Phase I; these questions pertain to response and response processes and to the resultant data, and include:
Response-Centered Research Questions:
How are respondents completing the survey?
Can respondents provide answers to the questions on the new survey?
Does the order and structure of the new survey make sense?
Compared to the current annual surveys, is the new survey overly burdensome?
Data-Centered Research Questions:
Is the new survey resulting in quality data?
Is the new survey using appropriate collection units?
Are unit non-response patterns the same or different as in annual surveys?
What do the resultant data from the new survey look like?
Population of Interest:
Phase II will include a wider group of firms compared to Phase I. In total, we will target 500 companies for response to Phase II, to be split as subject-matter experts and Census Bureau mathematical statisticians deem appropriate given sample restrictions, but to include smaller and larger sized businesses. However, we estimate that recruitment and response numbers could be reflective of the breakdowns outlined in Table 5.
Table 5: Response targets by firm size and complexity for Phase II
|
Size |
Total |
||
Complexity |
Small |
Medium |
Large |
|
High complexity – equal or near equal mix of manufacturing and nonmanufacturing establishments |
33 |
33 |
34 |
100 |
Medium complexity – mostly manufacturing establishments, but at least one non-manufacturing establishment |
34 |
33 |
33 |
100 |
Low complexity – non-manufacturing establishments only |
58 |
184 |
58 |
300 |
Total |
125 |
250 |
125 |
500 |
This recruiting matrix attempts to scale up the size of the Phase II pilot – more than five-fold what was collected in Phase I.
Methods:
Once the cases are decided, phone recruitment can begin. We aim to recruit 500 companies in total, and so will need more than 500 identified firms to begin with. Phone recruitment may include an initial email contact, particularly for those companies already in contact in previous iterations of research. As an incentive to participate in the pilot, respondents can answer the pilot to meet their mandated reporting obligations for the annual surveys through survey year 2023.
Once recruited, and after receiving informed consent to participate (see Attachment A for the consent form), we will send firms a “welcome to the pilot” email. This will include an overview of using the updated pilot instrument and contact information should the respondent need support.
In January 2023, we will begin fielding the online survey. The online survey will test the harmonized questions and updated survey layout and functionalities based on findings from Phase I of the pilot. See Attachment B for the survey instrument.
As responses to the survey are submitted, researchers will conduct debriefing interviews with up to 50 companies lasting no more than one hour, regardless of response status within the pilot. These interviews will focus on response processes, challenges, and benefits to the new survey instrument, or, for non-respondents, barriers to completion. See Attachment D for the debriefing interview protocol.
Finally, within five days of completing the pilot survey, we will send respondents a Response Analysis Survey (RAS) estimated to take no more than 10 minutes to complete. A RAS is a retrospective structured questionnaire that can “generate quantitative data about how respondents answered questions, about the records available for answering those questions, and about the real burden imposed by a survey” (Goldenburg 1993: 2). A RAS research project conducted by the Bureau of Labor Statistics found that “the largest group of errors identified… are errors associated with the data collection instrument, and specifically with the wording and layout of questions and instructions [including] problems with understanding concepts or terminology, adherence to definitions, use of reference periods, and missing or unclear instructions" (1993: 9). The AIES Pilot RAS will focus on real and perceived burden as well as response processes to better refine the survey instrument. See Attachment C for the RAS instrument.
Timeline:
We anticipate recruitment to begin upon approval of Phase II of the pilot research. We plan to make the Phase II instrument available for respondents through March 2023. Debriefing interviews will begin as soon as responses are submitted and will complete by April 2023; the Response Analysis Survey will be triggered within five days of full submission of the Phase II instrument.
Sample:
While Phase I provided rich information on the response process for the harmonized instrument, it was ultimately a small-scale endeavor. To better estimate burden, as well as response processes and barriers for a wider array of companies, then, we need to scale up the pilot to reach additional businesses. This will include additional medium-sized companies and those that responded to the pilot, but also expand out to smaller and larger-sized companies to gather information on their unique response needs.
We will aim for 500 recruited firms currently in two or more production samples for in-scope annual surveys3. We will also invite the 62 companies from Phase I that provided any data in any of the modules. By including these cases, we can look for changes in response behavior due to changes in the instrument features. The maximum number of responding companies for Phase II of the pilot, then, is 562. See Table 5 for an overview of target response companies’ complexity and size.
Length of Interview:
We estimate that the survey will take an average of 210 minutes for each complete response4. We expect to send emails and make phone calls in support of recruitment conversations to 800 identified firms, taking no more than 20 minutes each, with a goal of recruiting 500 new firms to the pilot. We expect to send one email and make one phone call in support of additional recruitment of the 62 companies that previously reported data in Phase I. We will conduct up to 50 debriefing interviews lasting no more than 60 minutes each with firms regardless of response status, and use up to 20 minutes with up to 75 firms to negotiate the logistics of these interviews.
Table 6: Total Estimated Burden -- Phase II
Category of Response |
Number of Respondents |
Participation Time (in minutes) |
Burden (in hours) |
Recruitment conversations |
800 |
20 |
267 |
Survey |
562 |
210 |
1967 |
Response Analysis Survey |
300 |
10 |
50 |
Debriefing interviewing recruitment logistics |
75 |
20 |
25 |
Debriefing Interviews |
50 |
60 |
50 |
Total |
2,359 hours |
||
Justification for Title 13 mandatory authority for Phase II
This is a pilot test for the Annual Integrated Economic Survey, standing in place of the current annual surveys, which provide current data between and are supplementary to the 2022 Economic Census. The Census Bureau proposes to use Title 13 mandatory authority for this collection for several reasons:
The provision of mandatory authority replicates a key production condition for the current annuals program, which may also invoke analogous behaviors among respondents in their attention to the response task, impacting both response rates and data quality.
Most cases will be answering the pilot in place of responding to the traditional annual surveys into which they have been sampled. If the resultant pilot data for these cases are of high enough quality, they may be integrated back into the traditional annual survey data, and be used to generate public-facing estimates.
Under the circumstances outlined above, we believe that using Title 13 mandatory authority will enable us to achieve a high enough response rate to ensure adequate response for statistical and non-statistical evaluations of the pilot survey. In Phase I, 62 of 78 recruited companies (79.4 percent) provided at least some response data. This is within ten percentage points of the annual response rates obtained for mandatory surveys with similar content and collected from similar target populations:
Table 7: In-Scope Annual Surveys Response Rates, 2017 - 2019
Survey |
2017 |
2018 |
2019 |
Annual Capital Expenditure Survey |
69.8% |
78.0% |
63.9% |
Annual Retail Trade Survey |
64.4% |
64.3% |
59.4% |
Annual Survey of Manufactures |
Not collected |
67.7% |
63.6% |
Annual Wholesale Trade Survey |
71.1% |
71.3% |
70.4% |
Services Annual Survey |
67.4% |
69.6% |
67.1% |
Source: Economic Management Division internal calculations, estimates rounded. |
|||
Language:
All correspondences, materials, and interviews will be in English only.
Incentives:
No monetary incentives are included in this research program. Respondents will respond to the pilot instrument in place of their typical annual surveys for survey year 2023.
Relevant Findings from Phase I of the Pilot
Phase I of the AIES Pilot provided a multifaceted look at how companies approached the new integrated instrument. Some of the key findings from that research point to the need for a second, follow-up set of research.
Response Mode and Spreadsheet Refinement
Specifically, we learned about the response process respondents used to complete the pilot instrument. At the beginning of each section of the survey, we gave respondents the choice to respond by spreadsheet or by form view. Note that we recommended that companies with five or more establishments consider using the spreadsheet to report. Interestingly, respondents set their own path through the survey, mixing response mode by level of collection. For example, while most companies responded by form view for Module 1 – Company-level data collection, in subsequent modules, most companies opted to respond by spreadsheet when the data were at the industry (6-digit NAICS) or establishment (location) level. See Table 1 for an overview of response mode by module.
Table 1: Number of Companies by Response Mode by Module
|
Module 1: Company-level data |
Module 2: Establishment-level data |
Module 3: Industry-level data** |
|
Manufacturing* |
Non-Manufacturing |
Non-Manufacturing |
||
Spreadsheet |
15 |
11 |
41 |
36 |
Page-by-page |
39 |
3 |
10 |
7 |
Combination |
0 |
0 |
1 |
0 |
Total |
54 |
14 |
52 |
43 |
*Note: 22 companies in the pilot had establishments classified at the 6-digit NAICS as “manufacturing.” |
||||
**Note: Module 3 Manufacturing asked only about capital expenditures at the manufacturing industry-level. These data were experimental and are not included in the pilot results. |
||||
In addition to response patterns, we have also gotten feedback on the layout of the Phase I spreadsheets. Many of those who responded by spreadsheet mentioned how convenient it was to organize their data. However, one consistent finding with the spreadsheets is that by splitting them into manufacturing and non-manufacturing components, we added a layer of complexity to the response process. Said one respondent, “Once I figured out it was there, I loved having the spreadsheet. A challenge is that manufacturing is broken out from the other stuff. [If it was all together] I could consolidate back to my consolidated financials and then that way I know that you have all of the pieces.” Said another, who only had non-manufacturing establishments, “Having all the pieces within that one Excel spreadsheet may have shaved off two to four hours - because everything is one place.”
Finally, one important aspect of the AIES is that it asks questions across multiple topics and multiple units (company, establishment, and industry). As such, we have the opportunity to see how these units relate to each other across the survey. We can look at the values from Module 2 – the establishment level – for manufacturing and nonmanufacturing establishments and compare them to the responses from Module 1 – the company level – to see if the parts equaled the whole.
Figure 1: Number of Companies by Sum Values Match
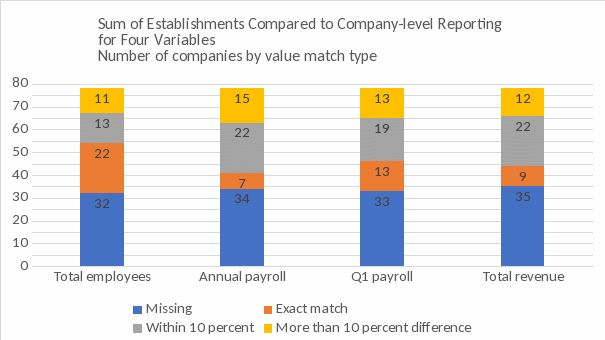
Note that for each of the four variables, about half of companies – between 32 and 35 – were missing one or more components to run this comparison. This is the bringing together of unit and item nonresponse: some did not provide the response to Module 1, so there is no company-level value to which to compare the sum of establishments. Some completed Module 2 for only some establishments, so some establishments are missing. And some missed individual questions within a given establishment, so item nonresponse impedes comparisons.
Of the about half of responding companies where we can compare the establishment-level response to the company-level response, total employees had the highest perfect match rate – the sum of the establishments was equal to the total company-wide data for 22 of 78 companies. It also had the highest approximate match – the sum of the establishments and the company total are within ten percent of each other for an additional 13 companies.
We did have cases where the sums were not within the ten percent tolerance. Some of this is due to measurement error; we suspect that respondents did not understand that these responses should be summative. But some of this mismatch is also due to rounding error, where respondents may have entered value rounded to the nearest thousand at the company level but then entered an exact value at the establishment level. Some may be due to entry errors, where a respondent “fat fingered” a wrong digit along the way. We suspect, however, that one of the shortcomings of the pilot programming is coming into play here: respondents tended to answer Module 1 – the company level – in one sitting, but then completed module 2 over multiple periods. The issue is that once the respondent submitted their answers to Module 1, they could no longer reference those answers in our instrument. This flaw may have proved fatal: respondents were not sure what they were summing up to since they could not reference their responses in Module 1. A suggestion might be, then, that the next iteration of the instrument explicitly build this relationship – such that respondents can check the sum of their establishments against their reported company totals.
Phase II Goals:
Introduce a mixed-mode response approach that uses both page-by-page design at the company-level and respond-by-spreadsheet at the establishment and industry level.
Test key elements of the spreadsheet design:
Holistic unit listing
Units summing to reduce burden
Trade-specific content noted
Burden estimates
We have several measures of how burdensome the AIES instrument is, but because of the size of Phase I, our understanding of burden is limited.
We can break burden into two phenomena: real and perceived burden. Generally, real burden is the amount of time and resources that a company must commit to completing a survey, and perceived burden is a respondent’s perception of how cumbersome or challenging a survey is. We asked about both – the real and perceived burden – on the Response Analysis Survey (RAS). On average, respondents reported that the survey took about 16 hours to complete. That ranges from a reported low of 3 hours to a reported high of 40 hours.
Table 2: Respondent-Reported Actual Burden for the AIES Phase I Pilot Instrument
Approximately how long did it take to complete the AIES questionnaire modules for this company, including time spent reviewing instructions and gathering the necessary data? N = 15 |
|
Mean |
970.4 minutes (≈16 hours) |
Low |
180 minutes (3 hours) |
High |
2,385 minutes (≈40 hours) |
We also specifically asked about perceived burden in the RAS. No one called the survey “extremely easy” compared to the current annual surveys. Some respondents noted no difference from current annuals, while others said it was “somewhat” or “extremely” difficult comparatively. This is echoed in asking about relative time to complete – 3 said it was less time than usual, and another 3 said it was about the same, but 7 said it was more time to complete the pilot than to complete the current annual surveys.
Table 3: Number and Percentage of Respondents by Perceived Burden for the Phase I AIES Pilot Instrument
Compared to annual surveys you have answered in previous years, how easy or difficult did you find completing the AIES questionnaire modules? (N = 15) |
||
|
N |
Percentage |
Extremely difficult |
1 |
7.7 |
Somewhat difficult |
5 |
38.5 |
Neither easy nor difficult |
4 |
30.8 |
Somewhat easy |
3 |
23.1 |
Extremely easy |
0 |
0 |
Compared to annual surveys you have answered in previous years, how much time did it take to complete the AIES questionnaire modules? |
||
Less time |
3 |
23.1 |
About the same amount of time |
3 |
23.1 |
More time |
7 |
53.9 |
The RAS was only asked of responding companies, and not all responding companies answered the RAS. But, we also have heard from non-respondents, especially those that dropped out of the pilot. Six companies dropped out and the main reason was the burden. Said one, “it is too much to enter information for all of these [250] establishments.” Said another, “each question for each location is way too time consuming.” Respondents are not used to being asked for this level of data for each establishment (except for those in manufacturing who already report at the establishment level).
Respondents also made mention of burden when they contacted us. Some respondents admitted that they did not spend any more or less time on the pilot than they would have usually spent. These respondents were also most likely to notice that the content hadn’t really changed all that much, just been put into one survey. A few mentioned that it was taking more time than usual, and a few mentioned that they liked having everything presented in one survey at one time so that they could compile the data all at once.
Because of the small number of responses to Phase I – both the harmonized instrument and the RAS – and the mixed responses, we do not currently have a good measure of the burden of the harmonized instrument.
Phase II Goal:
Gain additional information about response burden, including respondent-reported perceived and actual burden.
Respondent Communications
Over the course of the first phase of the pilot, in addition to the planned research activities, we also received unsolicited feedback from respondents in the process of completing the survey. For the most part, this communication came in the form of emails to our general help inbox and phone calls to pilot staff. When we received these communications, we catalogued them, noting the main concern of the message and to which response case it related. What emerges, then, is a picture of some of the communication needs moving forward. See Table 4 for an overview of the top ten issues raised by incoming respondent communications, including examples of each of the types of issues raised.
Table 4: Top Ten Reasons for Respondent-Initiated Communications
Topic |
Representative Example |
Number of Instances* |
|
Instrument Malfunction |
Instrument not performing as expected, e.g., not loading |
35 |
|
Data Submission |
Requests for verification that the response data were received |
28 |
|
Unit of analysis |
Reporting data for holding companies and other usually out-of-scope parts of the company |
25 |
|
Due date |
Request for extension of or clarification around the due date |
23 |
|
Questionnaire integration |
Which surveys does the AIES replace, and which still need a response |
21 |
|
Issue related to response process |
Reaching out to additional people within the company to get the data |
17 |
|
Instrument functionality |
Auto summing between questions |
10 |
|
Issue with classification or establishment or industry listing |
Duplicate establishment, misclassification |
7 |
|
Issue with question wording |
Ambiguous question wording |
7 |
|
Spam, nonreceipt, or other issue with outgoing communication |
Request to resend the survey invitation |
7 |
|
*Note: some communications were coded to more than one topic or had more than one instance of a single topic within the communication. These numbers represent instances, not the number of communications. |
|||
While some of the issues raised by respondents in their communications are unique to the pilot – for example, instrument malfunctions are an artifact of using a reporting environment different than our typical online survey instruments – others portend issues we may have moving into wider production in 2024. For example, we heard from respondents that they want direct communication that their submitted response data had been received. We also heard questions about what to do with usually out-of-scope pieces of the business, and about which surveys AIES is designed to replace. Knowing this, we can begin to design additional support documentation to address these issues so that they are not amplified in production.
At the same time, much of the respondent communications was handled by a very small staff for the pilot. We know, looking toward production, that we will need additional support from Census Bureau staff to answer questions and support respondents. This will involve training Census Bureau staff to answer questions about the harmonized instrument as well as standardizing messaging across all of the in-scope surveys for the integrated survey.
Phase II Goal:
Develop respondent communications, including supplementary support documents, invitation and follow-up emails, and Census Bureau staff response to in-field questions.
Summary Research Goals:
Revisiting the original research questions, we can then see how each of the data collection efforts included herein is designed to provide answers to each question:
Table 4: Summary Research Questions and Methods of Inquiry
Research Topic |
Research Question |
Method of Inquiry |
Response-Centered |
How are respondents completing the survey? |
|
Can respondents provide answers to the questions on the survey? |
|
|
Does the order and structure of the survey make sense? |
|
|
Is the survey burdensome? |
|
|
Data-Centered |
Is the new survey using appropriate units of analysis? |
|
What do the resultant data look like? |
|
Timeline:
Activities for this pilot research will run from December 2022 (contingent upon approval) through the delivery of findings in May 2023.
Table 9: Overall AIES Pilot Schedule
Initial recruitment |
No later than December 2022 |
Field period start |
January 15, 2023 |
Debriefing Interviews begin |
At first fully completed survey |
Survey closeout |
March 15, 2023 |
Interviewing ends |
April 30, 2023 |
Findings due |
May 2023 |
Works Cited:
Goldenberg, Karen L., Shail Butani, and Polly A. Phipps. 1993. Response Analysis Surveys for Assessing Response Errors in Establishment Surveys. Washington, DC: Bureau of Labor Statistics.
Enclosures:
Included in this package are the following enclosures:
Attachment A: Phase II Respondent materials: recruitment email, welcome email, due date reminder email, first follow-up email, second follow-up email; privacy, confidentiality, and consent notice
Attachment B: Copy of the survey items for AIES Pilot Survey
Attachment C: Copy of the survey items for the Response Analysis Survey
Attachment D: Protocol for the AIES Pilot Survey debriefing interviews.
Attachment E: Findings from the Record Keeping Study
Attachment F: Findings from the First Round of the Coordinated Collection Respondent Debriefing Interviews
Attachment G: Findings from the Data Accessibility Study
Attachment H: Findings from the Coordinated Collection Non-Respondent Debriefing Interviews
Attachment I: Findings from the First Round of Cognitive Testing
Attachment J: Findings from the Second Round of Cognitive Testing
Contact:
The contact person for questions regarding data collection and statistical aspects of the design of this research is listed below:
Melissa A. Cidade, Ph.D.
Survey Methodologist
Economic Management Division
U.S. Census Bureau
Washington, D.C. 20233
(301) 763-8325
Melissa.cidade@census.gov
cc:
Nick
Orsini (ADEP) with attachments
Lisa Donaldson (EMD) “ ”
Stephanie Studds (EWD) “ ”
William Davie (ESMD) “ ”
Thomas Smith (EMD) “ ”
Michelle Karlsson (EMD) “ ”
Jenna Morse (EMD) “ ”
Jennifer Hunter Childs (ADRM) “ ”
Jasmine Luck (ADRM) “ ”
Mary Lenaiyasa (PCO) “ ”
Danielle Norman (PCO) “ ”
1 The Census Bureau has reviewed this data product for unauthorized disclosure of confidential information and has approved the disclosure avoidance practices applied. (Approval ID: CBDRB-FY23-ESMD001-001).
2 Previous research projects approved through OMB Control Number 0607-0725 and reviewed for Disclosure Avoidance (see Attachments E – J for reports):
In-depth Exploratory Interviewing to Study Record-Keeping Practices, July 2019
Respondent Debriefings for the Coordinated Contact Pilot Experiment, March 2020
Cognitive Interviewing for the Content Harmonization and Collection Unit Determination Instrument, October 2020
Non-respondent Debriefings for the Coordinated Contact Pilot Experiment, August 2021
Cognitive Interviews for the Annual Integrated Economic Survey, Phase I, October 2021
Cognitive Interviews for the Annual Integrated Economic Survey, Phase II, October 2021
3 In-scope annual surveys include Annual Wholesale Trade Survey (AWTS), Annual Retail Trade Survey (ARTS), Services Annual Survey (SAS), Annual Survey of Manufactures (ASM), Annual Capital Expenditures Survey (ACES), Company Overview Survey (COS), and the annual Manufacturing Unfilled Orders Survey (M3UFO).
4 Note: of the eligible surveys, the highest estimated burden is for the Annual Survey of Manufactures at 210 minutes (3.5 hours). We are requesting the maximum burden for all respondents – even those not in manufacturing – in case respondents need additional support or issues in responding to the pilot instrument.
| File Type | application/vnd.openxmlformats-officedocument.wordprocessingml.document |
| Author | Melissa A Cidade (CENSUS/EMD FED) |
| File Modified | 0000-00-00 |
| File Created | 2024-07-20 |
© 2026 OMB.report | Privacy Policy