OMB Appendix A Pilot Study Data
Appendix_A_Pilot_study_data.docx
National Sleep Study
OMB Appendix A Pilot Study Data
OMB: 2120-0798
Pilot study data
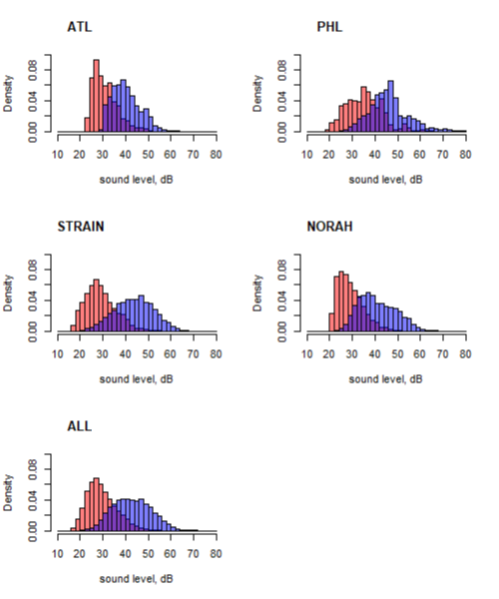
This appendix summarizes the four pilot studies around Atlanta, GA (ATL), Philadelphia, PA (PHL), Frankfurt, Germany (NORAH) and Cologne, Germany (STRAIN), which were used to estimate model parameters for the calculation of sample size for the field study. The number of participants and aircraft noise events during sleep are given in Table A1. The distributions of the measured maximum and 1-minute background sound pressure levels in the bedrooms in each study are given in Figure A1. Details for the fitted Model 0 coefficients for the 4 pilot studies, and their average values, are provided in Table A2 (see Section B1.3).
Table A1 Summary of pilot studies.
Pilot study |
Aircraft noise events (n) |
Study participants (n) |
ATL |
1670 |
23 |
PHL |
2010 |
32 |
STRAIN |
17,095 |
63 |
NORAH |
8,695 |
162 |
Total |
29,470 |
280 |
Average |
7367 |
70 |

Figure A1 Histograms of background LAeq,1minute (red) and LAS,max (blue) for pilot data. Sound pressure levels were measured indoors in the bedroom.
Table A2 Summary of Model 0 to fit pilot data. The last row was used to generate the true parameters in Model 2.
Pilot |
β0 (SD) |
β1 (SD) |
Cov(β0, β1) |
Var(b0) |
Var(b1) |
Cov(b0, b1) |
ATL |
-3.5244 (0.6356) |
0.0296 (0.0147) |
-0.0092 |
0.7988 |
0.00018 |
-0.0122 |
PHL |
-4.2744 (0.7139) |
0.0418 (0.0150) |
-0.0106 |
3.7876 |
0.00157 |
-0.0764 |
STRAIN |
-4.1686 (.3453) |
0.0403 (0.0477) |
-0.0027 |
4.0348 |
0.00227 |
-0.0930 |
NORAH |
-5.0672 (0.3042) |
0.0619 (0.0071) |
-0.0021 |
2.1062 |
0.00124 |
-0.0478 |
Average |
-4.2586 (0.6328) |
0.0434 (0.0134) |
-0.0084 |
2.6819 |
0.00132 |
-0.0573 |


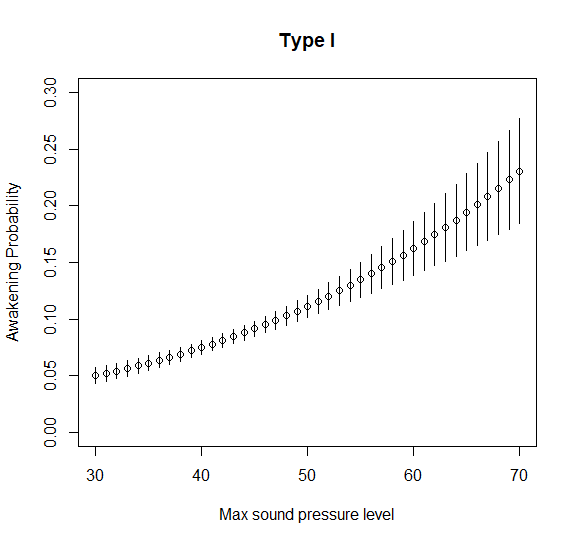
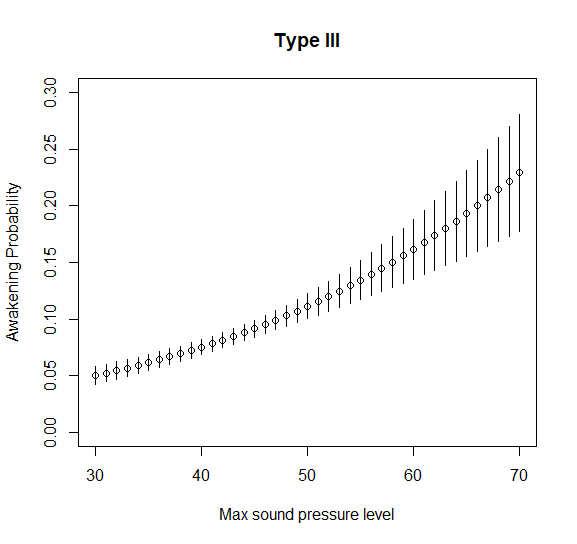
Figure A2 Empirical 95% confidence interval for P(Awake| LAS,max) for the medium-high traffic scenario with type I random effects (left) and the type III random effects (right).
| File Type | application/vnd.openxmlformats-officedocument.wordprocessingml.document |
| Author | Michael Smith |
| File Modified | 0000-00-00 |
| File Created | 2021-04-14 |
© 2026 OMB.report | Privacy Policy