Form 0920-0572 Message Testing Survey
CDC and ATSDR Health Message Testing System
AttA Word Survey 20200602
Message Testing: Radiation Emergencies and Cancer Risk
OMB: 0920-0572
Form Approved
OMB No. 0920-0572
Exp. Date 08/31/2021
ATTACHMENT A: WORD SURVEY
Title of research study:
Message Testing: Radiation Emergencies and Cancer Risk (Online Survey)
KEY INFORMATION: The following is a short summary of this study to help you decide whether or not to be a part of this study. More detailed information is included later on in this form.
Why am I being invited to take part in a research study?
We are inviting you to participate in a research study. The study involves completing an online consumer survey to test draft messages and graphics to describe some of the information that officials may want to share with the public after a radiation emergency. Oak Ridge Associated Universities (ORAU) is conducting this project on behalf of the Centers for Disease Control and Prevention’s National Center for Environmental Health, Emergency Management, Radiation, and Chemical Branch.
What should I know about a research study?
Whether or not you take part is up to you.
You can choose not to take part.
You can agree to take part and later change your mind.
Your decision will not be held against you.
You can ask all the questions you want before you decide.
Why is this research being done?
Many people are concerned about their risk of developing cancer from radiation emergency. Radiation can damage the DNA in cells and increase the likelihood of cancer. The amount of radiation, called the dose, is the most important factor in determining increased risk. The Centers for Disease Control and Prevention (CDC) Emergency Management, Radiation, and Chemical Branch (EMRCB) developed draft messages and graphics to describe some of the information that officials may want to share with the public after a radiation emergency.
The EMRCB provides basic information on radiation and its health effects as well as emergency instructions for individuals and families. To help ensure the quality of these messages and graphics, CDC wishes to test them with the public to gather information to ensure they are clear, useful, and will help the public understand their health risks in the event of emergency. Oak Ridge Associated Universities (ORAU) is to provide technical assistance.
How long will the research last and what will I need to do?
We expect that you will be in this research study for 15 minutes answering an online survey and the data from the survey will be kept for up to 3 years.
You will be asked to complete an online survey to help CDC ensure the messages and graphics are clear, useful, and will help the public understand their health risks in the event of emergency.
More detailed information about the study procedures can be found under “What happens if I say yes, I want to be in this research?”
Is there any way being in this study could be bad for me?
There are no known risks for participation in this research study. You may skip any item(s) that you do not want to answer in the questionnaire. All information you provide will be treated as confidential.
Will being in this study help me in any way?
There are no benefits to you from your taking part in this research. We cannot promise any benefits to others from your taking part in this research. However, possible benefits to others include increased preparedness for communication with the public during a radiation emergency.
What happens if I do not want to be in this research?
Participation in research is completely voluntary. You can decide to participate or not to participate.
Your alternative to participating in this research study is to not participate.
DETAILED INFORMATION: The following is more detailed information about this study in addition to the information listed above.
Who can I talk to?
If you have questions, concerns, complaints, or think the research has hurt you, talk to Emergency Management, Radiation, and Chemical Branch (770) 488-3800 or rsb@cdc.gov at the Centers for Disease Control and Prevention, Atlanta, Georgia. Also visit the website at http://emergency.cdc.gov/radiation.
This research has been reviewed and approved by the ORSIRB. You may talk to them at (865) 574-4359 or ORSIRB@orau.org, if:
Your questions, concerns, or complaints are not being answered by the research team.
You cannot reach the research team.
You want to talk to someone besides the research team.
You have questions about your rights as a research subject.
You want to get information or provide input about this research.
Or for any reason you wish to talk to the ORSIRB.
If you want to know more about the DOE program, visit the DOE Human Subjects Protection Program website at https://science.osti.gov/ber/human-subjects.
How many people will be studied?
We expect about 600 people will complete the online survey.
What happens if I say yes, I want to be in this research?
You will complete a 15 minute online survey. The beginning of the survey will include questions asking about personal information (e.g., age, education) and the rest of the survey will ask questions about two messages and graphics to see if they are easy to understand, you think the information is believable, and attention-getting.
What are my responsibilities if I take part in this research?
If
you take part in this research, you will be responsible to complete a
15 minute online survey.
What happens if I say yes, but I change my mind later?
You can leave the research at any time it will not be held against you. If you choose, you may request that the data collected about you to date be removed.
If you decide to leave the research, contact Schlesinger so that they can delete your information from the database. You will not be asked any questions regarding your withdrawal.
What happens to the information collected for the research?
Schlesinger Group will be required not to provide personal identifiers to ORAU or CDC.
Every effort will be made to protect the data and to limit the use and disclosure of your personal information, including research study records, to the research team and others who have a need to review this information. Other organizations that may access information from this study include the IRB. ORAU and CDC will retain records for three years, then burn, delete, shred, or otherwise destroy them.
Your information or samples that are collected as part of this research will not be used or distributed for future research studies, even if all of your identifiers are removed.
What else do I need to know?
This research is being funded by The Centers for Disease Control and Prevention.
If you agree to take part in this research study, we will pay you $2 for your time and effort.
Do you agree to participate in this survey?
○ Yes, I agree to participate in this survey.
○ No, I do not agree to participate in this survey. [TERMINATE]
Demographics
In which of the following categories does your age fall? [SOFT PROMPT] (A.2a)
01 under 18 years of age [THANK AND TERMINATE]
02 18-24 years of age
03 25-34 years of age
04 35-44 years of age
05 45-54 years of age
06 55-64 years of age
07 65+ years of age
Do you, or does any member of your household or immediate family work (B.1.b):
For a market research company
For an advertising agency or public relations firm
In the media (TV/radio/newspapers/magazines)
As a healthcare professional (doctor, nurse, pharmacist, dietician, etc.)
An employee for any of the following:
• Employee of U.S. Department of Health and Human Services
• Employee of state or local health department
• Employee of Department of Homeland Security
• Employee of state or local emergency management agency
• Nuclear power plant employee, Radiation Safety Officer, health physicist or other radiation-related occupation
[IF YES TO ANY, THANK AND TERMINATE]
Ethnicity:
01 Hispanic or Latino
02 Not Hispanic or Latino
Do you consider yourself: [MARK ALL THAT APPLY] [SOFT PROMPT ONLY IF NO RESPONSES ARE PICKED]
Race:
03 American Indian or Alaska Native
04 Asian
05 Black or African American
06 Native Hawaiian or Other Pacific Islander
07 White
[NOTE: REPRESENTATIVE OF THE U.S. POPULATION]
In which state do you currently live? [SOFT PROMPT] (A.8a)
[DROP DOWN]
[NOTE: REPRESENTATIVE OF BY CENSUS REGION]
What is your sex? (A.2.a)
Male [RECRUIT 50%]
Female [RECRUIT 50%]
What is the highest level of education you have completed? (A.4.a)
Less than high school graduate/some high school [THANK AND TERMINATE]
High school graduate or completed GED
Some college or technical school
Received four-year college degree
Some post graduate studies
Received advanced degree
[RECRUIT A MIX]
What is your marital status? [SOFT PROMPT] (A.12.a)
Married
Divorced
Widowed
Separated
Never been married
Other
How many children ages 18 or under are currently living in your household? [SOFT PROMPT] (A.14.a)
ENTER NUMBER __________
Message Testing
Introduction
Please keep in mind that in this survey, when we mention “radiation,” we mean the type of radiation that may be released from a nuclear power reactor or a nuclear explosion, which is similar to the type of radiation we get from CT or x-ray examinations. Here, we do not mean the type of radiation from mobile devices, power lines, or microwaves.
Radiation can harm your health. The amount of radiation you are exposed to, called the dose, determines how much your body is harmed. Radiation dose is measured in units of milli-sieverts (shown as mSv). At high doses (about 2,000 mSv and higher), radiation can cause sickness and death. At low to moderate doses (less than 1,000 mSv), people will not die from the exposure, but could have an increased lifetime risk of cancer. At doses lower than 100 mSv, the added risk of cancer from the low dose of radiation is too small to be measured, but scientists assume that there is still some risk of cancer later in life.
We cannot distinguish with medical tests whether a cancer is caused by radiation or some other cause. We refer to cancers we might get during the course of our lives from common risk factors (such as family history, age, diet, or chemicals) as our baseline rate of cancer. We will be talking today about how to explain the estimated additional risk of cancer from low doses of radiation (100 mSv or less).
The following draft messages and graphics suggest some ways to describe this additional risk of cancer from a hypothetical exposure to low doses of radiation. We would like your help in reviewing these messages and graphics and providing feedback on whether the information is clear, useful, and will help you understand your health risks in the event of large -scale radiation exposures. Please read each message or review each graphic image and answer the questions after it.
Message 1
People in the United States have about a 40% chance of developing cancer over their lifetime because of genetics, various environmental exposures, and health habits. This means that by the time people reach old age, about 40 people out of 100 will have developed (but not necessarily died from) some type of cancer. It also means that about 60 people out of 100 will not develop some type of cancer in their lifetime.
This does not mean that each person has this risk—it is an average of all people’s risk, and your individual risk may be higher or lower, depending on your own risk factors.
Let’s say that a large group of people get an extra radiation dose of less than 100 mSv from a radiation emergency or other unexpected exposure. Experts estimate this can increase a person’s lifetime risk of cancer by less than 1%. This means that risk of cancer for this group of people has increased to about 41%. In other words, another 1 person out of 100 may develop cancer over their lifetime from the increased dose of radiation.
Please indicate your level of agreement with each statement below: [RANDOMIZE] [SOFT PROMPT]
ITEM |
STRONGLY DISAGREE |
|
|
|
STRONGLY AGREE |
|
1 |
2 |
3 |
4 |
5 |
|
1 |
2 |
3 |
4 |
5 |
|
1 |
2 |
3 |
4 |
5 |
|
1 |
2 |
3 |
4 |
5 |
|
1 |
2 |
3 |
4 |
5 |
|
1 |
2 |
3 |
4 |
5 |
|
1 |
2 |
3 |
4 |
5 |
How much of the message would you read? (D.37d)
01 I would only read the first sentence.
02 I would only skim it.
03 I would read the whole thing
04 I wouldn’t read any of it.
Is there anything you especially liked about this message? (E.65.e)
Is there anything you would change about this message? (E.66.e)
What other comments would you like to make about this message? (E.63.e)
Version 1 |
Version 2 |
40 out of 100 people will likely get cancer in their lifetime.
|
60 out of 100 people are not likely to get cancer in their lifetime. |
Which version of this message do you prefer? [SOFT PROMPT]
01 Version 1
02 Version 2
Version 1 |
Version 2 |
1 out of 100 people exposed may get cancer in their lifetime because of additional radiation dose. |
99 out of 100 people exposed are not likely to get cancer in their lifetime because of additional radiation dose. |
If you were among the large group of people exposed to an extra radiation dose, which version of this message do you prefer? [SOFT PROMPT]
01 Version 1
02 Version 2
Please indicate your level of agreement with each statement below: [SOFT PROMPT]
ITEM |
STRONGLY DISAGREE |
|
|
|
STRONGLY AGREE |
|
1 |
2 |
3 |
4 |
5 |
Message 2
|
||||
1 |
2 |
3 |
4 |
5 |
Always prefer percentages |
Sometimes prefer percentages |
Equally prefer percentages and words |
Sometimes prefer words |
Always prefer words |
When scientists talk about risk, they mean the probability or chance that something may or may not happen. Scientists may use certain words or phrases like the ones below to help describe the probability of increased cancer risk from a low to moderate radiation exposure.
Description |
Probability |
Virtually certain |
Greater than 99% |
Very Likely |
Greater than 90% |
Likely |
Greater than 66% |
As likely as not |
33%-66% |
Unlikely |
Less than 33% |
Very unlikely |
Less than 10% |
Exceptionally unlikely |
less than 1% |
Please indicate your level of agreement with each statement below: [RANDOMIZE] [SOFT PROMPT]
ITEM |
STRONGLY DISAGREE |
|
|
|
STRONGLY AGREE |
|
1 |
2 |
3 |
4 |
5 |
|
1 |
2 |
3 |
4 |
5 |
|
1 |
2 |
3 |
4 |
5 |
|
1 |
2 |
3 |
4 |
5 |
|
1 |
2 |
3 |
4 |
|
|
1 |
2 |
3 |
4 |
5 |
|
1 |
2 |
3 |
4 |
5 |
Is there anything you would change about these descriptions or the probabilities associated with them? (E.66.e)
|
||||
1 |
2 |
3 |
4 |
5 |
Always prefer percentages |
Sometimes prefer percentages |
Equally prefer percentages and words |
Sometimes prefer words |
Always prefer words |
GRAPHS
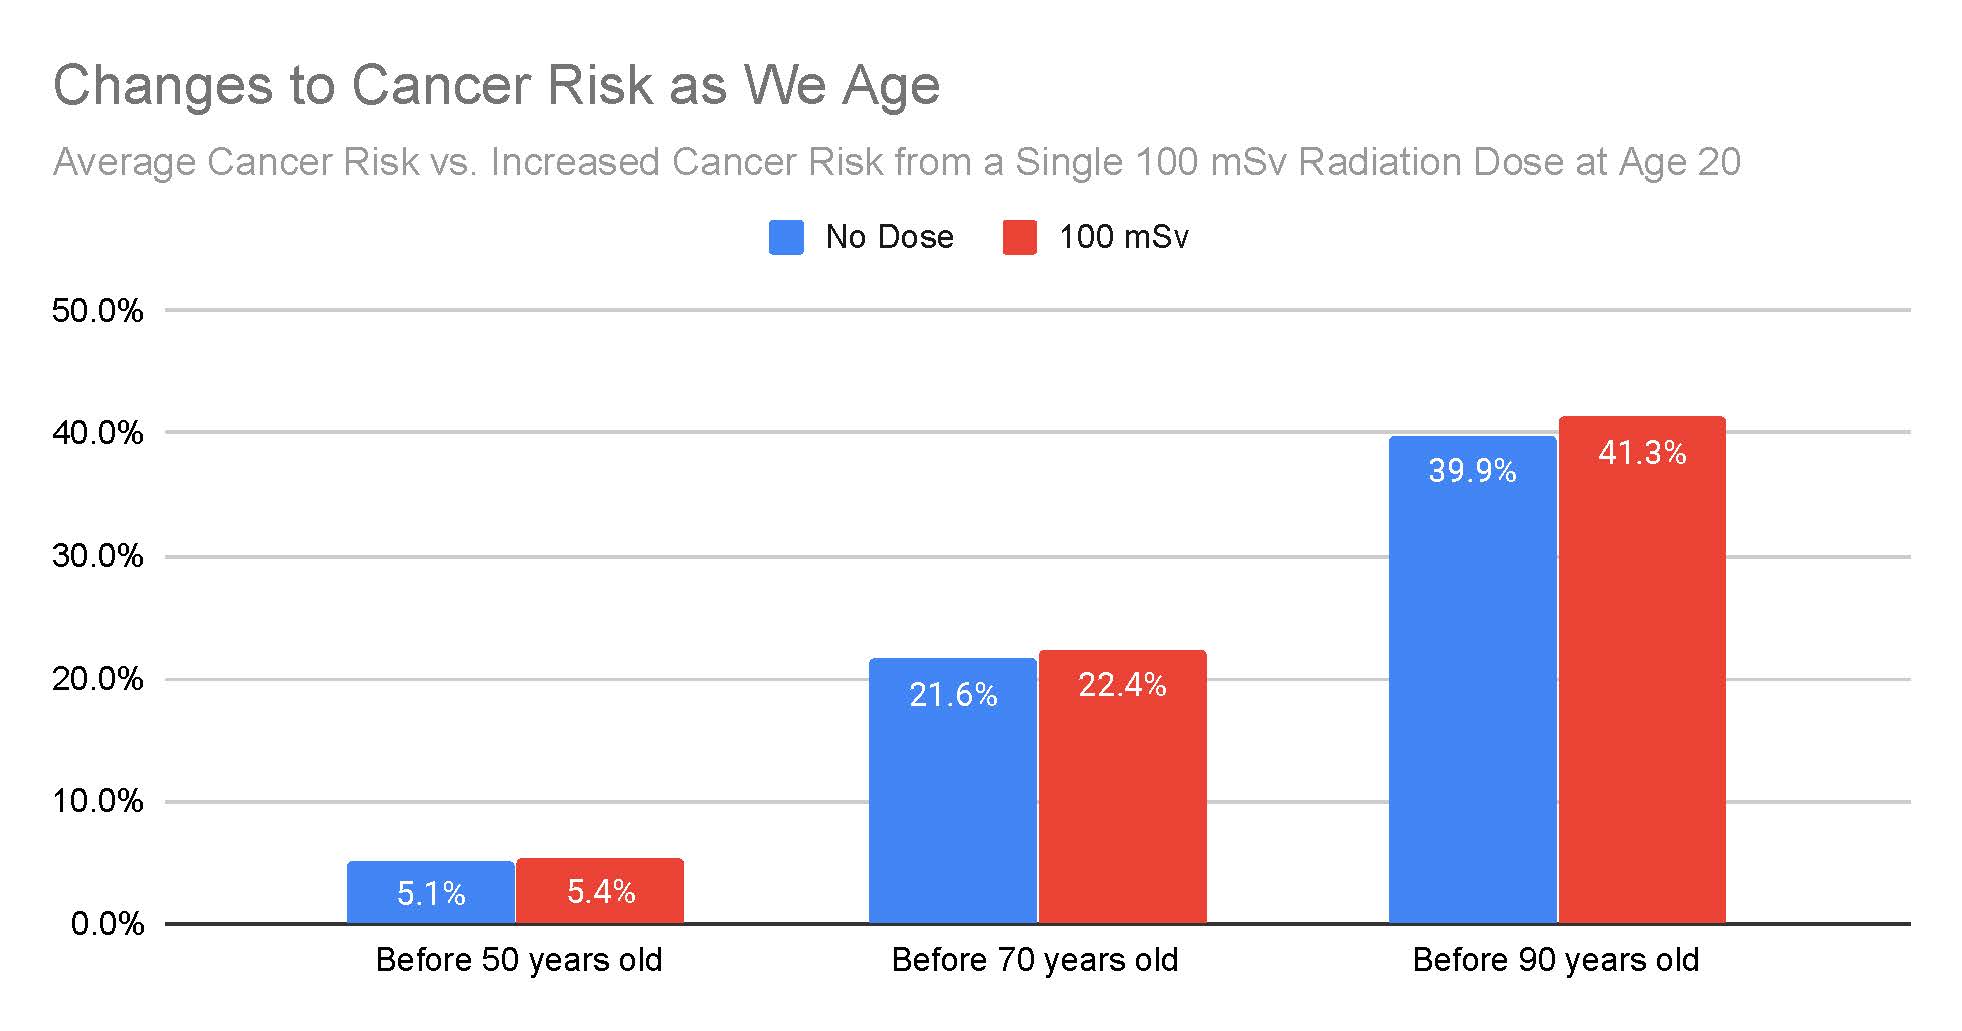
BAR GRAPH [RANDOMIZE] [SOFT PROMPT]

Please use the bar chart above to answer the following questions:
A person’s baseline cancer risk (cancer risk from common factors such as family history, age, diet, or chemicals) before the age of 70 is:
39.9%
5.1%
21.6%
22.4%
If exposed to a 100 mSv dose of radiation at the age of 20, a person’s total cancer risk before age 70 is:
5.4%
22.4%
41.3%
21.6%
What is the increased risk of developing cancer before the age of 70 years old from a 100 mSv dose of radiation?
None
About 1%
About 5%
More than 10%
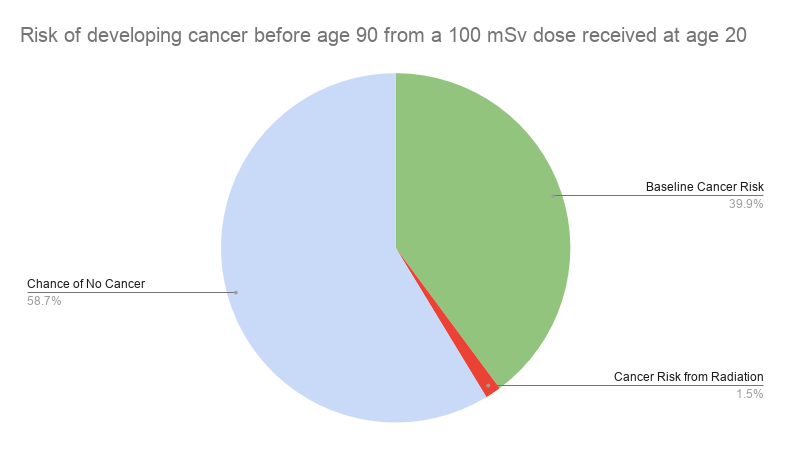
PIE CHART [RANDOMIZE] [SOFT PROMPT]

Please use the pie chart above to answer the following questions:
A person’s baseline cancer risk (no radiation dose) before the age of 90 is:
39.9%
1.5%
58.7%
21.6%
If exposed to a 100 mSv dose of radiation at the age of 20, a person’s total cancer risk before age 90 is:
39.9%
58.7%
41.4%
1.5%
What is the increased risk of developing cancer before the age of 90 years old from a 100 mSv dose of radiation?
Less than 2%
Approximately 3%
Approximately 5%
Greater than 5%
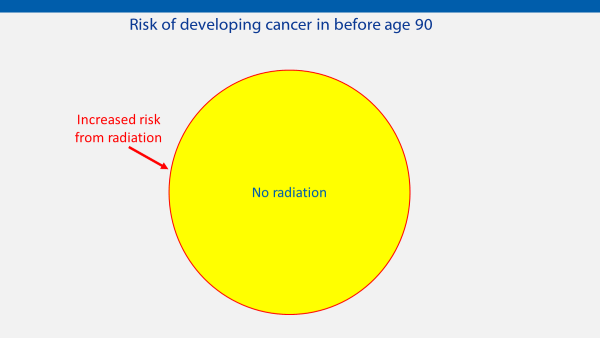
Circle Graph [RANDOMIZE] [SOFT PROMPT]

Please use the circle graph above to answer the following questions (using the information described earlier that baseline cancer rates are about 40% and a dose of 100 mSv of radiation would increase that rate by about 1%):
A person’s baseline cancer risk (from common factors such as family history, age, diet, or chemicals) before the age of 90 is shown in:
Yellow
Red
If exposed to radiation, the increased risk of cancer because of radiation is shown in:
Yellow
Red
If exposed to radiation, the total cancer risk for that person is shown in:
Yellow
Red
Yellow plus red
Neither
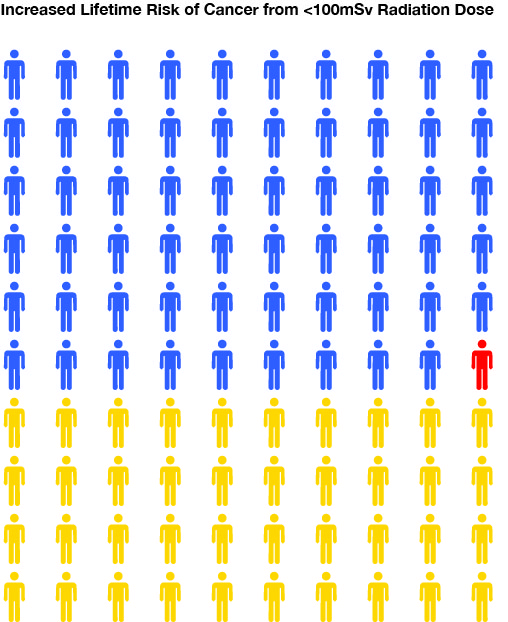
PICTOGRAM [RANDOMIZE] [SOFT PROMPT]

Please use pictogram above to answer the following questions (using the information described earlier that baseline cancer rates are about 40% and a dose of 100 mSv of radiation would increase that rate by about 1%):
The people [or person] who will develop some type of cancer in their lifetime because of genetics, various environmental exposures, and health habits are shown in:
Blue
Red
Yellow
The people [or person] who will not develop some type of cancer in their lifetime are shown in:
Blue
Red
Yellow
The people [or person] who may develop cancer over their lifetime before age 90 because of the extra radiation dose (less than 100 mSv) are shown in:
OVERALL
Please think about the bar graph, circle graph and pictogram above to answer the following questions:
Which graph most clearly showed baseline cancer risk?
Bar Graph
Pie Chart
Circle Graph
Pictogram
None of the above
Which graph most clearly showed increased cancer risk after radiation exposure?
Bar Graph
Pie Chart
Circle Graph
Pictogram
None of the above
Rank the following graphs in order of: easiest to understand (1) to hardest to understand (4).
Bar Graph
Pie Chart
Circle Graph
Pictogram
Please indicate your level of agreement with each statement below: [RANDOMIZE] [SOFT PROMPT]
ITEM |
STRONGLY DISAGREE |
|
|
|
STRONGLY AGREE |
|
1 |
2 |
3 |
4 |
5 |
|
1 |
2 |
3 |
4 |
5 |
|
1 |
2 |
3 |
4 |
5 |
|
1 |
2 |
3 |
4 |
5 |
Thank you for your participation.
CDC estimates the average public reporting burden for this collection of information as 15 minutes per response, including the time for reviewing instructions, searching existing data/information sources, gathering and maintaining the data/information needed, and completing and reviewing the collection of information. An agency may not conduct or sponsor, and a person is not required to respond to a collection of information unless it displays a currently valid OMB Control Number. Send comments regarding this burden estimate or any other aspect of this collection of information, including suggestions for reducing this burden to CDC/ATSDR Information Collection Review Office, 1600 Clifton Road NE, MS D-74, Atlanta, Georgia 30333; ATTN: PRA (0920-0572).
| File Type | application/vnd.openxmlformats-officedocument.wordprocessingml.document |
| Author | Karen Carera |
| File Modified | 0000-00-00 |
| File Created | 2021-01-14 |
© 2026 OMB.report | Privacy Policy