Attachment F - Nonresponse Bias Analysis 2017
Attachment F -- Nonresponse Bias Analysis 2017.docx
Telephone Point of Purchase Survey
Attachment F - Nonresponse Bias Analysis 2017
OMB: 1220-0044

Telephone Point of Purchase Survey
2017 Nonresponse Bias Analysis
Greg Barbieri
July 28th, 2017
Introduction
The Telephone Point of Purchase Survey (TPOPS) is a random digit dialed (RDD) computer-assisted-telephone-interview (CATI) survey that collects expenditure information from households, including grocery stores, retailers, service providers, and shops where purchases are made. The survey is used exclusively by the U.S. Bureau of Labor Statistics (BLS) as the primary source of the retail establishment sampling frame for the Commodities and Services (C&S) Pricing Survey. A sample of the retail establishments (hereafter, outlets) reported in TPOPS is selected for participation in C&S, and prices of select consumer goods and services at these outlets are monitored for use in calculating the U.S. Consumer Price Index (CPI). The TPOPS is a rotating panel survey with each household participating over eight consecutive quarters. The TPOPS is conducted by the Census Bureau for the Bureau of Labor Statistics (BLS).
TPOPS response rates are examined in Section II below. Section III compares demographics reported in TPOPS against the Census Bureau’s American Community Survey (ACS). In Section IV, outlet frame characteristics are compared and contrasted for various cohorts of the total TPOPS sample.
TPOPS Response Rates
Figure 1 and Figure 2, show the TPOPS response rates and collection results from the 4rd quarter in 2006 to the 1st quarter in 2017. Detailed results are in Appendices A and B. Response rates are calculated according to OMB’s Standards and Guidelines for Statistical Surveys definition of an unweighted unit response rate (RRU):

Where,
C = Number of completed interviews or sufficient partially completed interviews
R = Number of Refusals
NC = Number of non-contacted sample units know to be eligible
O = Number of eligible sample units not responding for reasons other than refusal
e = Estimated proportion of sample units of unknown eligibility (U) that are eligible. Currently set to 0.27 for both sample frames.
U = Number of sample units of unknown eligibility, not completed
Unless stated otherwise, response rates other than collection results are based on the final disposition codes recommended by The American Association for Public Opinion Research (AAPOR) and adopted by the TPOPS in the fourth quarter of 2006. This differs from previous work on nonresponse bias by Arcos and Bergmann (2013) and Falwell and Saxton (2009), which used the precursor to AAPOR’s final disposition codes to categorize interview outcomes for TPOPS response rate calculations.
CPI is in the middle of transitioning to a new geography based on the 2010 Census. The methodology used to phase-in new PSUs adds substantial noise to the response rate and other collection results in TPOPS. To reduce the noise caused by the new geography, response rates and collection results from new PSUs are not included in this analysis.
Response Rates
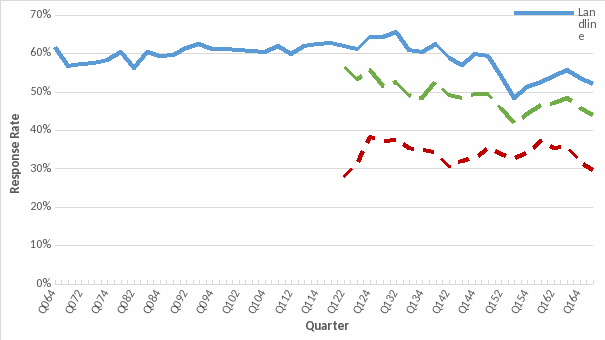
Figure 1 shows TPOPS response rate by frame. From 2006 until the initiation of the cell phone frame in the second quarter of 2012, TPOPS response rates held steady at about 60%. Overall TPOPS response rates fell by 9 percent or about 5 percentage points when the cell phone frame was first included. This is due to the lower response rates in the cell phone frame, which average about 60 percent of landline response rates. Overall response rates have continued to decline since 2012 and are at 44 percent as of the first quarter of 2017 (landline and cell phone response rates at 52 and 30 percent, respectively). Tabulated response rates can be found in Appendix A.
Figure 1: Response Rates by Frame (Q064 – Q171)
Collection Results
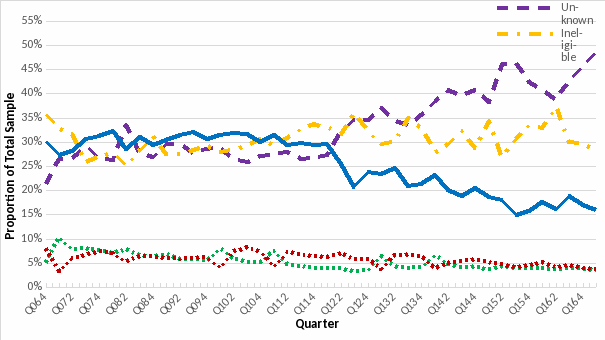
Figure 2 summarizes TPOPS collection rates for the survey overall, while Appendix B tabulates collection results by frame. Non-contacts and refusals are the smallest proportion of outcomes, both holding at 4% as of the first quarter of 2017. Ineligible cases are about 30% of outcomes in TPOPS, although this rate is more variable since the initiation of the cell phone frame. Historically, cases with unknown eligibility were much closer, with interviews being slightly higher than the proportion with unknown eligibility. Since the second quarter of 2012, the two proportions have diverged significantly. Interviews began falling and as of the first quarter of 2017 are about 16 percent of the total sample. Cases with unknown eligibility have grown to almost 50 percent of the total sample.
Figure 2: Collection Results by Outcome
The TPOPS suffers from high nonresponse in both frames, however low response rates are not uncommon for RDD surveys. Low response rates do not necessarily indicate high nonresponse bias since respondents may be representative of the target population. In the next section we examine the demographics of TPOPS respondents to judge how closely they represent our target population.
Demographic Comparisons to ACS
A comparison of TPOPS demographic data to the Census Bureau’s American Community Survey’s (ACS) demographic data is necessary to analyze potential non-response bias in TPOPS. The American Community Survey, an extension of the Decennial Census, is widely considered the most accurate estimate of the actual composition of the population, due to its breadth and extremely high response rate (96%).1
TPOPS collects limited demographic data from the respondent, allowing only some demographic comparisons to ACS estimates. The TPOPS demographic data are limited to the respondent, and not the other members of the household. The TPOPS respondents’ demographics are compared against the demographic data of ACS householders, using 3-year estimates for the same geographic scope as the TPOPS. The TPOPS data below are weighted using a variety of adjustment factors to calibrate each sampled unit, but does not calibrate to known demographic cohort totals.2 The observed weighted number of households in each demographic category are then compared to the expected number of households from ACS percentages.
Previous nonresponse bias analyses in 2009 and 2013 showed TPOPS struggled to reach certain demographic groups. The earlier work found that TPOPS systematically underrepresented households with respondents under 35 years old and the African American, Asian, and multiracial cohorts. In an effort to mitigate the underrepresentation of those under 35, TPOPS began contacting cell phones in the second quarter of 2012. Since the initiation of the cell phone frame, TPOPS respondents who reported completing the interview on a cell phone are, on average, 1.9 times more likely to be under 35 years old than a landline respondent, and 1.3 , 1.5, and 1.3 times more likely to identify as Black, Asian, and multiracial, respectively. A chart showing a four-quarter rolling average of the likeliness of cell phone respondents to identify in the historically underrepresented cohorts, relative to the landline frame, is presented in Figure 3. As of the first quarter in 2017, a cell phone respondent is over 2.5 times more likely to reporting being under 35 years old relative to the landline frame.
Figure 3: Likeliness of cell phone respondent to be a member of underrepresented cohorts
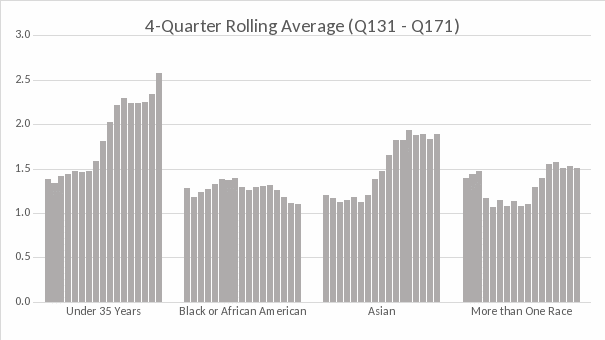
Table 1 and Table 2 show the comparison between TPOPS and ACS population estimates. Despite the improvement in reaching underrepresented cohorts using the cell phone frame and the visual similarities in ACS and TPOPS distributions shown on Tables 1 and 2, TPOPS continues to produce age and racial distributions that are statistically different from the ACS estimates. Using a chi-square goodness of fit test to compare the entire age or race distributions in TPOPS to the expected estimates from ACS shows that distributions in TPOPS are statistically significantly different than the ACS estimates, below an alpha of below 0.001. That is to say, there is less than a 0.1% chance that the distributions are equal.
Table 1—Race and Origin of Householder (Percentage)
|
2012 |
2013 |
2014 |
2015 |
||||
Race of Householder |
ACS |
TPOPS |
ACS |
TPOPS |
ACS |
TPOPS |
ACS |
TPOPS |
White alone |
78.1% |
79.0% |
78.0% |
77.9% |
77.8% |
78.5% |
77.5% |
77.9% |
Black or African American alone |
12.0% |
9.5% |
12.0% |
9.7% |
12.1% |
10.7% |
12.1% |
10.9% |
American Indian and Alaska Native alone |
0.7% |
0.5% |
0.7% |
0.6% |
0.7% |
0.8% |
0.7% |
0.8% |
Asian alone |
4.0% |
4.5% |
4.1% |
4.8% |
4.2% |
4.0% |
4.3% |
4.1% |
Native Hawaiian and Other Pacific Islander alone |
0.1% |
0.3% |
0.1% |
0.3% |
0.1% |
0.3% |
0.1% |
0.3% |
Other race alone |
3.4% |
4.6% |
3.3% |
4.9% |
3.3% |
3.8% |
3.4% |
3.7% |
Two or more races |
1.6% |
1.7% |
1.7% |
1.8% |
1.8% |
1.9% |
1.8% |
2.2% |
|
|
|
|
|
|
|
|
|
Origin of Household |
|
|
|
|
|
|
|
|
Not Hispanic or Latino |
85.8% |
90.4% |
85.5% |
89.8% |
85.2% |
90.0% |
84.9% |
90.2% |
Hispanic or Latino Origin |
14.2% |
9.6% |
14.5% |
10.2% |
14.8% |
10.0% |
15.1% |
9.8% |
Table 2—Age of Householder (Percentage)
|
2012 |
2013 |
2014 |
2015 |
||||
Age of Householder |
ACS |
TPOPS |
ACS |
TPOPS |
ACS |
TPOPS |
ACS |
TPOPS |
Under 35 years |
20.0% |
14.8% |
19.7% |
13.9% |
19.4% |
11.6% |
19.3% |
14.6% |
35 to 44 years |
18.6% |
14.2% |
18.3% |
14.4% |
18.0% |
13.1% |
17.8% |
11.5% |
45 to 54 years |
21.3% |
19.5% |
21.1% |
21.0% |
20.8% |
18.9% |
20.4% |
15.5% |
55 to 64 years |
18.3% |
22.7% |
18.7% |
23.6% |
19.0% |
23.1% |
19.2% |
22.7% |
65 to 74 years |
11.6% |
17.3% |
12.0% |
16.8% |
12.5% |
19.6% |
13.0% |
20.6% |
75 to 84 years |
7.3% |
8.5% |
7.3% |
7.8% |
7.3% |
10.8% |
7.3% |
11.1% |
85 years and over |
2.9% |
2.9% |
3.0% |
2.5% |
3.1% |
3.0% |
3.1% |
4.0% |
In summary, the differences between the ACS and TPOPS samples are statistically significant for race and age, for all years between 2012 and 2015. Age cohorts are systematically different from ACS estimates; the cohorts under 55 are underrepresented and cohorts over 55 are overrepresented. Race cohorts appear to be less systematically different than age cohorts in TPOPS. Only the Black or African American cohort is systematically underrepresented in TPOPS compared to ACS. A survey can suffer from nonresponse bias if its respondents are not representative of the target population. However, it should be noted that unless demographic cohorts differ in their selection of outlets or expenditure behavior, misrepresentation does not necessarily result in a biased outlet sampling frame for the CPI.
Outlet Frame Comparisons between Demographic Groups
This section evaluates whether the coverage issues outlined in the previous section produce an outlet bias in the survey. The types of outlets reported and reported expenditures are compared to analyze whether survey results could be biased due to the misrepresentation of race and age cohorts.
Outlet type
Respondents report how they obtained the good or service: via personal visit, internet, mail or telephone, or other methods that are ineligible for inclusion in the CPI (yard sales, private individual, foreign outlets, etc.).
Figure 4 shows the distribution of reported purchase methods by age cohort. The values are an average from the third quarter of 2005 to the first quarter of 2017. If there were no differences in how the consumers shopped, proportions of goods and services obtained through different sources should be equal across age cohorts; however, the type of outlets reported by age cohort are systematically different. Comparing any two age cohorts, the younger cohort is more likely, on average, to report purchasing goods and services using the internet than an older cohorts. The reverse order holds for obtaining goods and services by mail or telephone and at stores ineligible for the CPI.
Figure 4. Distribution of Outlet Type by Age Cohorts
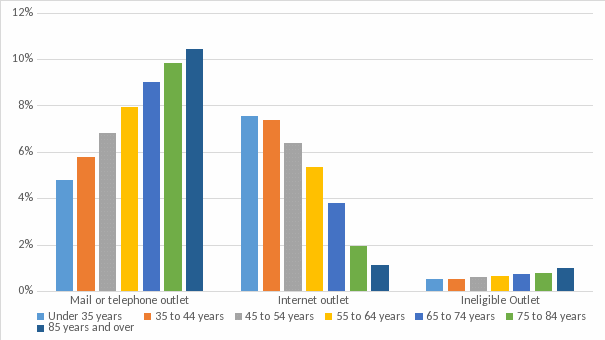
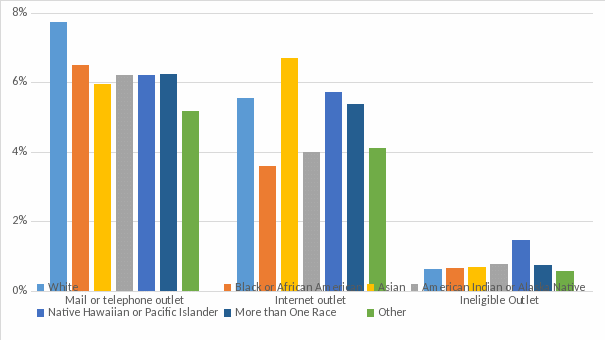
Figure 5 shows the differences in race cohorts for each outlet type. The largest amount of heterogeneity in purchase methods between race cohorts is in the reporting of internet outlets. Respondents identifying as Asian, White, Native Hawaiian or Pacific Islander, or more than once race, on average, report purchasing through the internet at a higher rate than Black, American Indian or Alaska Native, and other cohorts. The results of Figure 5 suggest the Asian cohort is about twice as likely, on average, to report purchasing through the internet as those identifying as Black or African American, who report the least.
Figure 5. Outlet Type between Race Cohorts
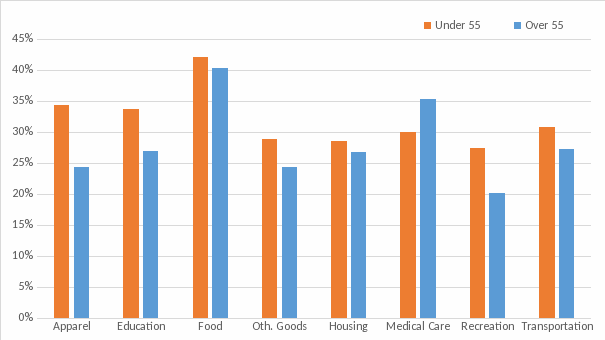
A portion of the differences between purchase modes across age and racial cohorts could be explained by differences in their market baskets, as represented by item reporting rates. For example, items predominantly available online with higher reporting rates by younger cohorts, such as prerecorded audio or video, would explain why younger cohorts report a higher percentage of internet outlets.
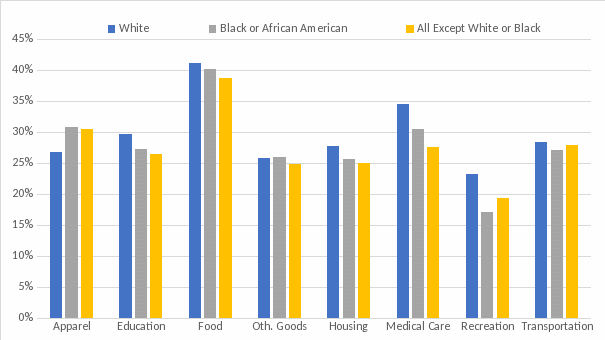
Figure 6 summarizes variation in item reporting rates by CPI major group. White respondents have higher item reporting rates in 6 out of 8 major groups, most notably Medical Care and Recreation. All three race cohorts report outlets at about the same rate for the group Other Goods and Services, but the Black and Other cohorts report more frequently an outlet in the Apparel major group. To test the robustness of age and race cohorts to determine outlet type, logistic regressions were performed by CPI major group.
Figure 6: Item Reporting Rate by CPI Major Group
To test whether the differences between cohorts and the reported outlet type is significant, a logistic regression was used to model the effect age and race cohorts have on predicting an outlet type. Tables 3 and 4 show the results of logistic regressions using age and racial cohorts as a predictor for outlet type by CPI major group. The coefficients for each age and race cohort correspond to the log of the likelihood of reporting the modeled outlet type. Larger estimates imply that a cohort is more likely to report the modeled outlet type, and vice versa for smaller estimates. The comparisons discussed below only focus on the models for predicting the report of an internet outlet, but models for predicting payments made by mail or telephone or those ineligible for the CPI are tabulated for all demographic cohorts on Appendix C and D.
In Table 3, the Apparel, Housing, Other Goods and Services, Recreation, and Transportation major groups show coefficients that trend downward as the age cohort increases. In other words, 5 out of 8 CPI major groups suggest a trend similar to that in Figure 5 where older cohorts are less likely to purchase using the internet, with all age cohorts statistically significant at the 10 percent significance level. For the Education and Communication, and Food major groups, the results show the same trend, but at least one of the cohorts in each major group is not statistically different from zero at the 10 percent significance level. The Medical major group shows little evidence that an internet outlet can be predicted from age, but this category includes medical service categories which may be irrelevant to this analysis.
Table 4 shows that historically underrepresented cohorts such as the Black and Asian cohorts, are systematically different in their likeliness of reporting an internet outlet by CPI major group. In CPI major groups excluding Medical Care, as represented by the coefficient estimates, the Asian and White cohorts contribute positively to the probability of reporting an internet outlet, while reports from the Black cohort decreases the probability.
Table 3—Results of Logit Model Predicting Internet Outlet: Age Cohorts by CPI Major Group
Age Cohorts |
Apparel |
Education and Communication |
Food |
Other Goods and Services |
Housing |
Medical Care |
Recreation |
Transportation |
Under 35 Years |
0.244*** (0.0318) |
0.362*** (0.0258) |
0.631*** (0.0717) |
0.711*** (0.0457) |
0.429*** (0.0289) |
0.087 (0.1412) |
0.368*** (0.0215) |
0.418*** (0.0405) |
35 to 44 Years |
0.292*** (0.0286) |
0.251*** (0.0233) |
0.527*** (0.0638) |
0.458*** (0.0437) |
0.469*** (0.0261) |
0.02 (0.1105) |
0.31*** (0.0191) |
0.353*** (0.0362) |
45 to 54 Years |
0.242*** (0.0277) |
0.203*** (0.0219) |
0.252*** (0.0624) |
0.324*** (0.0422) |
0.388*** (0.025) |
0.14 (0.0934) |
0.25*** (0.0186) |
0.369*** (0.0335) |
55 to 64 Years |
0.28*** (0.0281) |
0.173*** (0.0227) |
0.046 (0.0654) |
0.273*** (0.0427) |
0.348*** (0.0251) |
0.397*** (0.086) |
0.233*** (0.019) |
0.394*** (0.0335) |
65 to 74 Years |
0.178*** (0.0315) |
-0.032 (0.0267) |
-0.118 (0.0745) |
0.084* (0.0483) |
0.117*** (0.028) |
0.251*** (0.0969) |
0.08*** (0.0216) |
0.113*** (0.0379) |
75 to 84 Years |
-0.479*** (0.052) |
-0.41*** (0.0406) |
0.332*** (0.0997) |
-0.681*** (0.0794) |
-0.519*** (0.0429) |
-0.087 (0.1301) |
-0.433*** (0.034) |
-0.63*** (0.0614) |
Intercept |
-3.088*** (0.0235) |
-3.088*** (0.0235) |
-3.088*** (0.0235) |
-3.088*** (0.0235) |
-3.088*** (0.0235) |
-3.088*** (0.0235) |
-3.088*** (0.0235) |
-3.088*** (0.0235) |
*** represents significance at the 1 percent level.
Table 4—Results of Logit Model Predicting Internet Outlet: Racial Cohorts by CPI Major Group
Race Cohorts |
Apparel |
Education and Communication |
Food |
Other Goods and Services |
Housing |
Medical Care |
Recreation |
Transportation |
White |
0.347*** (0.0357) |
0.063** (0.0267) |
0.246*** (0.0947) |
0.048 (0.0473) |
0.181*** (0.0291) |
0.255 (0.1896) |
0.131*** (0.0222) |
0.158*** (0.0433) |
Black or African American |
-0.364*** (0.0495) |
-0.222*** (0.0369) |
-0.602*** (0.1416) |
-0.304*** (0.0649) |
-0.277*** (0.0403) |
-0.488* (0.2544) |
-0.227*** (0.0321) |
-0.157*** (0.0576) |
American Indian and Alaska Native |
-0.274** (0.13) |
-0.039 (0.0878) |
-0.367 (0.3574) |
-0.332* (0.1883) |
-0.337*** (0.1055) |
-1.064 (0.8663) |
-0.184** (0.0783) |
-0.295* (0.1562) |
Asian |
0.253*** (0.0545) |
0.406*** (0.0394) |
0.288** (0.1452) |
0.422*** (0.0706) |
0.447*** (0.0438) |
0.563** (0.2502) |
0.357*** (0.0352) |
0.451*** (0.061) |
Native Hawaiian and Other Pacific Islander |
0.044 (0.1393) |
0.013 (0.1075) |
0.195 (0.3576) |
0.321** (0.1601) |
0.149 (0.1111) |
0.182 (0.6281) |
0.12 (0.0849) |
-0.077 (0.1724) |
Other race |
-0.306*** (0.062) |
-0.215*** (0.0461) |
-0.307* (0.1669) |
-0.421*** (0.0881) |
-0.309*** (0.0524) |
0.061 (0.2824) |
-0.219*** (0.0395) |
-0.22*** (0.075) |
Intercept |
-3.088*** (0.0235) |
-3.088*** (0.0235) |
-3.088*** (0.0235) |
-3.088*** (0.0235) |
-3.088*** (0.0235) |
-3.088*** (0.0235) |
-3.088*** (0.0235) |
-3.088*** (0.0235) |
***, **, * represent significance at the 1 percent, 5 percent, 10 percent level.
In summary, Figure 5suggests that underrepresented cohorts such as the under 35 cohort, and Black and Asian racial cohorts are different from compared groups in their likeliness to report certain outlet types. Using a logistic regression to predict outlet type shows the likeliness of the underrepresented cohorts reporting an internet outlet when controlling CPI major group was found to be systematically different from compared groups. If using different purchase methods suggests that the cohorts are experiencing different prices, within or across specific outlets, then misrepresentation of target demographic cohorts caused by nonresponse could lead to a bias in the CPI.
Expenditure Distributions
The TPOPS collects expenditures on POPS categories at an outlet during a reference period. TPOPS expenditures are used as measures of size for sample selection. To assess the spending patterns between demographic characteristics, four separate Wilcoxon rank sum tests were performed on the reported POPS category expenditures, accumulated from the second quarter of 2013 to the first quarter of 2017.
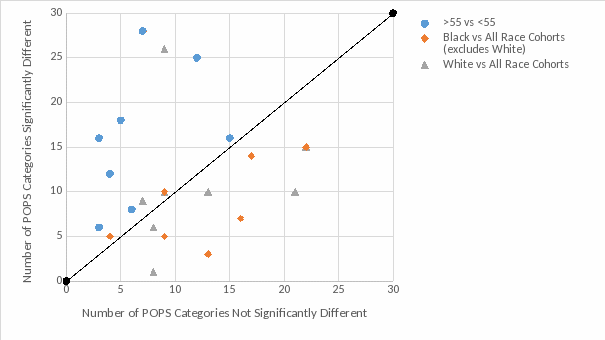
Figure 7 summarizes the number of categories within a major group found to have statistically different expenditures when tested by age and race. The null hypothesis of the Wilcoxon rank sum test is that the compared distributions are similar. Using a significance level of 0.10, the number of POPS categories in the major group that reject the null hypothesis are on the vertical axis, and those that fail to reject the null are on the horizontal axis. Points that fall above the 45-degree line indicate that the majority of the POPS categories that make up the major group were found to be significantly different and vice-versa for those under the 45-degree line.
Expenditure totals are significantly different between over and under 55 age cohorts for a majority of POPS categories in all major groups. Categories found to have a similar distribution of expenditures between age groups include pet services, cable or satellite television, admissions to sporting events, and single copy newspapers or magazines. The major groups with the highest proportion of dissimilar POPS category expenditures are Food and Other Goods and Services, both above 80%.
There are fewer CPI major groups with significant differences in spending for race cohorts, particularly in the Apparel, Transportation, and Medical Care major groups. When comparing the Black racial cohort with all other race cohorts excluding White, only Food, Other Goods and Services, and Medical major groups were found to have the majority of POPS categories, with the Transportation and Apparel major groups have the least number of significantly different POPS categories. Similarly, when comparing the White racial cohort with all other race cohorts, Food, Other Goods and Services, and Transportation major groups were found to have the majority of significantly different POPS categories. Much like previous results on outlet type and POPS category reporting rates, these results indicate there may be different shopping habits in underrepresented groups.
Figure 7: Summary of statistical differences in expenditures by age and race cohorts
Conclusion
TPOPS response rates have declined by an average of 5 percentage points per year for the last five years. Comparisons to ACS population estimates show the TPOPS continues to have a population coverage bias for the younger and non-white portion of the population. As nonresponse increases, its resulting bias also continues to be of concern. While this paper is not an exhaustive study of the impact of coverage bias on outlet frame quality, three quality measures indicate some differences. Data on the types of outlets reported show that population cohorts shop online and buy apparel, education and communication, recreation, and medical care goods and services at different rates. Younger age cohorts and White and Asian racial cohorts tend to be more likely to report an internet outlet when compared to older cohorts or Black and other race cohorts. Any misrepresentation of these groups could bias the CPI outlet sample if price change is different across outlet types. Younger and older cohorts also spend different amounts on most item categories, and coverage biases could result in biased outlet selection probabilities.
Appendix A—TPOPS Response Rate by Frame
-
Quarter
Landline
Cell Phone
Combined
Q064
61.6%
Q071
56.6%
Q072
57.1%
Q073
57.6%
Q074
58.2%
Q081
60.4%
Q082
56.2%
Q083
60.2%
Q084
59.4%
Q091
59.5%
Q092
61.5%
Q093
62.3%
Q094
61.1%
Q101
61.1%
Q102
60.7%
Q103
60.7%
Q104
60.3%
Q111
62.0%
Q112
59.9%
Q113
62.0%
Q114
62.4%
Q121
62.6%
Q122
61.8%
27.9%
56.3%
Q123
61.2%
31.1%
53.2%
Q124
64.2%
38.2%
55.7%
Q141
62.3%
34.3%
52.6%
Q142
58.7%
30.7%
49.1%
Q143
57.0%
32.0%
48.3%
Q144
59.9%
32.7%
49.4%
Q151
59.3%
35.3%
49.4%
Q152
54.0%
33.7%
45.6%
Q153
48.4%
32.7%
41.8%
Q154
51.3%
34.2%
44.2%
Q161
52.6%
37.1%
46.6%
Q162
54.0%
35.4%
47.0%
Q163
55.6%
35.8%
48.5%
Q164
53.6%
31.8%
45.8%
Q171
52.0%
29.5%
44.0%
Appendix B—TPOPS Collection Results by Frame (Percentage)
-
Quarter
Frame
Interview
Non-Contact
Ineligible
Refusal
Unknown
Q064
Landline
30.1%
5.0%
35.7%
8.0%
21.2%
Q071
Landline
27.2%
10.3%
32.7%
3.4%
26.5%
Q072
Landline
28.0%
7.9%
31.5%
6.0%
26.6%
Q073
Landline
30.6%
8.0%
25.7%
6.7%
29.0%
Q074
Landline
31.1%
7.7%
27.1%
7.5%
26.7%
Q081
Landline
32.2%
7.1%
27.6%
7.0%
26.1%
Q082
Landline
28.4%
7.9%
25.0%
5.3%
33.4%
Q083
Landline
31.0%
6.5%
28.3%
6.5%
27.7%
Q084
Landline
29.3%
6.5%
31.1%
6.3%
26.8%
Q091
Landline
30.3%
6.7%
27.5%
5.9%
29.5%
Q092
Landline
31.5%
5.9%
27.4%
5.9%
29.4%
Q093
Landline
32.1%
5.9%
28.3%
6.1%
27.7%
Q094
Landline
30.5%
5.5%
29.3%
6.1%
28.6%
Q101
Landline
31.3%
8.0%
27.8%
4.1%
28.8%
Q102
Landline
31.7%
6.0%
28.5%
7.4%
26.4%
Q103
Landline
31.5%
5.3%
29.2%
8.2%
25.9%
Q104
Landline
29.9%
5.1%
30.6%
7.3%
27.0%
Q111
Landline
31.3%
7.6%
29.4%
4.3%
27.5%
Q112
Landline
29.3%
4.8%
30.8%
7.3%
27.9%
Q113
Landline
29.7%
4.3%
32.8%
6.8%
26.5%
Q114
Landline
29.3%
4.0%
33.6%
6.4%
26.7%
Q121
Landline
29.5%
4.0%
32.9%
6.3%
27.3%
Q122
Cell Phone
8.4%
3.8%
43.9%
8.3%
35.7%
Q122
Combined
25.3%
3.9%
31.6%
7.1%
32.1%
Q122
Landline
30.6%
3.9%
27.8%
6.7%
30.9%
Q123
Cell Phone
9.9%
3.4%
35.4%
6.6%
44.7%
Q123
Combined
20.7%
3.2%
35.9%
5.7%
34.4%
Q123
Landline
25.9%
3.2%
36.1%
5.3%
29.5%
Q124
Cell Phone
14.2%
4.2%
29.3%
6.4%
45.9%
Q124
Combined
23.7%
3.6%
32.3%
5.9%
34.6%
Q124
Landline
29.3%
3.3%
34.0%
5.6%
27.8%
Q141
Cell Phone
13.9%
8.4%
21.9%
4.3%
51.6%
Q141
Combined
23.2%
6.6%
27.9%
3.9%
38.4%
Q141
Landline
28.9%
5.6%
31.5%
3.7%
30.4%
Q142
Cell Phone
11.5%
6.4%
24.0%
5.4%
52.7%
Q142
Combined
20.1%
4.8%
29.5%
5.0%
40.6%
Q142
Landline
25.2%
3.9%
32.7%
4.8%
33.4%
Q143
Cell Phone
11.9%
5.0%
24.4%
6.2%
52.5%
Q143
Combined
18.8%
4.1%
32.2%
5.4%
39.5%
Q143
Landline
22.8%
3.6%
36.7%
5.0%
32.0%
Q144
Cell Phone
12.5%
5.1%
22.3%
6.2%
53.9%
Q144
Combined
20.5%
4.3%
28.7%
5.7%
40.8%
Q144
Landline
26.3%
3.7%
33.3%
5.4%
31.3%
Q151
Cell Phone
13.4%
4.2%
23.1%
5.9%
53.4%
Q151
Combined
18.7%
3.7%
34.3%
5.2%
38.2%
Q151
Landline
22.4%
3.2%
42.1%
4.6%
27.7%
Q152
Cell Phone
14.4%
5.8%
12.6%
5.9%
61.3%
Q152
Combined
18.1%
4.4%
26.9%
4.7%
46.0%
Q152
Landline
20.3%
3.5%
35.7%
4.0%
36.5%
Q153
Cell Phone
13.7%
5.9%
12.7%
5.4%
62.3%
Q153
Combined
14.9%
4.0%
30.6%
4.1%
46.4%
Q153
Landline
15.5%
3.0%
40.5%
3.4%
37.6%
Q154
Cell Phone
14.7%
6.0%
14.2%
6.4%
58.7%
Q154
Combined
15.7%
3.9%
33.5%
4.6%
42.4%
Q154
Landline
16.2%
2.7%
43.7%
3.6%
33.8%
Q161
Cell Phone
16.6%
5.9%
14.5%
7.2%
55.7%
Q161
Combined
17.5%
3.9%
32.8%
5.2%
40.6%
Q161
Landline
17.9%
2.9%
41.6%
4.2%
33.4%
Q162
Cell Phone
13.8%
5.6%
21.9%
5.3%
53.4%
Q162
Combined
16.2%
3.7%
37.3%
4.2%
38.7%
Q162
Landline
17.4%
2.7%
44.9%
3.6%
31.4%
Q163
Cell Phone
15.7%
5.9%
12.3%
5.9%
60.2%
Q163
Combined
18.9%
4.0%
29.9%
4.6%
42.7%
Q163
Landline
20.4%
3.1%
38.3%
3.9%
34.4%
Q164
Cell Phone
13.0%
5.4%
11.8%
5.1%
64.8%
Q164
Combined
17.0%
3.8%
29.6%
4.0%
45.5%
Q164
Landline
18.9%
3.1%
38.3%
3.5%
36.2%
Q171
Cell Phone
11.4%
4.9%
12.2%
4.2%
67.3%
Q171
Combined
15.9%
3.5%
28.3%
3.7%
48.6%
Q171
Landline
18.2%
2.8%
36.4%
3.4%
39.3%
Appendix C—Results of Logistic Regression: Age Cohorts by CPI Major Group
|
Apparel |
Education and Communication |
Food |
||||||
Age Cohorts |
Mail/Tele Outlet (1) |
Internet Outlet (2) |
Ineligible Outlet (3) |
Mail/Tele Outlet (4) |
Internet Outlet (5) |
Ineligible Outlet (6) |
Mail/Tele Outlet (7) |
Internet Outlet (8) |
Ineligible Outlet (9) |
Under 35 Years Cohort |
-1.63*** (0.076) |
0.244*** (0.0318) |
-0.302*** (0.1064) |
-0.407*** (0.0202) |
0.362*** (0.0258) |
-0.353*** (0.0969) |
0.063 (0.0559) |
0.631*** (0.0717) |
-0.535*** (0.0768) |
35 to 44 Years Cohort |
-1.155*** (0.049) |
0.292*** (0.0286) |
-0.17** (0.0854) |
-0.36*** (0.0164) |
0.251*** (0.0233) |
-0.297*** (0.0772) |
-0.018 (0.0463) |
0.527*** (0.0638) |
-0.565*** (0.0608) |
45 to 54 Years Cohort |
-0.484*** (0.0346) |
0.242*** (0.0277) |
-0.113 (0.0785) |
-0.305*** (0.0145) |
0.203*** (0.0219) |
-0.31*** (0.0684) |
-0.009 (0.0404) |
0.252*** (0.0624) |
-0.025 (0.0428) |
55 to 64 Years Cohort |
0 (0.0309) |
0.28*** (0.0281) |
-0.033 (0.0795) |
-0.071*** (0.0147) |
0.173*** (0.0227) |
-0.081 (0.0681) |
-0.019 (0.0406) |
0.046 (0.0654) |
0.053 (0.0418) |
65 to 74 Years Cohort |
0.531*** (0.0309) |
0.178*** (0.0315) |
0.199** (0.0863) |
0.111*** (0.0168) |
-0.032 (0.0267) |
0.118 (0.0767) |
-0.181*** (0.0483) |
-0.118 (0.0745) |
0.113** (0.0458) |
75 to 84 Years Cohort |
1.015*** (0.0365) |
-0.479*** (0.052) |
0.11 (0.1268) |
0.345*** (0.0227) |
-0.41*** (0.0406) |
0.307*** (0.1017) |
-0.14** (0.0614) |
0.332*** (0.0997) |
0.107* (0.0587) |
Intercept |
-3.731*** (0.0194) |
-3.088*** (0.0235) |
-5.519*** (0.0528) |
-3.731*** (0.0194) |
-3.088*** (0.0235) |
-5.519*** (0.0528) |
-3.731*** (0.0194) |
-3.088*** (0.0235) |
-5.519*** (0.0528) |
|
Other Goods and Services |
Housing |
Medical Care |
||||||
|
Mail/Tele Outlet (10) |
Internet Outlet (11) |
Ineligible Outlet (12) |
Mail/Tele Outlet (13) |
Internet Outlet (14) |
Ineligible Outlet (15) |
Mail/Tele Outlet (16) |
Internet Outlet (17) |
Ineligible Outlet (18) |
Under 35 Years Cohort |
-0.472*** (0.0494) |
0.711*** (0.0457) |
-0.328*** (0.0911) |
-0.477*** (0.0174) |
0.429*** (0.0289) |
-0.358*** (0.0501) |
-0.884*** (0.0948) |
0.087 (0.1412) |
-0.012 (0.2778) |
35 to 44 Years Cohort |
-0.165*** (0.0363) |
0.458*** (0.0437) |
-0.14** (0.0701) |
-0.172*** (0.0129) |
0.469*** (0.0261) |
-0.258*** (0.0395) |
-0.704*** (0.0625) |
0.02 (0.1105) |
-0.024 (0.2079) |
45 to 54 Years Cohort |
-0.109*** (0.0319) |
0.324*** (0.0422) |
-0.157** (0.0627) |
-0.063*** (0.0111) |
0.388*** (0.025) |
-0.186*** (0.0337) |
-0.396*** (0.0461) |
0.14 (0.0934) |
-0.156 (0.1856) |
55 to 64 Years Cohort |
0.125*** (0.0301) |
0.273*** (0.0427) |
-0.067 (0.0615) |
0.019* (0.0109) |
0.348*** (0.0251) |
-0.153*** (0.0333) |
0.056 (0.0384) |
0.397*** (0.086) |
-0.325* (0.1896) |
65 to 74 Years Cohort |
0.133*** (0.0347) |
0.084* (0.0483) |
0.058 (0.0691) |
0.131*** (0.0121) |
0.117*** (0.028) |
0.023 (0.0365) |
0.378*** (0.0389) |
0.251*** (0.0969) |
0.238 (0.1774) |
75 to 84 Years Cohort |
0.29*** (0.0444) |
-0.681*** (0.0794) |
0.36*** (0.0838) |
0.226*** (0.0161) |
-0.519*** (0.0429) |
0.322*** (0.045) |
0.598*** (0.0439) |
-0.087 (0.1301) |
0.603*** (0.1897) |
Intercept |
-3.731*** (0.0194) |
-3.088*** (0.0235) |
-5.519*** (0.0528) |
-3.731*** (0.0194) |
-3.088*** (0.0235) |
-5.519*** (0.0528) |
-3.731*** (0.0194) |
-3.088*** (0.0235) |
-5.519*** (0.0528) |
|
Recreation |
Transportation |
|
||||||
|
Mail/Tele Outlet (19) |
Internet Outlet (20) |
Ineligible Outlet (21) |
Mail/Tele Outlet (22) |
Internet Outlet (23) |
Ineligible Outlet (24) |
|
|
|
Under 35 Years Cohort |
-0.719*** (0.019) |
0.368*** (0.0215) |
-0.037 (0.0548) |
-0.504*** (0.031) |
0.418*** (0.0405) |
0.055 (0.0997) |
|
|
|
35 to 44 Years Cohort |
0.628*** (0.0143) |
0.31*** (0.0191) |
-0.083* (0.0454) |
-0.308*** (0.0229) |
0.353*** (0.0362) |
-0.159* (0.0877) |
|
|
|
45 to 54 Years Cohort |
-0.384*** (0.0122) |
0.25*** (0.0186) |
-0.06 (0.0423) |
-0.164*** (0.0187) |
0.369*** (0.0335) |
0.049 (0.0717) |
|
|
|
55 to 64 Years Cohort |
-0.057*** (0.0118) |
0.233*** (0.019) |
-0.014 (0.0435) |
-0.042** (0.0182) |
0.394*** (0.0335) |
-0.007 (0.073) |
|
|
|
65 to 74 Years Cohort |
0.249*** (0.0129) |
0.08*** (0.0216) |
0.023 (0.0501) |
0.194*** (0.0197) |
0.113*** (0.0379) |
0.028 (0.0825) |
|
|
|
75 to 84 Years Cohort |
0.608*** (0.0168) |
-0.433*** (0.034) |
0.139** (0.068) |
0.347*** (0.0256) |
-0.63*** (0.0614) |
0.004 (0.1138) |
|
|
|
Intercept |
-3.731*** (0.0194) |
-3.088*** (0.0235) |
-5.519*** (0.0528) |
-3.731*** (0.0194) |
-3.088*** (0.0235) |
-5.519*** (0.0528) |
|
|
|
***, **, * represent significance at the 1 percent, 5 percent, 10 percent level.
Appendix C—Results of Logistic Regression: Race Cohorts by CPI Major Group
|
Apparel |
Education and Communication |
Food |
||||||
Age Cohorts |
Mail/Tele Outlet (1) |
Internet Outlet (2) |
Ineligible Outlet (3) |
Mail/Tele Outlet (4) |
Internet Outlet (5) |
Ineligible Outlet (6) |
Mail/Tele Outlet (7) |
Internet Outlet (8) |
Ineligible Outlet (9) |
Householder who is White alone |
0.482*** (0.0638) |
0.347*** (0.0357) |
-0.184* (0.1026) |
0.145*** (0.0231) |
0.063** (0.0267) |
0.139 (0.131) |
0.091 (0.0716) |
0.246*** (0.0947) |
-0.364*** (0.0638) |
Householder who is Black or African American alone |
0.446*** (0.0747) |
-0.364*** (0.0495) |
-0.305** (0.1428) |
0.125*** (0.0297) |
-0.222*** (0.0369) |
-0.17 (0.1685) |
0.071 (0.0902) |
-0.602*** (0.1416) |
0.064 (0.0797) |
Householder who is American Indian and Alaska Native alone |
-0.117 (0.21) |
-0.274** (0.13) |
0.433 (0.2853) |
-0.095 (0.0752) |
-0.039 (0.0878) |
-1.111* (0.6111) |
0.094 (0.2169) |
-0.367 (0.3574) |
-0.654** (0.2744) |
Householder who is Asian alone |
-0.68*** (0.1302) |
0.253*** (0.0545) |
0.253 (0.1596) |
-0.056 (0.0371) |
0.406*** (0.0394) |
0.135 (0.1857) |
-0.072 (0.1222) |
0.288** (0.1452) |
0.176* (0.1002) |
Householder who is Native Hawaiian and Other Pacific Islander alone |
-0.154 (0.2639) |
0.044 (0.1393) |
-0.029 (0.4346) |
-0.171* (0.0962) |
0.013 (0.1075) |
0.277 (0.4021) |
-0.097 (0.3073) |
0.195 (0.3576) |
0.785*** (0.1838) |
Householder who is Some other race alone |
-0.381*** (0.1113) |
-0.306*** (0.062) |
-0.391** (0.1899) |
0.006 (0.037) |
-0.215*** (0.0461) |
0.168 (0.1858) |
-0.116 (0.1174) |
-0.307* (0.1669) |
-0.384*** (0.1145) |
Intercept |
-3.731*** (0.0194) |
-3.088*** (0.0235) |
-5.519*** (0.0528) |
-3.731*** (0.0194) |
-3.088*** (0.0235) |
-5.519*** (0.0528) |
-3.731*** (0.0194) |
-3.088*** (0.0235) |
-5.519*** (0.0528) |
|
Other Goods and Services |
Housing |
Medical Care |
||||||
|
Mail/Tele Outlet (10) |
Internet Outlet (11) |
Ineligible Outlet (12) |
Mail/Tele Outlet (13) |
Internet Outlet (14) |
Ineligible Outlet (15) |
Mail/Tele Outlet (16) |
Internet Outlet (17) |
Ineligible Outlet (18) |
Householder who is White alone |
0.202*** (0.0526) |
0.048 (0.0473) |
-0.141 (0.091) |
0.317*** (0.019) |
0.181*** (0.0291) |
0.225*** (0.0607) |
-0.022 (0.064) |
0.255 (0.1896) |
0.659 (8.6831) |
Householder who is Black or African American alone |
0.061 (0.0667) |
-0.304*** (0.0649) |
-0.015 (0.1168) |
-0.078*** (0.0254) |
-0.277*** (0.0403) |
0.01 (0.0783) |
-0.107 (0.0872) |
-0.488* (0.2544) |
-0.94 (8.7034) |
Householder who is American Indian and Alaska Native alone |
-0.117 (0.1897) |
-0.332* (0.1883) |
-0.46 (0.3891) |
-0.023 (0.0614) |
-0.337*** (0.1055) |
-0.242 (0.2087) |
0.055 (0.2174) |
-1.064 (0.8663) |
-7.246 (52.0878) |
Householder who is Asian alone |
-0.115 (0.0926) |
0.422*** (0.0706) |
-0.005 (0.1549) |
0.068** (0.0326) |
0.447*** (0.0438) |
0.011 (0.1029) |
-0.053 (0.1152) |
0.563** (0.2502) |
1.283 (8.6887) |
Householder who is Native Hawaiian and Other Pacific Islander alone |
0.066 (0.1988) |
0.321** (0.1601) |
0.849*** (0.2446) |
0.097 (0.0763) |
0.149 (0.1111) |
0.006 (0.2432) |
0.414* (0.2395) |
0.182 (0.6281) |
2.215 (8.7035) |
Householder who is Some other race alone |
-0.278*** (0.0933) |
-0.421*** (0.0881) |
0.044 (0.1456) |
-0.32*** (0.0348) |
-0.309*** (0.0524) |
-0.002 (0.0981) |
-0.348*** (0.1273) |
0.061 (0.2824) |
2.093 (8.6854) |
Intercept |
-3.731*** (0.0194) |
-3.088*** (0.0235) |
-5.519*** (0.0528) |
-3.731*** (0.0194) |
-3.088*** (0.0235) |
-5.519*** (0.0528) |
-3.731*** (0.0194) |
-3.088*** (0.0235) |
-5.519*** (0.0528) |
|
Recreation |
Transportation |
|
||||||
|
Mail/Tele Outlet (19) |
Internet Outlet (20) |
Ineligible Outlet (21) |
Mail/Tele Outlet (22) |
Internet Outlet (23) |
Ineligible Outlet (24) |
|
|
|
Householder who is White alone |
0.226*** (0.0209) |
0.131*** (0.0222) |
0.16** (0.0635) |
0.089*** (0.0301) |
0.158*** (0.0433) |
-0.265*** (0.102) |
|
|
|
Householder who is Black or African American alone |
0.156*** (0.0276) |
-0.227*** (0.0321) |
-0.013 (0.0891) |
0.027 (0.0396) |
-0.157*** (0.0576) |
0.233* (0.1263) |
|
|
|
Householder who is American Indian and Alaska Native alone |
-0.1 (0.07) |
-0.184** (0.0783) |
-0.002 (0.2155) |
-0.045 (0.1037) |
-0.295* (0.1562) |
0.372 (0.2862) |
|
|
|
Householder who is Asian alone |
0.028 (0.0359) |
0.357*** (0.0352) |
-0.04 (0.116) |
0.042 (0.0493) |
0.451*** (0.061) |
-0.319* (0.1852) |
|
|
|
Householder who is Native Hawaiian and Other Pacific Islander alone |
-0.013 (0.083) |
0.12 (0.0849) |
0.243 (0.2362) |
0.167 (0.1155) |
-0.077 (0.1724) |
-0.125 (0.4354) |
|
|
|
Householder who is Some other race alone |
-0.183*** (0.0363) |
-0.219*** (0.0395) |
-0.175 (0.1154) |
-0.236*** (0.0548) |
-0.22*** (0.075) |
0.219 (0.1577) |
|
|
|
Intercept |
-3.731*** (0.0194) |
-3.088*** (0.0235) |
-5.519*** (0.0528) |
-3.731*** (0.0194) |
-3.088*** (0.0235) |
-5.519*** (0.0528) |
|
|
|
***, **, * represent significance at the 1 percent, 5 percent, 10 percent level.
1 See https://www.census.gov/acs/www/methodology/sample-size-and-data-quality/response-rates/ for response rate information.
2 TPOPS uses a variety of adjustment factors in weighting, including those accounting for probability of selection, household size, and non-interviews.
| File Type | application/vnd.openxmlformats-officedocument.wordprocessingml.document |
| Author | Barbieri, Greg - BLS |
| File Modified | 0000-00-00 |
| File Created | 2021-01-21 |
© 2026 OMB.report | Privacy Policy