SESV SS Part B 060216
SESV SS Part B 060216.docx
Quantitative Assessment of Spatially-Explicit Social Values Relative to Wind Energy Areas: Outer Continental Shelf Offshore North Carolina
OMB: 0648-0744
SUPPORTING STATEMENT
Quantitative Assessment of Spatially-Explicit Social Values Relative to Wind Energy Areas: Outer Continental Shelf Offshore North Carolina
OMB CONTROL NO. 0648-xxxx
B. COLLECTIONS OF INFORMATION EMPLOYING STATISTICAL METHODS
1. Describe (including a numerical estimate) the potential respondent universe and any sampling or other respondent selection method to be used. Data on the number of entities (e.g. establishments, State and local governmental units, households, or persons) in the universe and the corresponding sample are to be provided in tabular form. The tabulation must also include expected response rates for the collection as a whole. If the collection has been conducted before, provide the actual response rate achieved.
Potential Respondent Universe and Response Rate
The potential respondent universe for this study includes residents over the age of 18 living in households that are located in an eight county study region spanning North Carolina and South Carolina; see Figure 2. Counties in North Carolina include: Bladen, Brunswick, Columbus, New Hanover, and Pender. Counties in South Carolina include: Dillon, Horry, and Marion. The estimated total number of households in the study region is 497,510 and the estimated total population over the age of 18 is 649,792.1
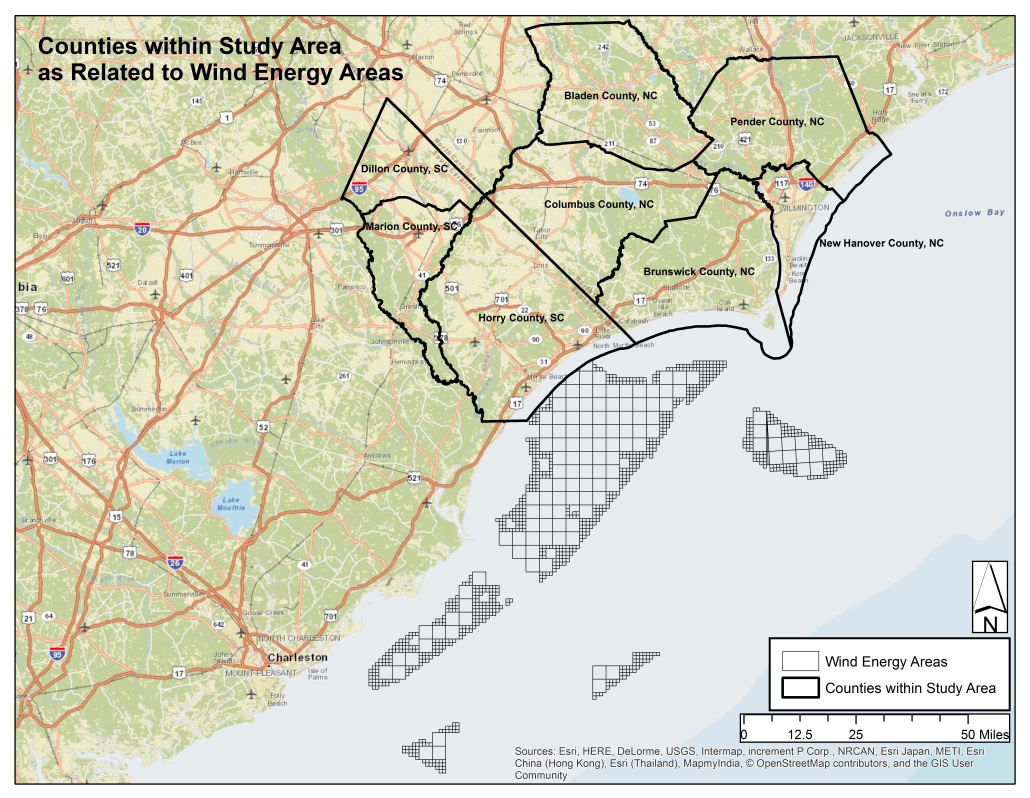
Figure 2: Study Counties in North Carolina and South Carolina
In terms of response rate, as a part of the 2010 decennial census, the U.S. Census Bureau reported mail back participation rates ranging from 67% to 78% for the eight counties included in this study.2 Reviewing studies conducted in different regions along the eastern seaboard on similar research topics as that being investigated in the present study, Firestone, Kempton and Kruegar 3 reported a 51.9% response rate from a household survey of coastal residents in Delaware to ascertain public opinion about offshore wind energy development. Firestone and Kempton4 reported a 38.5% response rate from a household survey relating to public opinion and offshore wind energy development in Massachusetts. Finally, in a survey inclusive of both Delaware and Massachusetts, Firestone et al.5 reported a response rate of 50%.
To better understand the social context of the issue in the region of interest, researchers talked with key government officials about the issue to gather anecdotal information on the level of public knowledge, interest, and awareness about offshore wind energy development. Additionally, researchers reviewed local and regional media to determine the nature and degree of media coverage, as proxy for gauging public interest. Media coverage was noted in both states with articles summarizing citizen support, concern, and opposition to offshore wind energy development in their region.6
Based on the anecdotal information gathered, researchers anticipate heightened resident awareness and interest in the issue in the region, which may improve study participation rates. Given response rates reported from mail back surveys in the study region achieved by Census, along with rates from topically-comparable surveys in other areas along the east coast, researchers plan for a response rate of approximately 60%.
Table 1: Potential Respondent Universe and Expected Response Rate
-
*Estimated Total Population 18 Years and Over
*Estimated Total Number of Households
Expected Response Rate
Study Region
609,649
464,089
60%
*2010-2014 American Community Survey 5-Year Estimates--DP05: ACS DEMOGRAPHIC AND HOUSING ESTIMATES
Sampling and Respondent Selection Method
A pre-test will be conducted on 300 individuals. Data will be collected using a two-stage stratified sampling design. We will stratify the study area by non-overlapping geographic bands within each state. Details of the strata are explained below. Within each stratum, we will be selecting households at random and within each selected household the individual with the most recent birthday with age 18 or older will be selected.
We proposed to use address based sampling to select residential households randomly within each of the stratum. The address based frame will be obtained from the U.S. Postal Service. Therefore, the primary sampling unit (PSU) is the household and the secondary sampling unit (SSU) consists of individuals selected within each household. The proposed strata will allow the researchers to examine the influence of geographic proximity on respondent level of support for offshore wind energy development and level of support activity. The strata consist of a combination of “coastal band” and state. Using block unit geographies from the U.S. Census Bureau, the eight-county study region will be divided into four coastal bands that emanate from the shoreline moving inland. These coastal bands will be further stratified by state, so that comparisons may be made between states, and also within each state between coastal bands. Figure 3 shows these coastal bands by state, with Band 1 in pink (nearest the shoreline) and Band 4 in blue (furthest inland).
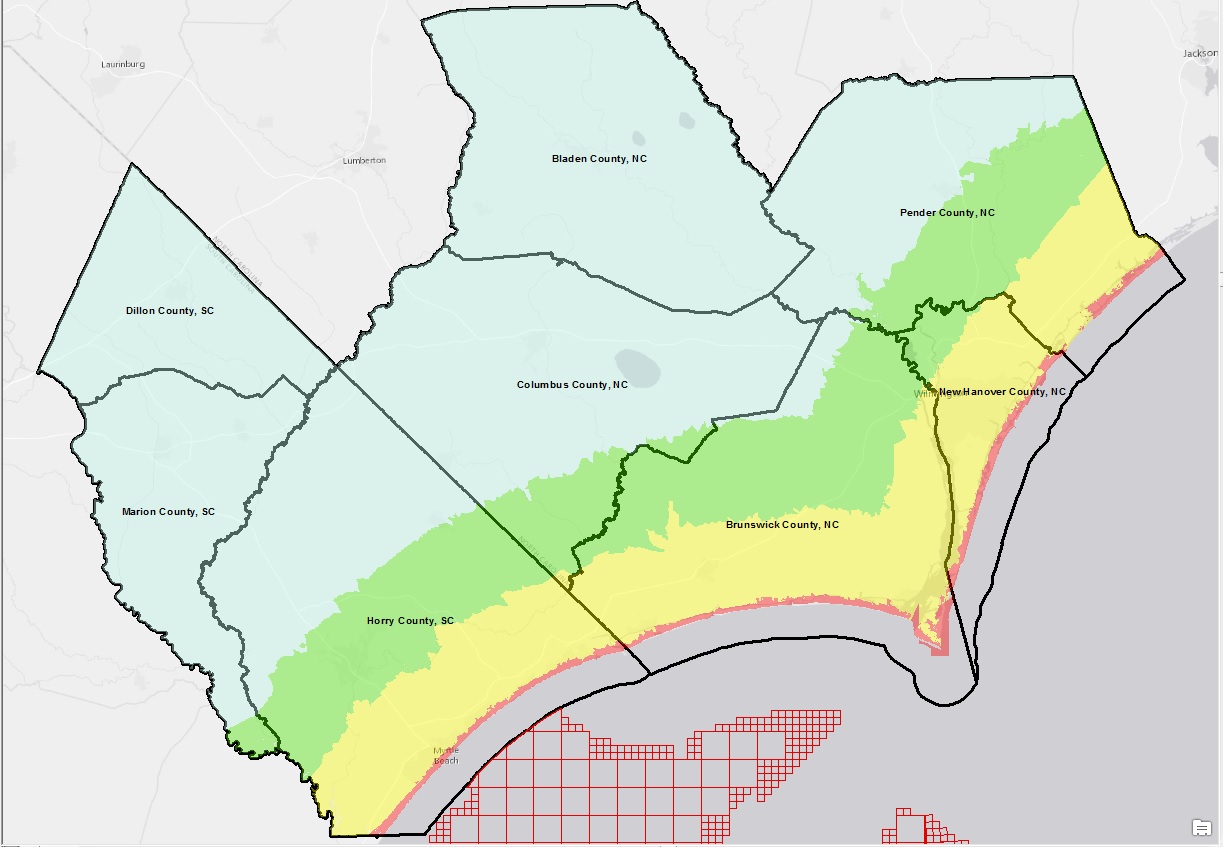
Figure 3: Coastal Bands to be used as the Sampling Geography for the Study
The required sample size for each stratum was calculated using Equation 1, below. We calculated a stratum based sample size given instead of an overall sample size because we would like to have enough precision at the stratum level.
Equation 1: Sample Size Calculation by Sampling Unit7
where
ss =
sample size
N = population size
P = population proportion
(.40) 8
d = .05 = ±5%
X2 =
value of chi square for one degree of freedom relative to 95% level
of confidence
Table 2 provides a breakdown of the tentative estimated number of completes desired for each stratum, along with the sample size per stratum, assuming a 60% response rate. The final sample size (completes and adjusted) for the final collection will be calculated with the assistance of the vendor selected to conduct the data collection, based on their expertise conducting similar surveys in the region of interest. Additionally, the final sample size for the final collection may be adjusted based on information gained after a pre-test of the survey.
Table 2: Total Respondent Universe, Pre-test Sample, Final Collection Estimated Completes Needed, and Final Collection Adjusted Sample Size by Coastal Bands and State
-
Estimated Total Number of Households
Pre-Test Sample
Final Collection Est. Completes Needed
(95% confidence level)
Final Collection Est. Adjusted Sample Size
(nh*.30) + nh
NC Band 1 (pink)
37,948
25
365
475
NC Band 2 (yellow)
136,346
88
368
478
NC Band 3 (green)
24,046
16
363
472
NC Band 4 (blue)
51,062
33
366
476
SC Band 1 (pink)
70,481
46
367
477
SC Band 2 (yellow)
80,474
52
367
477
SC Band 3 (green)
24,320
16
363
472
SC Band 4 (blue)
39,412
25
365
475
Total
464,089
300
2925
3802
To approximate random selection of one respondent within the household, instruction will be given in the informational letter accompanying the survey package asking that the survey be completed by the person in the household over the age of 18 who most recently celebrated a birthday.
2. Describe the procedures for the collection, including: the statistical methodology for stratification and sample selection; the estimation procedure; the degree of accuracy needed for the purpose described in the justification; any unusual problems requiring specialized sampling procedures; and any use of periodic (less frequent than annual) data collection cycles to reduce burden.
Stratification and Sample Selection
As stated previously, we will stratify the study area by “coastal band” and state. Using block unit geographies from the U.S. Census Bureau, the eight-county study region will be divided into four coastal bands that emanate from the shoreline moving inland (Figure 3). These coastal bands will be further stratified by state, so that comparisons may be made between states, and within each state between coastal bands. Strata will be a combination of coastal band and state. Residential households will be randomly selected from each stratum using an address based frame procured from the U.S. Postal Service. The desired sample size for each stratum was calculated using Equation 1, provided above.
Estimation Procedures and Weighting
Estimates in general will be made using standard procedures for stratified random samples without replacement (Lohr9). Researchers will calculate the analysis weight which simultaneously accounts for the selection of the PSU (household) and the SSU (individual). Post-stratification and weighting adjustments will be undertaken as needed to adjust for non-response and non-representativeness of the sample.
Attribute profiles will be summarized using basic design-based univariate descriptive statistics with and without sampling weight adjustments. Associations between independent and dependent variables will be examined using the chi-square test, Cochran Mantzel Hansel test, ANOVA, Pearson’s r tests for survey data, and other appropriate analyses. Linear regression for survey data will be used to model continuous, independent variables. Logistic, Multinomial or Poisson regression for survey data will be used for binary, categorical and count variables. Associations between multiple independent and dependent variables will be further tested using ordinary least squares regression for survey data. Other statistical modeling approached may be employed as appropriate.
3. Describe the methods used to maximize response rates and to deal with nonresponse. The accuracy and reliability of the information collected must be shown to be adequate for the intended uses. For collections based on sampling, a special justification must be provided if they will not yield "reliable" data that can be generalized to the universe studied.
Researchers propose a mail back survey approach because response rates are generally better using this mode of survey administration, following the Dillman Tailored Design Method.10 Final study design and survey administration procedures will be subject to the guidance and expertise of the vendor hired to complete the data collection with regard to maximizing response rate, based on their experience conducting similar collections in the region of interest.
Researchers will adhere to OMB’s “Standards and Guidelines for Statistical Surveys” related to non-response analysis and response rate calculation.11 Using standard formulas set forth in these guidelines, the research team will “measure, adjust for, report, and analyze unit and item nonresponse to assess their effects on data quality and to inform users.”
4. Describe any tests of procedures or methods to be undertaken. Tests are encouraged as effective means to refine collections, but if ten or more test respondents are involved OMB must give prior approval.
This request is for approval of a pre-test. Researchers will conduct a pretest to ensure that all components of a survey function as intended prior to final implementation. The survey instrument will be pretested on a random sample of 300 households in the study region, per the sampling protocol described above. This pretest will be used to further evaluate survey design and item feasibility, as well as refine sampling parameters based on response rate. Additionally, the pretest will be used to develop and evaluate data collection, analytical workflows, operational protocols, and processes. A change request for the final collection will be submitted.
5. Provide the name and telephone number of individuals consulted on the statistical aspects of the design, and the name of the agency unit, contractor(s), grantee(s), or other person(s) who will actually collect and/or analyze the information for the agency.
The following individuals were consulted on the survey design and proposed implementation. From these individuals, we received review relative to: sampling design; survey length; appropriate mode of survey administration (i.e., mail back versus online administration); problematic survey items in terms of utility, clarity, etc.; item order on the survey instrument; item format and presentation; and opportunities to leverage this survey with previous or existing research efforts.
Michael Jepson, Ph.D.
Social Scientist
NOAA/NMFS/SERO
263 13th Avenue South
St. Petersburg, FL 33701
Ph: 727-551-5756
Email: michael.jepson@noaa.gov
Richard Krannich, Ph.D.
Utah State University
Department of Sociology, Social Work & Anthropology
0730 Old Main Hill
Old Main (MAIN) 216F
Logan, UT 84322-0730
Ph: 435-797-1241
Email: richard.krannich@usu.edu
George R. Parsons, Ph.D.
School of Marine Science & Policy
University of Delaware
Ph: 302-831-6891
Email: gparsons@udel.edu
Paul C. Ticco, Ph.D.
Regional Coordinator
Northeast and Great Lakes Region
NOAA Office of National Marine Sanctuaries
100 Museum Drive
Newport News, VA 23606
Ph: (757) 591-7351
Email: paul.ticco@noaa.gov
Jennifer Thomsen, Ph.D.
Assistant Professor
Department of Society and Conservation
University of Montana
Ph: 406-243-6581
Email: jennifer.thomsen@umontana.edu
Christine M. Voss, PhD
Coastal Habitat & Ecosystem Ecologist
Research Associate
University of North Carolina at Chapel Hill
Institute of Marine Sciences
3431 Arendell St.
Morehead City, NC 28557
Ph: 252.726.6841 x125
Email: c.m.voss.unc@gmail.com
This project will be implemented by researchers with NOAA’s National Centers for Coastal Ocean Science. Project Principal Investigators are:
Theresa L. Goedeke, Ph.D. (Lead)
Social Scientist
NOAA National Ocean Service National Centers for Coastal Ocean Science
1305 East West Hwy
Building SSMC4, Rm 9326
Ph: 240-533-0383
Email: theresa.goedeke@noaa.gov
Maria K. Dillard, Ph.D. (Co-Lead)
Social Scientist
NOAA National Ocean Service National Centers for Coastal Ocean Science
Hollings Marine Laboratory
Charleston, South Carolina
Ph: 843-762-8929
Email: maria.dillard@noaa.gov
Data collection will be contracted out to an external vendor which has yet to be solicited and selected. Data analysis will be conducted by the project principal investigators along with the following research team members:
Sarah Gonyo, Ph.D.
Natural Resource Economist
NOAA National Ocean Service National Centers for Coastal Ocean Science
CSS-Dynamac
1305 East West Highway
Building SSMC4, Rm 9320
Silver Spring, MD 20910
Ph: 240-533-0382
Email: sarah.gonyo@noaa.gov
Jarrod Loerzel, M.S.
Social Scientist
NOAA National Ocean Service National Centers for Coastal Ocean Science
Hollings Marine Laboratory
331 Fort Johnson Road
Charleston, SC 29412
JHT, Inc.
Ph: 843.762.8864
Email: jarrod.loerzel@noaa.gov
Angela Orthmeyer, M.S.
NOAA National Ocean Service National Centers for Coastal Ocean Science
CSS-Dynamac
1305 East West Highway
Building SSMC4, Rm 9319
Silver Spring, MD 20910
Ph: 240-533-0381
Email: angela.orthmeyer@noaa.gov
Chris Ellis, Ph.D.
Social Scientist
NOAA Office for Coastal Management
2234 S. Hobson Avenue
Charleston, SC 29405-2413
Ph: 843-740-1195
Email: chris.ellis@noaa.gov
1 2010-2014 American Community Survey 5-Year Estimates--DP05: ACS DEMOGRAPHIC AND HOUSING ESTIMATES
2 Final report of mail back participation rate by county for 2010 Decennial Census, U.S. Census Bureau. Available online: https://www.census.gov/2010census/news/press-kits/operational-press-briefing/april-28-2010.html
3 Firestone, J., W. Kempton, A. Krueger, Delaware Opinion on Offshore Wind Power, prepared
pursuant to a grant from the Delaware Energy Office, January 2008. Available online: http://www.ceoe.udel.edu/Windpower/docs/FinalDNRECOpinionReport.pdf.
4 Firestone, J. and W. Kempton. 2007. Public opinion about large offshore wind power: Underlying factors. Energy Policy 35 (2007) 1584–1598.
5 Firestone, J, W. Kempton, M. Blaydes Lilley, and K. Samoteskula. 2012. Public acceptance of offshore wind power across regions and through time. Journal of Environmental Planning and Management 55(10): 1369-1386.
6 Bellamy, Cammie. 2015. “Area residents concerned about wind turbines.” StarNewsOnline October 7, 2015. Web. February 24, 2016.; Carnevale, Chris. 2012. “Establishing a wind powered economic zone: North Myrtle Beach reaches for offshore wind.” Cleanenergy.org November 26, 2012. Web. February 24, 2016.
Carnevale, Chris. 2013a. “City of Charleston embraces offshore wind, welcomes opportunity.” Cleanenergy.org June 19, 2013. Web. February 24, 2016.; Carnevale, Chris. 2013b. “North Charleston proclaims support for offshore wind energy.” Cleanenergy.org October 11, 2013. Web. February 24, 2016.; Carnevale, Chris. 2014. “South Carolina legislature gives two thumbs up to wind energy.” Cleanenergy.org June 6, 2014. Web. February 24, 2016.
Carnevale, Chris. 2015. “South Carolina offshore wind energy reaches major milestone.” Cleanenergy.org November 24, 2015. Web. February 24, 2016.; Harvey, Chelsea. 2016. “Why conservative South Carolina could actually be a sign of the future of U.S. energy.” The Washington Post January 28, 2016. Web. February 24, 2016.
Hudson, Audrey. 2016. “Offshore wind energy hearing draws support for alternative energy, wildlife concerns.” MyrtleBeachOnline January 6, 2016. Web. February 24, 2016.; Murawski, J. Aug 14, 2013. Coastal Residents of NC Get Glimpse of Proposed Offshore Wind Farm. The News & Observer (newsobserver.com). Online at: http://www.newsobserver.com/2013/08/14/3108097_coastal-residents-get-glimpse.html?rh=1 . Accessed on September 30, 2014.
7 Krejcie, R.V. & Morgan, D.W. (1970) Determining sample size for research activities. Educational and Psychological Measurements, 30, 607-610.
8 Based on approximate expected proportion of population reporting “firm support” for offshore wind energy development as found in: Firestone, J, W. Kempton, M. Blaydes Lilley, and K. Samoteskula. 2012. Public acceptance of offshore wind power across regions and through time. Journal of Environmental Planning and Management 55(10): 1369-1386.
9 Lohr, Sharon L. 1999. Sampling: Design and Analysis, Second Edition. Boston: Brooks/Cole.
10 Don A. Dillman, Jolene D. Smyth and Leah Melani Christian. Internet, Mail, and Mixed-Mode Surveys, The Tailored Design Method, 3rd Edition (Hoboken: John Wiley & Sons, 2009).
11 Office of Management and Budget Standards and Guidelines for Statistical Surveys (September 2006). Available online at: https://www.whitehouse.gov/sites/default/files/omb/inforeg/statpolicy/standards_stat_surveys.pdf.
| File Type | application/vnd.openxmlformats-officedocument.wordprocessingml.document |
| Author | Sarah Brabson |
| File Modified | 0000-00-00 |
| File Created | 2021-01-23 |
© 2026 OMB.report | Privacy Policy