Justification for Change
Nonsub Adaptive Design Exp 042716.docx
National Health Interview Survey
Justification for Change
OMB: 0920-0214
Request for Approval of a Nonsubstantive Change:
National
Health Interview Survey (NHIS)
ADAPTIVE DESIGN EXPERIMENT
OMB No. 0920-0214
(Expiration Date 12/31/2017)
Contact Information:
Marcie Cynamon
Director, Division of Health Interview Statistics
National Center for Health Statistics/CDC
3311 Toledo Road
Hyattsville, MD 20782
301.458.4174 (voice)
301.458.4035 (fax)
April 27, 2016
NATIONAL
HEALTH INTERVIEW SURVEY (NHIS)
ADAPTIVE DESIGN EXPERIMENT
A1. Circumstances Making the Collection of Information Necessary
This request is for a nonsubstantive change to an approved data collection (OMB No. 0920-0214; exp. 12/31/2017), the National Health Interview Survey (NHIS). With this nonsubstantive change request, the Division of Health Interview Statistics seeks clearance to test the use of adaptive design in the NHIS. The aim is to investigate the impact of adaptive case prioritization on sample representativeness and nonresponse bias, while maintaining survey costs and minimizing any possible negative effect on the overall response rate.
Declining response rates and increasing data collection costs have forced survey organizations to consider new data collection strategies [1]. Adaptive design has emerged as a tool for tailoring contact to cases, based on data monitoring both between and during data collection periods [2]. There is a range of data collection features that can be tailored, including mode of data collection [3], incentives [4, 5], number of contacts [6], and case prioritization [7]. The feature used for tailoring should be chosen to achieve specific survey goals. For example, one may want to increase response rate or sample representativeness for a given cost, or maintain the same response rate, while reducing cost. The planned case prioritization experiment is a test of the former; prioritization entails altering the amount of effort an interviewer expends on a case based on data monitoring metrics.
A2. Purpose and Use of the Information Collection
The planned NHIS case prioritization experiment will be carried out in collaboration with the Center for Adaptive Design (CAD) at the U.S. Census Bureau, and is scheduled to begin in July 2016, to encompass the third quarter of data collection. Data monitoring metrics and quality indicators will be used to assign a priority level to cases in each interviewer’s workload, with the aim of increasing sample representativeness and reducing nonresponse bias within a fixed cost.
The planned experiment requires no additional data collection from respondents, or changes to data collection procedures experienced by survey participants. Case prioritization will occur based on response propensity models, constructed using historical NHIS sample variables, contact paradata variables, Neighborhood Observation Instrument (NOI) variables, and planning database variables. The propensity score generated from these models for each case—based on its likelihood of response and contribution to representativeness—will inform its prioritization or de-prioritization for interviewer contact.
Experimental Design
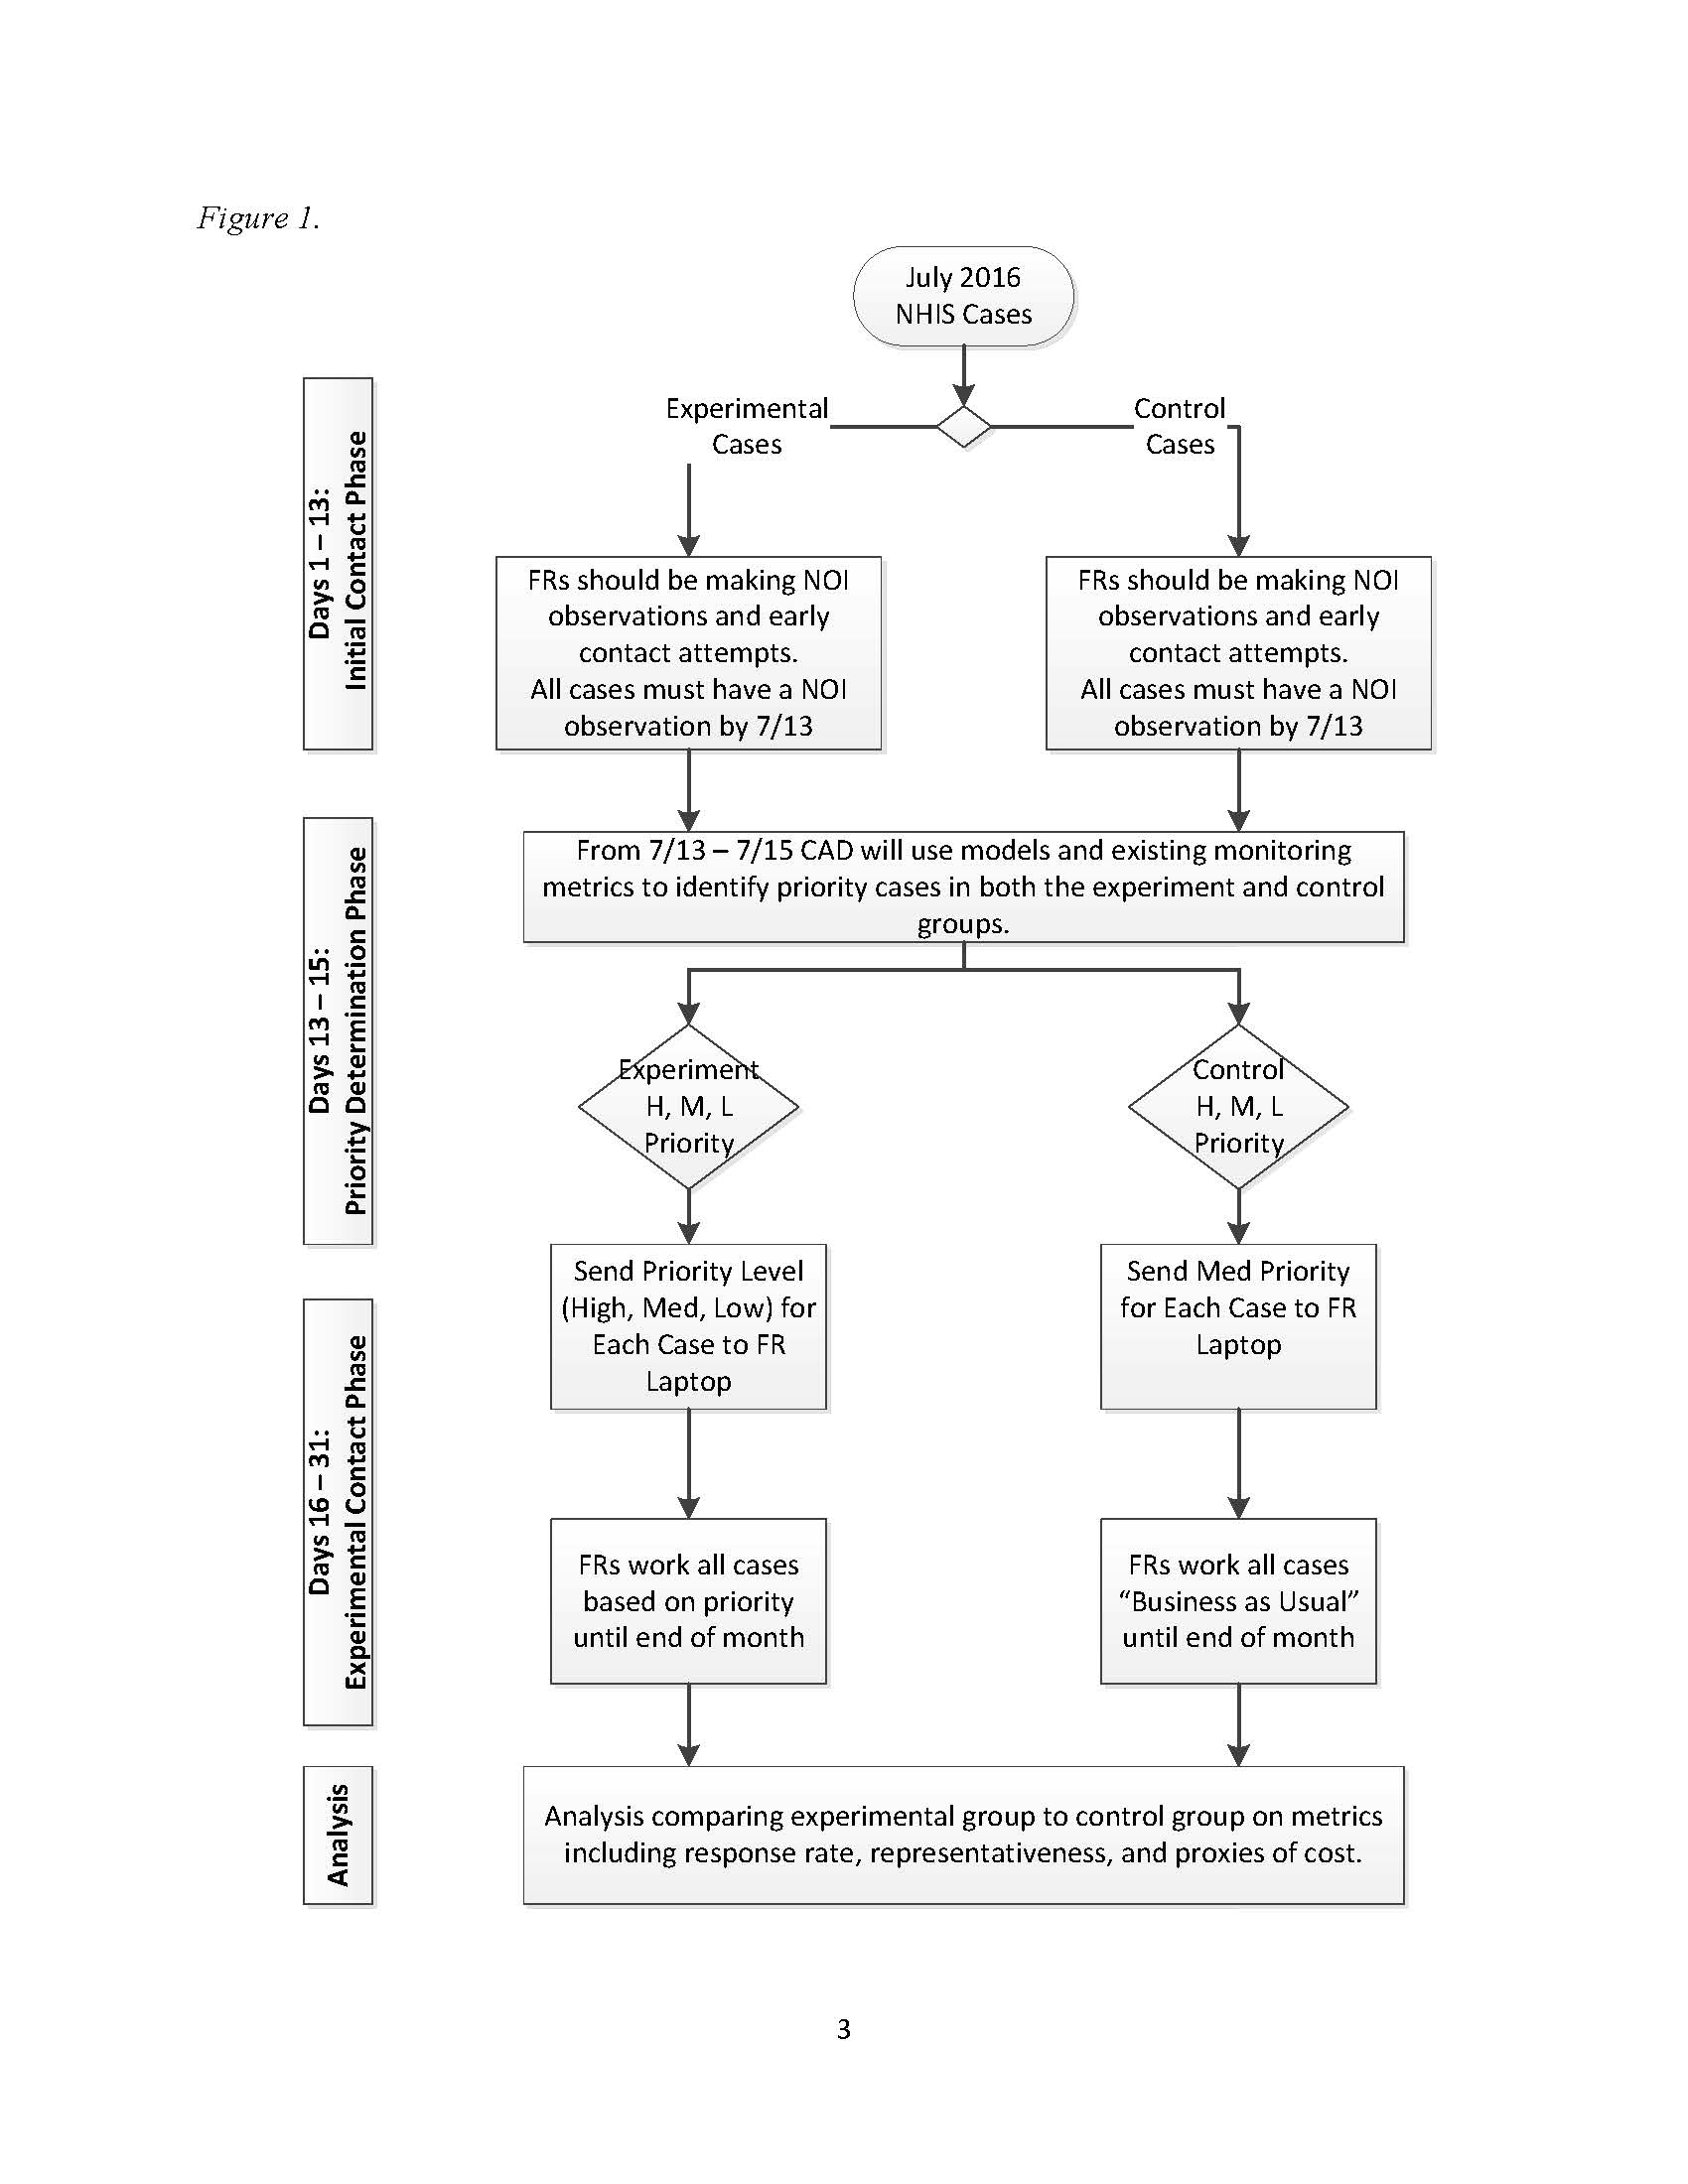
The approximate total sample size for the experiment is 17,000 families, of which it is anticipated that roughly 14,000 will be in-scope (eligible for the survey). Figure 1 (below) shows that although cases will be assigned to either the experimental or control groups before data collection starts, all cases will be treated the same for the first 13 days of data collection in each month. During this time, interviewers (referred to as “FR” in the figure, short for “field representative”) must ensure that at least one contact attempt is made for each case, and that interviewer observations are documented for each case in the Neighborhood Observation Instrument (NOI). The NOI data1 will be combined with covariate data that is available before the start of data collection and contact history instrument (CHI) data2 that is collected during every contact attempt for each case to run models and create monitoring metrics for days 13-15.
During days 13-15, the priority (H: high, M: medium, L: low) for each incomplete case will be determined, based on a calculation of how strategic a case is to achieving the experimental goal of improving sample representativeness and managing costs without negatively affecting overall response. For example, we would want to assign high priority to a case that, if completed, would improve representativeness. However, this decision would have to be balanced by how likely the case is to be completed. If the case appeared impossible to convert based on the interviewer’s notes, we may not assign a high priority to the case, effectively expending additional resources to a fruitless pursuit. Similarly, if a case had a very high likelihood of response, but would not improve representativeness because we already had an overabundance of respondents with the same characteristics, we would not want to prioritize a case simply because the case is likely to respond. All cases (both experimental and control) will be assigned a priority status, which may be useful later for propensity matching or direct comparisons among subgroups in the experimental vs. control groups. However, only experimental cases will have the priority statuses displayed in field management reports and on interviewer laptops. The experimental cases with low priority status will “disappear” from the interviewer’s workload.
During the second half of the month, cases assigned to high or low priority in the experimental group will be treated differently by interviewers in the field, while all other cases will be worked with a “Business as Usual” approach. The goal is for lower priority cases to be worked less intensely and high priority cases to be worked more intensely, in pursuit of the goals for the data collection.
Data and Metrics
For this experiment, metrics are needed that will predict likelihood of response and how much a case will contribute to representativeness of the respondent population. We will use response propensity models to predict likelihood of response. Unlike propensity models used in weighting adjustments [8], where we are concerned about finding variables that predict the outcomes of interest, here we are concerned solely with predicting likelihood of response.
Identification of cases that will contribute to representativeness relies on R-indicators [9]. R-indicators are based upon a balancing propensity model that, like those used for nonresponse adjustment, focus on the outcomes of interest. The idea is that if we have balanced response across all subgroups that are related to outcomes of interest, the survey will be better protected against nonresponse bias. Estimating the between and within subgroup variance of response propensities [10] will allow us to determine which cases are in over-represented or under-represented subgroups.
Several data sources are available for these two categories of models. First, we have the sample design data from the NHIS. These data include information about sampling, such as base weights and stratification information, as well as geographic information. These variables are fixed covariates that are available prior to the start of data collection. In addition, we have access to the Planning Database (PDB), which is a database of block-group level sociodemographic characteristics, derived from decennial census data as well as American Community Survey 5-year estimates.
There are also two main sources of paradata gathered during the course of data collection. First, we are relying on the interviewers to make observations in the neighborhood observation instrument (NOI). In addition, we have the contact history instrument (CHI) data, which details the date, time, and outcomes of contact attempts, contact strategies used, respondent reluctance, and interviewer notes. These data collected about the contact process will be used to predict response [11]. In addition, previous work on the NHIS has shown that NOI observations can predict response and effort required [12][13].
Much of the exploratory work will be determining which variables are optimal for inclusion in the response propensity model and the balancing propensity model used in R-indicators. We will build these models using historical NHIS sample variables, contact paradata variables, NOI variables, and planning database variables. Once we can group cases into the high, medium, and low categories for both likelihood of response, and contribution to representativeness, priority status can be assigned to all cases in both the control and the treatment groups.
Evaluation Plan
To assess the effectiveness of response propensity-based case prioritization, the experimental and control groups shown in Figure 1 will be compared on a number of indicators. Both process and outcome measures will be examined as part of the evaluation of the experiment; they include response rates, sample representativeness (as measured by reductions in nonresponse bias and possible reduction in variance of estimates), and proxy measures of cost (including the number of contact attempts required to complete a case, interview length, etc.). The experiment will be considered successful if its evaluation shows improved representativeness (reductions in nonresponse bias, possible reductions in variance of estimates), as well as potential reductions in cost and improvements in response rates.
Sample Representativeness
The primary objective of this experiment is to improve sample balance or representativeness (minimize nonresponse bias) within current cost constraints while maintaining current response rates. During each month of the quarter, the R-indicator (a measure of variation in response propensities that ranges between 0 and 1) will be monitored for both the control and experimental groups using the aforementioned balancing model. The R-indicator provides an assessment of sample representativeness conditional on the covariates included in the balancing model. (Again, the balancing model will include covariates that are a mixture of interviewer observational measures along with decennial Census and ACS measures captured at the Census block group or tract level. The covariates selected for the model are those that are highly correlated with key health outcomes.) A decreasing R-indicator represents an increase in the variation in response propensities, suggesting less sample balance or representativeness. An increasing R-indicator indicates less variation in response propensities and better sample balance. Comparing R-indicators for the experimental and control groups during and at the end of data collection will provide an assessment of whether the experimental case prioritizations led to improved representativeness (indicated by a higher value on the R-indicator for the experimental compared to the control group).
Post-data collection, demographic characteristics of the two groups, including age, sex, race/ethnicity, and education level, will be compared. Next, point and variance estimates of 16 select health variables included in NHIS’s Early Release (ER) indicator reports (e.g., health insurance coverage, failure to obtain needed medical care, cigarette smoking and alcohol consumption, and general health status) will be compared between the two groups. If increased representativeness of the sample has been achieved, differences in the estimates across the two groups should be observed. Using past analyses of nonresponse bias, statements can be made as to whether the experimental group estimate is moving in a direction that minimizes nonresponse bias. Reductions in variance would also suggest increased representativeness. A more representative sample should result in smaller nonresponse and poststratification adjustments, reducing the variability of sample weights. Design effects and standard errors for all estimates examined will be compared between the control and experimental groups.
Response Rates and Survey Costs
Since the goal is to improve representativeness within current cost constraints while maintaining current response rates, overall and module-specific response rates, completed interview rates, sufficient partial interview rates, and refusal rates will be compared by control and experimental groups. In addition, the total number of contact attempts (in-person visits and phone calls) for the two groups will serve as a proxy for survey costs.
Other Data Quality Indicators
Additional measures of data quality will also be examined by adaptive design group, including, but not limited to, item nonresponse rates (“don’t know” and “refused” responses), item response times, and survey breakoffs
Distribution of Interviewer Effort
The success of the experiment is predicated on interviewers adjusting their effort according to the prioritizations assigned to their cases. Once the case prioritizations are assigned and pushed out to FR laptops on the 16th of each month, the distribution of contact attempts by case prioritization will be monitored. Focusing on the experimental group, for example, are interviewers shifting their contact attempts away from low priority cases toward high priority cases? When interviewers make their contact attempts will also be monitored. Are interviewers in the experimental group moving attempts on high priority cases to more lucrative time slots (e.g., evening hours and weekends)?
A12. Estimates of Annualized Burden Hours and Cost
Requiring no additional data collection nor changes to data collection procedures experienced by NHIS respondents, the planned adaptive design experiment would not alter the previously-approved estimates of annualized burden hours and survey administration costs. Costs associated with implementing the experiment are limited to interviewer training expenses, and are covered by funds designated to Methodological Projects listed in Line 5 of the previously-approved burden table.
References
[1] Groves, R.; Heeringa, S. “Responsive design for household surveys: tools for actively controlling survey errors and costs.” Journal of the Royal Statistical Society, Series A. 169 (2006): pp 439-457.
[2] Axinn, W.; Link, C.; Groves, R. “Responsive Design Demographic Data Collection and Models of Demographic Behavior.” Demography. 48 (2011): pp 1127 – 1149.
[3] Calinescu, M.; Bhulai, S.; Schouten, B. “Optimal Resource Allocation in Survey Designs.” European Journal of Operations Research. 226:1 (April, 2013): pp 115-121.
[4] Mercer A.; Caporaso, A.; Cantor, D.; Townsend, R. “How Much Gets You How Much? Monetary Incentives and Response Rates in Household Surveys.” Public Opinion Quarterly. 79: 1 (2015): pp 105-129.
[5] Coffey, S.; Reist, B.; Zotti, A. “Static Adaptive Design in the NSCG: Results of a Targeted Incentive Timing Study.” Presentation at the Joint Statistical Meetings, 2015. Seattle, WA.
[6] Konicki, S. “Adaptive Design Research for the 2020 Census.” Presentation at the Joint Statistical Meetings, 2015. Seattle, WA.
[7] Wagner, J.; West, B.; Kirgis, N.; Lepkowski, J.; Axinn, W.; Ndiaye, S. “Use of Paradata in a Responsive Design Framework to Manage a Field Data Collection.” Journal of Official Statistics. 28:4 (2012): pp. 477-499.
[8] Little, R. J.; Vartivarian, S. L. “Does Weighting for Nonresponse Increase the Variance of Survey Means?” Survey Methodology. 31 (2005): pp. 161-168.
[9] Schouten, B. Cobben, F. Bethlehem, J. “Indicators for representativeness of survey response.” Survey Methodology. 35.1 (June 2009): pp 101 – 113.
[10] Schouten, B. Shlomo, N. Skinner, C. “Indicators for monitoring and improving representativeness of response.” Journal of Official Statistics. 27.2 (2011): pp 231 – 253.
[11] West, B.T. “An Examination of the Quality and Utility of Interviewer Observations in the National Survey of Family Growth.” Journal of the Royal Statistical Society, Series A. 176:1 (2013): pp. 211-225.
[12] Erdman, C. and Dahlhamer, J. (2013) “Evaluating Interviewer Observations in the National Health Interview Survey: Associations with response propensity.” Proceedings of the Joint Statistical Meetings, Section on Survey Research Methods. Montreal, CN.
[13] Walsh, R.; Dahlhamer, J.; Bates, N. (2014) “Assessing Interviewer Observations in the NHIS.” Proceedings of the Joint Statistical Meetings, Section on Survey Research Methods. Boston, MA.
1 These data include information the interviewer observes about the housing unit that may be predictive of survey response.
2 These data include information about the date, time, and outcomes of contact attempts, contact strategies used, respondent reluctance, and interviewer notes.
| File Type | application/vnd.openxmlformats-officedocument.wordprocessingml.document |
| Author | Joestl, Sarah S. (CDC/OPHSS/NCHS) |
| File Modified | 0000-00-00 |
| File Created | 2021-01-23 |
© 2026 OMB.report | Privacy Policy