Hazard Simplification 2
NOAA Customer Surveys
PotentialquestionsforcurrentwebsiteWWAmaps_060916
Hazard Simplification 2
OMB: 0648-0342
OMB Control No. 0648-0342
Expiration Date: 5/31/2018
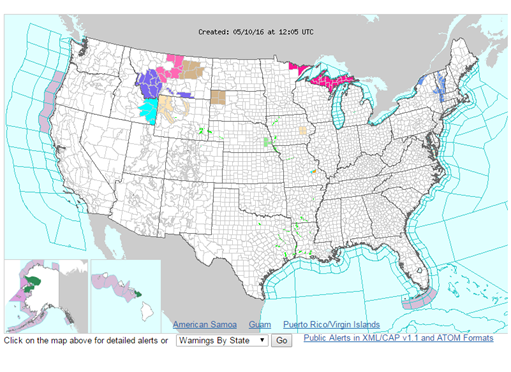
The National Weather Service (NWS) utilizes a map with 122 categories on its national website (www. weather.gov) to depict the wide variety of Watches, Warnings and Advisories (WWA) for weather, water and other hazards that impact life and property. There are this many categories due to the wide variety of hazards we see across the country, how immediate the threats are, how severe they could be, what kinds of impacts they could have, and more.
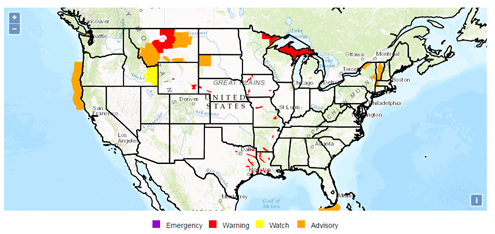
As part of the NWS’ “Hazard Simplification Project”, NWS is collecting comments on proposed alternatives for depicting these hazards graphically. The two maps provided below are examples of such alternatives. Each map uses a limited set of colors to depict this complex hazard information in different ways.
The first map converts all NWS Watches, Warnings and Advisories to the colors Yellow, Red and Orange, respectively, with the exception of certain warnings that receive “Emergency” status and are colored purple. More information about the hazard type (for example, severe thunderstorm, tornado, winter storm, etc.) can be found by “mousing over” the affected place on the map.
The second map uses the same four-color approach. However, this time, the Yellow, Orange and Red colors represent recommended actions as “Be Aware”, “Get Prepared” or “Take Action”, respectively, with the exception of certain situations that receive “Take Action - Urgent” status and are colored purple.
Below, you will be presented with the current map and the two alternatives. They all represent information from the same point in time, just presented in different ways.
This is a voluntary survey aimed at receiving feedback on two alternative maps to depict weather and water hazards. Please take a moment to review the maps below and provide your feedback. We thank you for your assistance in helping us to help you become more “Weather Ready”!
Current Watch, Warning, Advisory (WWA) System Map

Map Option #1:

Map Option #2
(To be placed here when ready)
The Following Questions Refer to the Current WWA Map:
1. Please describe the utility of the Current WWA map for this event (e.g., how well it conveys what the hazards are, how severe the impacts could be, how immediate the impacts could be, how useful you find it overall, etc.)
a. What works well?
b. What does not work well?
2. Do this map adequately enable you to make decisions? Why or why not?
Proposed Alternative Map #1:
1. Please describe the utility of Map #1 for this event (e.g., how well it conveys what the hazards are, how severe the impacts could be, how immediate the impacts could be, how useful you find it overall, etc.)
a. What works well?
b. What does not work well?
2. How does this new map compare to WWA in its ability to inform your decision-making? Why or why not?
Proposed
Alternative Map #2:
1. Please describe the utility of Map #2 for this event (e.g., how well they conveys what the hazards are, how severe the impacts could be, how immediate the impacts could be, how useful you find it overall, etc.)
a. What works well?
b. What does not work well?
2. How does this new map compare to WWA in its ability to inform your decision-making? Why or why not?
Circle
the number that indicates your degree of satisfaction.
Part 1: Comparing the proposed new maps to the original WWA maps
Overall satisfaction with the two maps, considered together as a set, compared with information obtained solely from the current watch, warning, advisory system map presented on the “weather.gov” site.
1 2 3 4 5 N/A
Not
at all Satisfied Not Satisfied No Opinion Satisfied
Extremely Satisfied Not Applicable
----------------------------------------------------------------------------------------------------------------
Public
reporting burden for this collection of information is estimated to
average 15 minutes per response, including the time for reviewing
instructions, searching existing data sources, gathering and
maintaining the data needed, and completing and reviewing the
collection of information. Send comments regarding this burden
estimate or any other suggestions for reducing this burden to:
Notwithstanding
any other provisions of the law, no person is required to respond to,
nor shall any person be subjected to a penalty for failure to comply
with, a collection of information subject to the requirements of the
Paperwork Reduction Act, unless that collection of information
displays a currently valid OMB Control Number. Finally, please note
that under no circumstances will individual response be shared.
| File Type | application/vnd.openxmlformats-officedocument.wordprocessingml.document |
| Author | Andrew Pirring |
| File Modified | 0000-00-00 |
| File Created | 2021-01-25 |
© 2026 OMB.report | Privacy Policy