Note to Reviewer - Cell Phone Implementation
Note to Reviewer - Cellphone_implementation_OMB_final.docx
Telephone Point of Purchase Survey
Note to Reviewer - Cell Phone Implementation
OMB: 1220-0044
date: June 6, 2012
memorandum to: Reviewer of 1220-0044
Office of Management and Budget
memorandum from: Anya Stockburger, Section Chief
Cost Weights Section
Branch of Revision Methodology
Division of Consumer Prices and Price Indexes
subject: Update on the Telephone Point of Purchase Survey cell phone frame planning
EXECUTIVE SUMMARY
Pursuant to the terms of clearance of the current OMB approval for the Telephone Point of Purchase Survey (TPOPS), OMB Control Number 1220-0044, this report (1) summarizes the results of a cell phone frame test conducted in FY11, and (2) provides additional information on the dual frame design being further tested in FY12.
Since its inception in 1997, the TPOPS survey has been administered exclusively using a random-digit-dial (RDD) sample drawn from a frame of landline telephone numbers. Based on the results of a recent TPOPS non-response bias analysis, the CPI program has been evaluating ways to address a perceived weakness of the current TPOPS sample design: notably, the landline sample may not be representative of all U.S. urban consumers. One mitigation strategy is to include cell phone numbers in the TPOPS sampling frame. A frame test was conducted in the third quarter of FY11 to study the quality of a cell phone frame, the feasibility of administering the survey to cell phone users, and the willingness of cell phone users to respond. The resulting response rate was 18%, less than half of the response rate observed from the landline sample.
The percentage of households without landline service is increasing as cell phone use becomes more widespread. According to the National Health Interview Survey (NHIS), the percentage of U.S. households classified as ‘wireless only’ has increased from less than 5% in 2003 to over 30% in 2011 .1 This statistic alone calls into question the long term viability of a landline only RDD sample, and suggests that cell phone numbers be added to the frame in the near future .
Because of uncertainty regarding cost, the BLS plans to begin administering the survey on a dual frame during the third and fourth quarters of FY12 to collect additional information on response rates. If the dual frame were implemented in full-scale production, BLS estimates TPOPS data collection costs would increase by 1% to 20%, depending on the response rate observed in returning cases in the cell phone frame. After response rates are confirmed using FY12 data, dual frame data collection costs will be more accurately estimated.
SECTION 1: PRIOR WORK ON NON-RESPONSE BIAS
In 2009, a non-response bias analysis was done for TPOPS (See Appendix A, Nonresponse Bias in the Telephone Point of Purchase Survey, Falwell and Saxton, April 4, 2009). The analysis concluded, based on a comparison between the demographics reported in the American Community Survey (ACS) and the TPOPS, that the youngest cohorts were underrepresented in TPOPS. To a lesser extent, people of Hispanic origin were underrepresented as well as Black/African Americans.2 These data show a potential coverage bias in the survey frame.
SECTION 2: CELL PHONE TEST RESULTS FROM FY11
Outlet Questions in the Consumer Expenditure Interview Survey
A coverage bias will only result in an outlet bias if the underrepresented populations shop at different outlets than the overrepresented populations. In order to assess the outlet bias, during the second quarter of 2011, several questions were added to the Consumer Expenditure Interview Survey (CE) to collect outlet information for broad categories of items. The five categories asked were groceries, apparel, electronics, restaurants, and music. Analysis using phone bills as a proxy for types of phones used in the household was performed to assess overlap of reported outlets between the cell phone only households and households with a landline only or a combination of landline and cell phones. The 315 outlet names reported in the CE test are compared to outlet names reported in TPOPS, and the results are summarized in the table below.
Table 1 Overlap of Outlet Name Reports by Goods/Service Category in the CE Test
Commodity/Services Group |
Overlap in the top 20 reports |
Overlap of all reports |
Groceries |
70% |
27% |
Apparel |
70% |
20% |
Electronics |
75% |
24% |
Music |
70% |
14% |
Food Away From Home |
65% |
10% |
Overall, the limited results of the outlet questions for different goods and services categories in the CE test questions were very similar to TPOPS. A high percentage (70 to 75%) of the top twenty reported outlets (those in the top 20 reports) overlapped between the two populations. When the complete lists of reports are compared, however, the overlap of outlet names drops into the range of 10 to 27%.
These results are based on a small sample and do not conclusively indicate whether an outlet bias in TPOPS exists. Further research is required to determine whether there is a statistically significant difference between outlets reported for cell-phone and landline users. It is especially important to continue analysis of the overlap of all reports, since the outlet selection process for the CPI is designed to be representative of all stores in the marketplace, from big, frequently reported stores to small, infrequently reported stores.
THE TPOPS Cell Phone Test
In April 2011, Census conducted a cell phone test for TPOPS on behalf of the BLS. Its main objective was to determine the hit rate3 by sample area. Secondary objectives included assessing the number of phone numbers that belong to users who have moved to different sampling areas and comparing the outlet name reports from the test to the TPOPS production data during the same time period.
The first step of the test was to determine a source of cell phone telephone numbers to use to construct the Random Digit Dialed (RDD) frame. There are several vendors of cell phone numbers at the national level, but fewer options at the local area level, the level at which the CPI selects its sample of phone numbers. The Demographic Statistical Methods Division (DSMD) at Census researched the options and determined that Wire Center data would be the most appropriate for TPOPS’ needs.
Wire Centers
A Wire Center can be thought of as the geographic area defined by all of the households and businesses that are wired to a single point or central office for their telephone service. A central office contains the telephony switches that route outgoing calls onto the US telephone network and route incoming calls to the individual residence or business. There are roughly 23,000 wire centers in the US and they are typically larger than a zip code but smaller than a county. Every wire line household and business is connected to a wire center.
New cellular telephone numbers are assigned to individuals based on the wire center where the phone activation takes place. Most (but not all) people will purchase a cellular telephone near where they live. The cellular thousand series blocks that are “homed” to a particular wire center can be identified. This provides the ability to define cellular sample frames smaller than state or area code. An advantage of doing this is increased efficiency of cellular samples. However, the sample will exclude people who may reside in these target wire centers who have a cellular telephone number that is “homed” to a wire center outside of the target geography. In addition, people may be contacted that no longer live in the target geography but have kept their cellular telephone number. Research by Arbitron “suggests that in 2005 approximately one-sixth of cell phone only subscribers lived outside the metropolitan area associated with their rate center.”4
Using Wire Center data was effective in most CPI PSUs, but problematic in some of the smaller PSUs in which there is not a single wire tower. In these instances, phone numbers from wire towers in adjacent counties are used by the TPOPS. Hence, geographic screen outs for these small PSUs were expected to be higher.
To estimate expected hit rates for the CPI PSUs, a sample of 200 phone numbers was drawn for most PSUs in the CPI. (450 cell phone numbers were drawn for New York, Chicago and Los Angeles, i.e. 225 numbers were drawn for each half sample and 400 were drawn for small areas with no wire centers within their boundaries) Additionally, 25 landlines were added to the sample for New York City and its suburbs for a total of 100 landline calls to test the landline path in the instrument, described below. In total, 19,300 calls were made. Respondents were asked the same set of commodity questions or POPS groups as the production sample for each PSU.
Instrument Changes to Accommodate Cell Phone Respondents
With the ultimate goal of developing a single data collection instrument to support the dual frame design, the TPOPS test instrument needed to be modified to accommodate both cell phone and landline respondents. Because phone numbers pulled from both the landline and the cell phone frames were called in the test, a variable was added to the instrument to be able to track the source of each phone number. The first question, regardless of the frame source, was asked to determine if the respondent was using a cell phone or a landline phone. This allowed different paths for different types of phone service and allowed the interviewer to ensure cell phone respondent safety early in the interview. The paths merged for respondents regardless of whether they answered on a cell phone or a landline phone when the geography screening questions were asked.
Movers
Evidence suggests that when cell phone owners move to a different area, they often keep their phone numbers. To assess the impact of this phenomenon on the TPOPS, the test instrument was designed to follow respondents that moved to a different CPI PSU. Of the 1,803 completed or partially completed interviews in the test, 312 or 17.3% of respondents had moved to a different CPI PSU than the PSU for which they were selected. Of the 19,300 total telephone calls made, 1,104 respondents (5.72%) had moved to a non-CPI area and were screened out. Because of these dramatic results, the inclusion of respondents that moved to a different CPI PSU became an objective of implementation.
Results of the Cell Phone Test
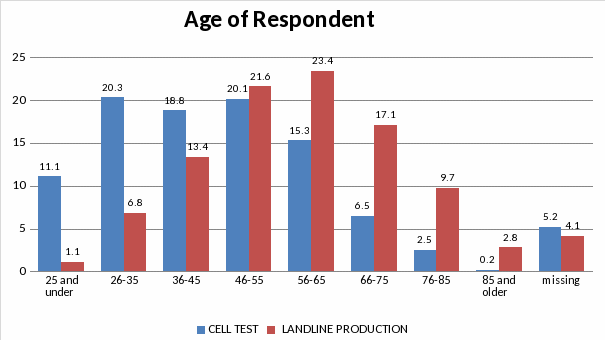
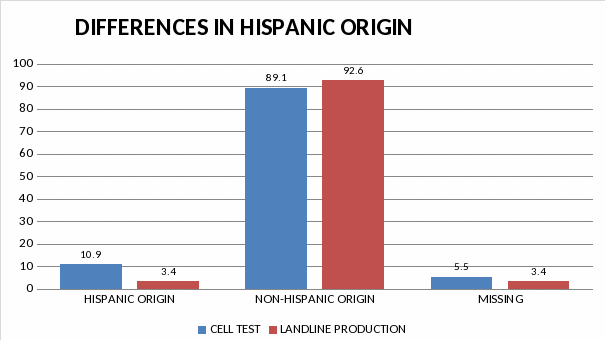
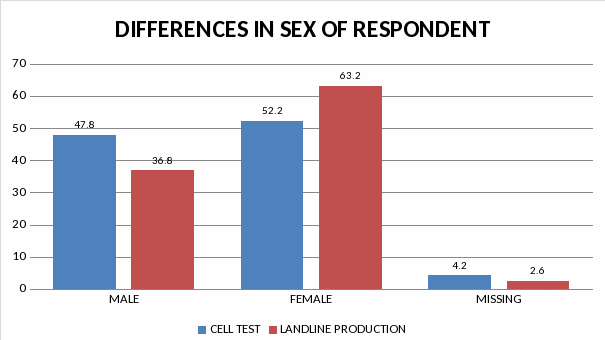
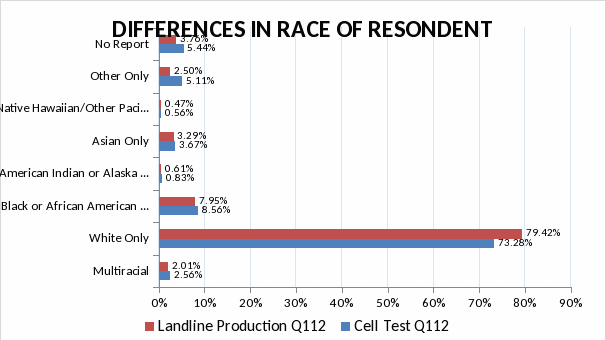
Out of the 19,300 telephone numbers that were called, 1,805 resulted in productive interviews. After accounting for ineligible phone numbers, the overall response rate was 17.55%. The response rate by PSU ranged from 0% in some of the smaller PSUs to 30.6% in B352, Beaumont, TX. The following tables show the differences in demographics between the cell phone test and regular TPOPS productive interviews.
Table 2 Age comparison between the cell phone test and TPOPS production, Q112

Table 2 shows that the younger cohorts are much better represented in the cell phone test. Similarly, older cohorts are well represented in the TPOPS landline only production.
Table 3 Origin of respondent comparison between the cell phone test and TPOPS production, Q112

Table 4 Sex of respondent comparison between the cell phone test and TPOPS production, Q112

Table 5 Race of respondent comparison between the cell phone test and TPOPS production, Q112

SECTION 3: PLANS FOR THE DUAL FRAME DESIGN IN TPOPS
The survey considerations for the inclusion of cell phone frame cases in the TPOPS’ production sample in Q122 and Q123 are: (i) changes to the instrument to accommodate returning cases, (ii) weighting (including special handling of respondents that moved from the PSU for which they were initially selected), (iii) target number of interviews by frame, and (iv) cost.
The TPOPS Instrument
While the instrument changes for the cell phone test provide paths for cell or landline phone respondents, they were designed only for the first interview with a respondent. The instrument needed to be changed to support interviews two through four and to handle respondents that had moved since their first contact. Census updated the instrument to address all of these concerns. See Appendix B TPOPS Requirement for Q122—Implementation of the Cell Phone Frame in Production for a detailed explanation of these instrument changes.
Weighting
The Demographics Statistical Methods Division at the Census Bureau developed the methodology for weighting TPOPS’ dual frame design. It was chosen to maximize each contact that is made, specifically to increase the number of eligible cases. When implementing a dual frame RDD telephone survey, there are several general weighting methodologies that can be considered.5 One method is to implement a dual frame survey without overlaps. Using this methodology, phone numbers from both frames are called, but dual users are screened out in one frame to simplify weighting. For example, if you contacted a respondent by cell phone and they indicated that they also had a landline number, they would be out-of-scope because they would have a chance of being selected in the landline frame. This way is simpler, but inefficient given the most expensive aspect of an RDD telephone survey is contacting a respondent. The second method is a survey with overlapping RDD frames. In this method, all respondents are interviewed regardless of the household’s telephone service. After determining the types of telephone service that the household has, the overlap between the two frames can be estimated and weighting adjustments can be made to account for it. This method is better for the TPOPS because considerable time, cost, and effort are spent contacting respondents due to the high screen out rate of cell phone numbers.
To maximize each contact, the new TPOPS’ design will follow respondents if they move from the PSU for which they were selected to another CPI PSU. Because the TPOPS is a sample survey and not a complete census, we can use the first stage probability of selection (selection of PSUs within the US) of the location for which they were originally selected for weighting, but apply weighting adjustments for the PSU in which they live.
More information regarding the TPOPS dual frame weighting methodology can be found in Appendix C “2011 Telephone Point of Purchase Survey: High Level Discussion of Weighting for a Landline and Cell Phone Sample Design, November 14, 2011.
Sampling—Target Methodology
To determine the target number of completed interviews by frame, the targets have been calculated at the Primary Sampling Unit (PSU) level based on NHIS data regarding telephone usage in households. The BLS adopted a conservative approach to minimize the more expensive cell phone frame by using the percent of households that were identified as cell phone only at the state level. This percentage was applied to the total number of desired interviews at the PSU level to determine the amount of the sample to dedicate to the cell phone frame. This resulted in a 25%/75% cell phone to landline frame split overall (although at the PSU level, the split ratios vary widely. See Appendix B TPOPS Requirement for Q122—Implementation of the Cell Phone Frame in Production.
If continued, it is proposed that cell phone numbers would be gradually introduced in production for first interviews over four quarters. The cell phone sample would not be fully implemented until four quarters of production have occurred. The full scale implementation would be reached in Q131.
Small PSUs
In several smaller B and C size PSUs, the test resulted in hit rates below 5%, and in three cases the hit rate was 0%. See Appendix D POPS Cell Phone Progress Report. In these PSUs, the cell phone frame sample will be increased to reach our target number of cell phone interviews. Using additional data from the third and fourth quarter of FY12 will allow a more accurate sample size to be established.
Costs
Analysis based on limited data from the Cell Phone Test shows that adding a cell phone frame to the TPOPS design will increase costs to some extent. Because of the uncertainty associated with the cost estimates, the BLS used funds carried over from FY11, $400,000 to include a dual frame design for two quarters in FY12. Once more data are available, response rates can be determined and costs can be estimated with a greater degree of accuracy. Options for continuing the dual frame in FY13 can be evaluated will depend on the cost estimates. At this point, it is premature to discuss the various options without knowing the full cost of the dual frame.
CONCLUSION
The TPOPS Cell Phone Test conducted in the second quarter of 2011 showed that while including a cell phone frame will mitigate the observed underrepresentation of some demographic cohorts, the degree to which this coverage bias contributes to a bias in outlet reports remains unclear.
Test questions added to the Consumer Expenditure Interview Survey collected information about outlets and showed that while many of the top twenty outlet names were reported for both test populations—cell phone only and landline only or both cell phone and landline, the overlap by category varied between 10 % and 27%. Because of the small sample size of the cell phone only cohort in the CE test, however, statistical conclusions cannot be drawn.
The TPOPS’ survey weighting strategy for the new design attempts to maximize both frames while minimizing survey costs. By following respondents that move from the PSU for which they were selected, the sample is more efficient.
The use of the new instrument and the inclusion of production cell phone cases for further evaluation will take place in the field during the third and fourth quarter of FY12. It is expected that the overall response rate will decrease. The data collected in FY12 will be used to evaluate whether reducing coverage bias will improve TPOPS’ results overall.
Research and evaluation of TPOPS is continuing to indentify other ways to improve estimates such as using more secondary sources as outlet frames for the CPI and considering a multi-mode approach to data collection.
1 “Wireless Substitution: Early Release of Estimates The National Health Interview Survey, January-June, 2011” by Stephen J. Blumberg, Ph.D and Julien V. Luke.
2 Age comparison: TPOPS under 35—11.2%; ACS under 35—21.8%; TPOPS Hispanic origin—8.8%; ACS Hispanic origin—13%; TPOPS Black or African American—7.4%; ACS Black or African American—13.6%, 2007.
3 The hit rate is the number of completed usable interviews divided by the number of selected phone numbers.
4 “Guidelines and Considerations for Survey Researchers When Planning and Conducting RDD and Other Telephone Surveys in the U.S. with Respondents Reached via Cell Phone Numbers”, AAPOR Cell Phone Task Force, April, 2008.
5 AAPOR Cell Phone Task Force, April 2008.
| File Type | application/vnd.openxmlformats-officedocument.wordprocessingml.document |
| Author | saxton_m |
| File Modified | 0000-00-00 |
| File Created | 2021-01-28 |
© 2026 OMB.report | Privacy Policy