Veterans_Burial_Benefits_Survey_Justification_B - NCA Response 13022013_2
Veterans_Burial_Benefits_Survey_Justification_B - NCA Response 13022013_2.docx
NCA Emerging Burial Needs Survey
OMB: 2900-0792
B. Collections of Information Employing Statistical Methods
1. The Respondent Population:
The objective of this collection is to measure the attitudes of the approximately 22 million U. S. Military Veterans towards potential new service offerings by the NCA. The respondent pool is comprised of a VA-owned database that has mailing addresses and other information for the vast majority of those Veterans. It is comprised of 20M+ Veteran records. The input data for the database came from VA and Department of Defense (DoD) databases and is supplemented with other the databases purchased from commercial source. This database is updated at regular intervals. To ensure the accuracy of the demographic information used in the sampling plan, we also use the 2011 Veteran Population Model. VetPop2011 is an actuarial projection model developed by the Office of the Actuary (OACT) for Veteran population projection from Fiscal Year (FY) 2011 to FY2040. Using the best available Veteran data available at the end of FY2010, it uses data from VA, DoD, and U.S. Census Bureau as inputs to forecast the Veteran population. VetPop2011 generates the number of Veterans by selected characteristics: at the state and/or national levels by Age, Gender, Period of Service, Race/Ethnicity, Rank (Officer/Enlisted), and Branch of Service.
Age Group |
18-39 |
40-59 |
60-79 |
80+ |
Total |
||||||||||||
Gender |
M |
F |
M |
F |
M |
F |
M |
F |
M |
F |
|||||||
MSN |
|
|
|
|
|
|
|
|
|
|
|||||||
1 |
471,865 |
101,881 |
1,197,092 |
190,849 |
1,968,585 |
69,250 |
665,341 |
27,908 |
4,302,883 |
389,888 |
|||||||
2 |
567,409 |
129,480 |
1,483,855 |
241,615 |
2,056,208 |
81,754 |
644,265 |
26,326 |
4,751,737 |
479,175 |
|||||||
3 |
397,084 |
84,537 |
920,831 |
147,419 |
1,238,150 |
50,955 |
351,150 |
14,770 |
2,907,215 |
297,681 |
|||||||
4 |
469,850 |
88,714 |
1,171,987 |
160,674 |
1,947,038 |
58,580 |
603,157 |
21,412 |
4,192,032 |
329,380 |
|||||||
5 |
468,577 |
97,109 |
1,096,918 |
168,159 |
1,631,112 |
68,099 |
510,555 |
27,602 |
3,707,162 |
360,969 |
|||||||
Total |
2,374,785 |
501,721 |
5,870,683 |
908,716 |
8,841,093 |
328,638 |
2,774,468 |
118,018 |
19,861,029 |
1,857,093 |
|||||||
In order to accurately represent the national population of Veterans, the research team will employ proven scientific survey sampling methods. Specifically, we will take a stratified random sampling approach, a method of sampling in which the population is divided into smaller groups, or strata, based on individual characteristics of interest. A random sample is then taken from each stratum. Stratified random sampling ensures that there will be sufficient numbers of Veterans in each of the categories to provide statistically significant results, allowing much greater precision than a simple random sample of all Veterans. A simple random sample might result in the underrepresentation in one or more categories, reducing the number of significant results that analysts could draw from the data.
The sampling frame and demographic data provided by NCA will allow us to use the following as sampling strata:
Geographic region (Memorial Service Network)
Gender
Age
We anticipate that the inclusion of these strata will provide important insights. The five Memorial Service Networks have slightly different processes, potentially altering preferences or even awareness of options. Any analysis must take this potential regional variation into account. Second, stratifying the sample by gender will ensure a sufficient number of women Veterans are sampled. Finally, age is also essential for understanding Veteran preferences and likely predicts the extent to which Veterans have thought about their own burial plans. The research team recommends this last variable due to the strong correlation between age and consideration of burial plans revealed in the 2008 report “Evaluation of the VA Burial Benefits Program.”
Other information on the Veterans, including details of their military service, their ethnicity, year of birth, marital status, and religious affiliation, will be collected and measured in the survey responses. While these variables will not be used as sampling strata, they will be used to more accurately describe the respondents. They will not be used for conclusions about the Veteran population as a whole.
Focus group and structured interview participants will be selected from survey respondents. Using the survey as a contact mechanism, we will ask for volunteers to participate in the qualitative data collection (i.e., by participating in a focus group or structured interview). Due to logistical limitations, the actual participants will be selected across ten sites, two in each of the five Memorial Service Networks. Every attempt will be made to replicate the demographics of the sample frame. However, the demographics of the focus groups and structured interviews will be constrained by the pool of Veterans who indicate a willingness to be contacted for further participation in this project.
In the following sections, we review the selected sampling strata in detail.
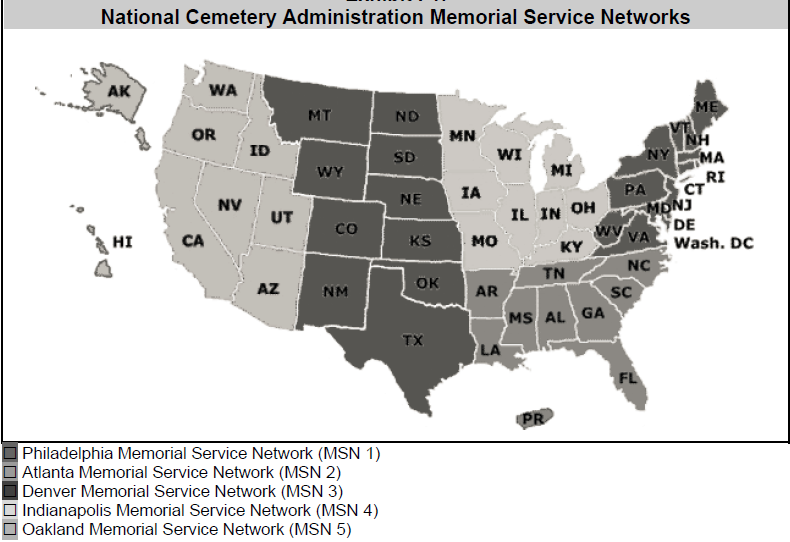
Memorial Service Networks
The five Memorial Service Networks (MSN) are:
Philadelphia Memorial Service Network
Atlanta Memorial Service Network
Denver Memorial Service Network
Indianapolis Memorial Service Network
Oakland Memorial Service Network
Stratifying our sample based on these networks ensures geographic coverage in the sample. The five MSNs cover all 50 states and are depicted in below.
 Gender
A further sampling stratum, gender, will ensure enough women participate in statistically significant numbers. Information from the VA suggests that women represent less than 10 percent of the national Veteran population1. A sample that did not stratify by gender would risk receiving a very low proportion of responses from women.
Age
Most social science survey research controls for variation in the age of respondents as age is an important predictor of attitudes and behaviors. A variable used in previous NCA research to indicate service period (i.e. World War II, Korean War, Vietnam War, Gulf War and Peacetime) has proven to have both advantages and disadvantages. For example, Veteran respondents who served in more than one service period may be unsure how to categorize themselves. Further, analyses using this variable reveal that Veterans who served during a particular period do share common attitudes and behaviors, but any underlying correlation between attitudes and age is impossible to ascertain. Thus, stratifying the present sample by age will tease apart any conflation of period of service and age and will demonstrate how age correlates with Veteran burial preferences. The recommend age thresholds are:
20-39
40-59
60-79
80+
Stratifying the sample by age will capture Veterans with varying family structures, living circumstances, and income. Generally, the topic of burial preferences becomes more salient as people age, or is considered more often – for example, a previous NCA study showed that World War II and Korean conflict Veterans were twice as likely to have thought about interment options as Gulf War Veterans.
These data have not been collected previously. However, the team calculated the sample with an expected response rate of 50 percent. Response rates for mailed surveys vary widely but depend partly on efforts to follow up with non-respondents, the subject of the survey, and its relevance to the survey population. Our team does not believe a response rate of 50 percent is unreasonable for this survey, as its subject is extremely important to the Veteran population. Efforts to maximize the response rate are described in the third section.
We will select focus group participants based on the demographic and sub-demographics groups selected for the larger survey. Particular trends uncovered in the survey data and structured interviews will be identified and the demographic groups selected for the focus groups will be designed to further explore those trends. Examples include but are not limited to:
Veterans 65 and Over
Veteran 35 and Younger
Urban Veterans
Rural Veterans
Male Veterans
Female Veterans
Service Type
Length of Service
Type of Experience: Deployment, Combat, etc.
2. Information Collection Procedures:
We calculate the required sample size in each cell by assuming a response rate of 50%, a confidence level of 95%, and a confidence interval (margin of error) of ±5. We apply a disproportionate stratification technique in order to draw sufficient numbers from cells that have few Veterans; sampling weights will be applied after data collection to correct for oversampling some cells. The disproportionate stratified random sample of Veterans is depicted below:
Age Group |
18-39 |
40-59 |
60-79 |
80+ |
Total |
|||||||||
Gender |
M |
F |
M |
F |
M |
F |
M |
F |
M |
F |
||||
MSN |
|
|
|
|
|
|
|
|
|
|
||||
1 |
768 |
765 |
768 |
767 |
768 |
764 |
768 |
758 |
3,072 |
3,054 |
||||
2 |
786 |
766 |
786 |
767 |
786 |
765 |
786 |
757 |
3,072 |
3,055 |
||||
3 |
768 |
765 |
768 |
766 |
768 |
763 |
767 |
749 |
3,071 |
3,043 |
||||
4 |
768 |
765 |
768 |
766 |
768 |
763 |
768 |
755 |
3,072 |
3,049 |
||||
5 |
768 |
765 |
768 |
767 |
768 |
764 |
768 |
758 |
3,072 |
3,054 |
||||
Total |
3,858 |
3,826 |
3,858 |
3,833 |
3,858 |
3,819 |
3,857 |
3,777 |
15,431 |
15,255 |
||||
This sample will allow estimation at a degree of accuracy that will allow NCA to update their understanding of Veterans’ satisfaction with NCA’s current services, and to understand what additional internment options might be of interest to Veterans and how they would view the inclusion of these options at the national cemeteries or other venues.
After preliminary results from the survey are analyzed for trends, the research team will conduct a series of 20 focus groups consisting of 8-12 persons. Research teams will deploy to ten locations, two in each of the five Memorial Service Network regions. Along with the focus groups, each team will conduct five structured interviews of one Veteran and his/her spouse.
3. Maximizing Response Rates and Approach to Non-Response Bias:
The table below describes both the timeline for survey deployment and the various forms of communication each potential respondent will receive. Communications are designed to maximize the response rate in three ways.
First, each Veteran is invited to take the survey multiple times, as shown in the table below. Four separate follow-ups to the initial invitation should improve response rates. Second, potential respondents are provided two ways to respond to the survey: online and by paper through the mail. The research team believes this technique will capture input from Veterans who might refuse the survey if they had only one method for response. Third, all correspondence comes from a reputable source of authority. Letters and postcards are addressed to Veterans from the Undersecretary for Memorial Affairs at the Department of Veterans Affairs. Communications also display the VA seal to assure recipients of their authenticity. More details about these three methods to maximize response rates are provided below.
Each Veteran will receive an invitation to complete the survey online, which will include a web address and logon for online survey completion. This first invitation will be followed by a second invitation, 7 days later. Two weeks after the initial contact letter, a first-wave paper survey package will be mailed to Veterans who have not participated in the online survey. It will contain a survey cover letter, informed consent letter, a paper survey and a pre-paid return envelope. A reminder postcard will follow on Day 21. Thirty days after the original pre-notification letter, a second survey package will be sent to non-respondents only. Data collection will close on Day 45. This process is detailed below.
Phase |
Description |
Timeline |
Pre-notification & Mailed Invitation Letter |
An initial contact letter will be sent via mail to all sampled Veterans to notify them of the upcoming survey and provide them a web address and logon for online survey completion. |
Day 1 |
Reminder Postcard |
A follow-up postcard will be sent to all sampled non-responders that received an initial invitation to take the survey online. This postcard will thank customers for participating in the survey, if they have done so, and remind them to promptly complete the questionnaire if they have not. |
Day 7 |
1st Survey Package |
A first-wave survey package will be mailed to Veterans who have not participated in the online survey. This package will include a survey cover letter / informed consent letter, paper survey, and a pre-paid return envelope. |
Day 14 |
Reminder Postcard |
A follow-up postcard will be sent to non-responders of the mail survey. This postcard will remind them to promptly complete the questionnaire. |
Day 21 |
2nd Survey Package |
A second-wave survey package will be mailed to non-respondents only. This mailing package will include a reminder cover letter, a replacement copy of the paper survey, and a pre-paid return envelope. The reminder letter will state that a completed survey had not been received and that returning the survey is essential for obtaining accurate results. |
Day 30 |
Completion |
Data collection closes. |
Day 45 |
The research team will set up and maintain a toll-free telephone number so respondents may make comments or ask questions concerning the survey. In addition, we will set up and maintain an appropriate postal box for returned surveys. Quality control processes are built into the survey control system, as detailed below, that will track all non-responders as well as postal non-deliverables (i.e. those that never arrive in the intended postal box and are returned to the sender). Information on these unsuccessful delivery attempts will be included in the final dataset.
The research team will establish and maintain a secure survey control system that will document the correspondence and track the status of all sample members. The heart of this system is a unique sample ID that is given to each sample member and used in place of name, address, or other personally identifiable information. All mail, phone, or other miscellaneous “white mail” (e.g., documents, notes that may be included in the return envelopes from the respondents) received will be transcribed and documented by this code in a tracking log. This process ensures that all sample members are accounted for and given the proper disposition code in line with American Association for Public Opinion Research (AAPOR) and Council of American Survey Research Organizations (CASRO) guidelines.
These methods will ultimately allow us to calculate cooperation and response rates and track problems with the survey effort. The tracking of disposition codes will allow for the creation of appropriate survey weights for eligible responders that are adjusted to account for sample members with unknown eligibility and eligible non-respondents. This will help reduce any non-response bias. In addition, the research team will use analytical weighting adjustments derived from logistic regression models that regress the set of Veteran characteristics in VetPop2011on response status.
Participation rates for the qualitative data gathering are highly dependent on the mail/online survey participation rates. We assume 5% of the 15,000 survey respondents, or approximately 750, will volunteer to participate in either the focus groups or structured interviews. This will allow sufficient redundancy to ensure we are able to fully populate the focus groups while maintain the demographic and geographic diversity envisioned in the qualitative sampling plan.
4. Testing:
To test of the survey instrument, the research team recruited eight military Veterans to read and respond to the mail survey. Five respondents were interviewed in-person, while three returned their responses electronically. The respondents were Veterans of the Army, Marines, Coast Guard, and Navy whose terms of service had ranged from 5 to more than 30 years. Each respondent was asked to fill out the survey and provide their interpretation of survey language as they proceeded. They were also prompted to describe their subjective views of the purpose, clarity, and respectfulness of the survey. Respondents suggested changes to the survey instrument and cover letter that improved its utility and minimized burden.
Similarly, the focus group and structured interview guides will be tested and revised during the preparations for the qualitative data gathering. As part of the training process for the interview teams, the research team will conduct two live focus groups using contractor personnel to ensure the questions guide elicit the responses from the participants.
5. Contact Information:
Please direct any questions regarding this project to Shane Nelson, 240-314-5614, Nelson_Shane@bah.com or Greg Matthews, 703-902-5526, Matthews_Gregory2@bah.com.
1 Womens Veteran Population Fact Sheet. November 2011. www.va.gov/WOMENVET/WomenVetPopFS1111.pdf
| File Type | application/vnd.openxmlformats-officedocument.wordprocessingml.document |
| Author | 554206 |
| File Modified | 0000-00-00 |
| File Created | 2021-01-29 |
© 2026 OMB.report | Privacy Policy