Q1 FY2012 Response Analysis
2900-0751 Q1 FY 2012 Supplier Perception Survey Responder Analysis.doc
Department of Veterans Affairs Supplier Perception Survey (SPS)
Q1 FY2012 Response Analysis
OMB: 2900-0751
![]() Q1 FY2012 Supplier Perception Survey Response
Analysis
Q1 FY2012 Supplier Perception Survey Response
Analysis
About the Supplier Perception Survey
The Supplier Perception Survey is a component of the U.S. Department of Veterans Affairs (VA) Office of Acquisition & Logistics (OAL) Supplier Relationship Transformation (SRT) initiative. This survey is one of many enterprise feedback initiatives, through which Ambit collects quantitative and qualitative information, to holistically assess VA Acquisitions Supply Chain Management policies and practices.
About this Document
This document summarizes the results of two statistical procedures conducted on survey respondents:
Chi-square goodness of fit testing for respondent representativeness
Wilcoxon Rank Sum tests results through which early and late survey respondents were compared for differences in satisfaction
Representativeness of Suppliers
Chi-square goodness of fit testing was performed on key supplier attributes to assess representativeness of suppliers who responded to the survey. As we did not have access to ‘absolute’ data that is typically contained in auxiliary data sources at the time of this analysis, empirical observations from the baseline survey conducted in Fall 2010 were utilized to inform theoretical binomial distributions of key supplier attributes, with a particular interest in large and small business designation. Table I.I contains the results of this testing.
Table I.I Chi-Square Goodness of Fit Test Results
Category |
Value |
Chi-Square Statistic |
p-value |
Large Business |
0 (Not Large Business) |
257.9 |
<.0001 |
1 (Large Business) |
|||
Small Business |
0 (Not Small Business) |
56.4 |
<.0001 |
1(Small Business) |
|||
8A Business |
0 (Not 8A) |
4.3 |
0.0389 |
1 (8A) |
|||
Woman-Owned Business |
0 (Not Woman Owned) |
16.8 |
<.0001 |
1 (Woman Owned) |
|||
HUB Zone Business |
0 (Not HUB Zone) |
1.24 |
.26 |
1 (HUB Zone) |
|||
Service Disabled Veteran Owned (SDVO) |
0 (Not SDVO) |
14.5 |
.0001 |
1 (SDVO) |
|||
Veteran Owned |
0 (Not Veteran Owned) |
.12 |
.12 |
1 (Veteran Owned) |
|||
Small Disadvantaged |
0 (Not Small Disadvantaged) |
6.2 |
.013 |
1 (Small Disadvantaged) |
With the inherent weaknesses of the approach used to inform the theoretical distribution of supplier attributes noted, significant differences were detected between the theoretical and expected distributions of many of the attributes we assessed.
However, no action could be taken to account for those differences for two reasons. First, the approach utilized to inform theoretical distributions was not considered to be ideal. Despite the results of statistical testing, it was difficult for us to conclude with confidence the validity of this assessment.
Second, other factors were noted as also being likely contributors to variation in supplier attributes:
The target population for the most recent survey was modified. In previous iterations of the survey, the target population was defined as “All VA suppliers”. Beginning with this iteration of the survey, it was defined as “VA’s top 9000 suppliers”.
Natural changes to VA’s supplier composition are expected over time. This assessment compared two cross-sections of the VA supplier base at time periods roughly 2 years apart.
As of this iteration of the survey, a new data source was utilized for sampling frame development. The data source used for all prior iterations of the survey is no longer licensed by VA. However, we were unable to conduct a direct comparison of old vs. new data sources.
Non-Response Bias
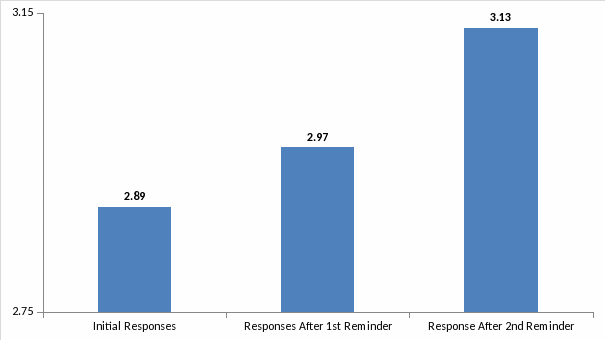
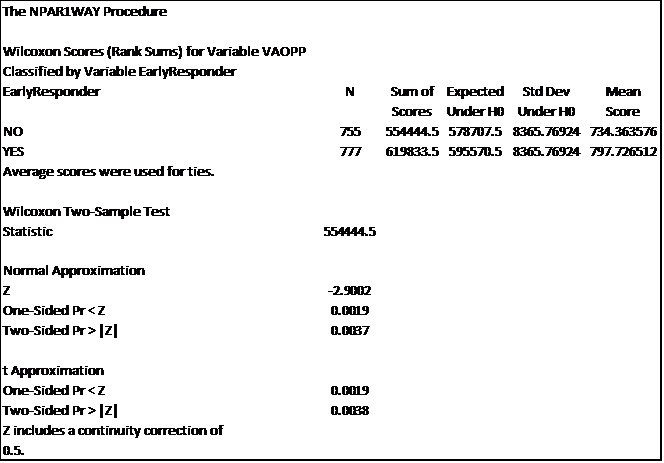
Similarly, our assessment of non-response bias was limited to a more rudimentary assessment of the relationship between ‘response time’ and respondent rating of the VA Overall Procurement Process. However, even with this more basic approach, we detected directional differences in satisfaction ratings across different responder cohorts. Chart I.I illustrates average respondent rating of the VA overall procurement process based on respondent cohort. And in Figure I.I below we confirmed a significant difference between satisfaction of the first 50% of respondents and the final 50%.
Chart I.I Avg. Satisfaction by Response Cohort

Figure I.I Wilcoxon Rank Sums Procedure
Response time and respondent satisfaction were positively associated. In this case, the use of a 2 week data collection window in which reminders were sent out to non-respondents mitigated what may have otherwise been a respondent pool heavily skewed in their perceptions toward VA.
Future Enhancements to Response Analysis
The limitations involved with our current responder analysis for the Supplier Perception Survey will be mitigated in future iterations of the survey. Additional data sources are currently being vetted that will allow for a more robust assessment of responder bias and representativeness. Additional information on the path forward is detailed in the document titled, “Enhancements to the Supplier Perception Survey Responder Analysis”.
| File Type | application/vnd.openxmlformats-officedocument.wordprocessingml.document |
| File Modified | 0000-00-00 |
| File Created | 0000-00-00 |
© 2026 OMB.report | Privacy Policy
