CFI 203 DOC NOAA NWS CO-OPS questionnaire
American Customer Satisfaction Index
CFI 203 DOC NOAA NWS CO-OPS questionnaire
CFI 199 DOT FAA Air Carrier OM, CFI 200 DOT FAA Air Carrier & Repair Station, CFI 201 DOT FAA Manufacturers, CFI 202 PBGC Retirees, CFI 203 DOC NOAA NWS CO-OP
OMB: 1090-0007
NOAA National Ocean Service
Center for Oceanographic Products and Services (CO-OPS)
Customer Satisfaction Survey 2009
![]()
Introduction
The National Oceanic and Atmospheric Administration’s (NOAA’s) National Ocean Service (NOS) Center for Operational Oceanographic Products and Services (CO-OPS) is deeply committed to serving the needs of all of its customers. For over 200 years CO-OPS and its predecessors have gathered data along our nation’s coasts and turned those data into meaningful information to protect life, property, and the environment. CO-OPS wants to determine how satisfied users are with their products and services, and would appreciate your feedback. The purpose of this survey, conducted in partnership with the federal government as part of the American Customer Satisfaction Index, is to help CO-OPS improve its water level and tidal current products and services for you.
Your answers are voluntary, but your opinions are very important for this research. Your responses will be held completely confidential, and you will never be identified by name. CFI Group, a third party research and consulting firm, is administering this survey via a secure server. The time required to complete this survey will be dependent on how certain questions are answered, but it will likely take approximately 15 minutes, and is authorized by Office of Management and Budget Control No. 1090-0007.
Please click on the “Next” button below to begin the survey.
SURVEY PART I
![]()
Information About You
Scaled questions to include “don’t know/not applicable” response options.
The following questions are intended to help us better understand your responses by allowing us to classify responses by geographic area and by type of users. As with the entire survey, your responses are completely voluntary.
What is your postal zip code?
Do you use CO-OPS for: (check all that apply)
a) Marine and coastal products and services
b) Great Lakes products and services
c) Other:______________(specify)
Which of the following sectors do you represent? (select one)
Commercial Shipping
Professional Pilot
Recreational Boating
Private Consultant/Engineer
Academia
K-12 Education
Federal Government
Military
State and Local Government
Utilities/Water Management
Other (please specify)
What is the nature of your primary activity?
Freight transport
Professional Pilot
Passenger transport
Commercial fishing
Law enforcement
National defense
Search and rescue
Dredging
Recreational boating/fishing
Tourism
Research
Coastal resource management
Coastal resident
Other (please specify)
Where is your primary geographic area of interest/operating area?
East Coast
Gulf Coast
West Coast
Alaska
Pacific
Caribbean
Great Lakes
Other (please specify)
6) By what means do you receive CO-OPS information? (Select all that apply)
PORTS Web pages
CO-OPS Web pages other than PORTS
Non-CO-OPS Web pages
Automated phone system
Personal communication with CO-OPS via phone or email
Printed media (e.g. Tide and Tidal Current Tables)
Private Vendor
Other (please specify)
7) Using a 1 to 10 point scale where 1 means Not at all Useful and 10 means Very Useful, please rate the usefulness of receiving water level information in the following formats.
Text
Graphics
A combination of text and graphics
Digital (numerical information that can be downloaded)
Phone
published books and reports
8) Using a 10-point scale where 1 means Not at all Useful and 10 means Very Useful please rate the usefulness of having access to coastal information and data in the following time frames:
Past (older than 24 hours)
Real-time (newer than 24 hours to present)
Future (present to 5 days into the future)
Satisfaction with CO-OPS Products and Services
9) Have you ever had personal communication with CO-OPS staff to discuss CO-OPS
products?
a) Yes
b) No (skip to Q13
10) On a 10-point scale where 1 means Poor and 10 means Excellent please rate the value of your personal communication with CO-OPS staff to discuss CO-OPS products.
11) During a typical year, how many times do you have personal communication with CO-OPS staff to discuss CO-OPS products?
1-3 times a year
4-6 times a year
7-12 times a year
More than 12 times a year
12) Please select the purpose of your personal communications with CO-OPS staff.
(select all that apply)
Explanation or interpretation of available products
Synthesize available forecast products and information for your specific needs
Get more information than available in existing products
Report a data problem
13) Using a 10-point scale where 1 means “very poor” and 10 means “excellent,” please rate the information that you receive from CO-OPS in terms of:
a) accuracy (rate on scale of 1 to 10)
b) reliability (rate on a scale of 1 to 10)
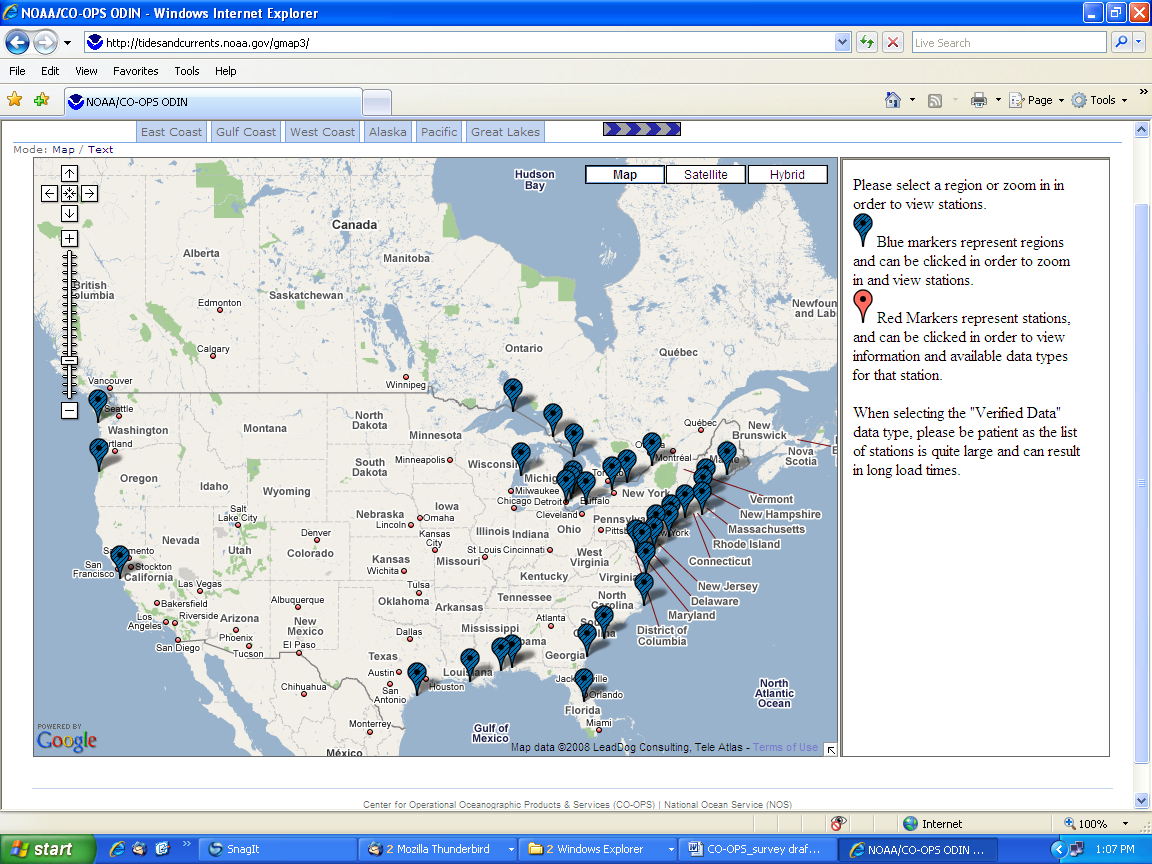
14) Above is a map that shows where CO-OPS data are available throughout the Continental US. Using a 10-point scale where 1 means Poor and 10 means Excellent, please rate the map on the following:
Visual appeal
Ease of understanding
Ease of use
Allows me to find the information that I need
Questions for Great Lakes users
G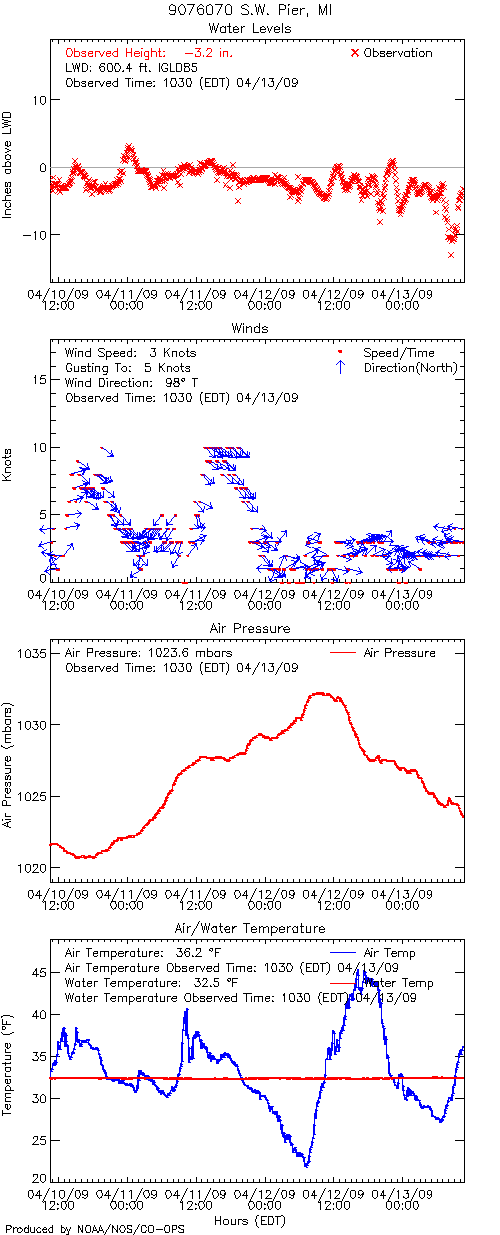 1a)
During the last 12 months, please indicate the frequency with which
you have used CO-OPS Great Lakes Online products.
At least once per day
Once per week
Once per month
Seasonally
Do not use
Not familiar with this information
G2a) If Usage Indicated in G1a) Referring specifically to CO-OPS Great Lakes Online products, on a 10-point scale, where 1 means Poor and 10 means Excellent, please rate the quality of the information on the following:
Clarity
Timeliness
Accuracy
Organization of information
Meets my needs
G3a) If Usage Indicated in G1a) The graph above shows near real-time water levels and meteorological data for the station at SW Pier, MI. Using a 10-point scale where 1 means Poor and 10 means Excellent, please rate the graph on the following:
Visual appeal
Ease of understanding
Tells me what I need to know about near real-time water level and meteorological data
G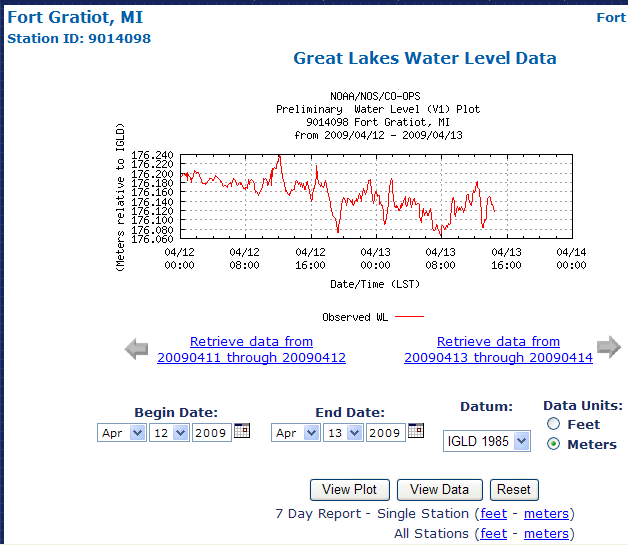
1b)
During the last 12 months, please indicate the frequency with which
you have used CO-OPS near Real-time
Water Level
(Graphic or Data Listing) products.
At least once per day
Once per week
Once per month
Seasonally
Do not use
Not familiar with this information
G2b) If Usage Indicated in G1b) Referring specifically to CO-OPS near Real-time Water Level products, on a 10-point scale, where 1 means Poor and 10 means Excellent, please rate the quality of the information on the following:
Clarity
Timeliness
Accuracy
Organization of information
Meets my needs
G3b) If Usage Indicated in G1b) The graph above shows preliminary near real-time water levels for Fort Gratiot, MI. Using a 10-point scale where 1 means Poor and 10 means Excellent, please rate the graph on the following:
Visual appeal
Ease of understanding
Tells me what I need to know about near real-time water levels
G1c) During the last 12 months, please indicate the frequency with which you have used CO-OPS near Real-time Currents (Graphic or Data Listing) products.
At least once per day
Once per week
Once per month
Seasonally
Do not use
Not familiar with this information
G2c) If Usage Indicated in G1c) Referring specifically to CO-OPS near Real-time Currents products, on a 10-point scale, where 1 means Poor and 10 means Excellent, please rate the quality of the information on the following:
Clarity
Timeliness
Accuracy
Organization of information
Meets my needs
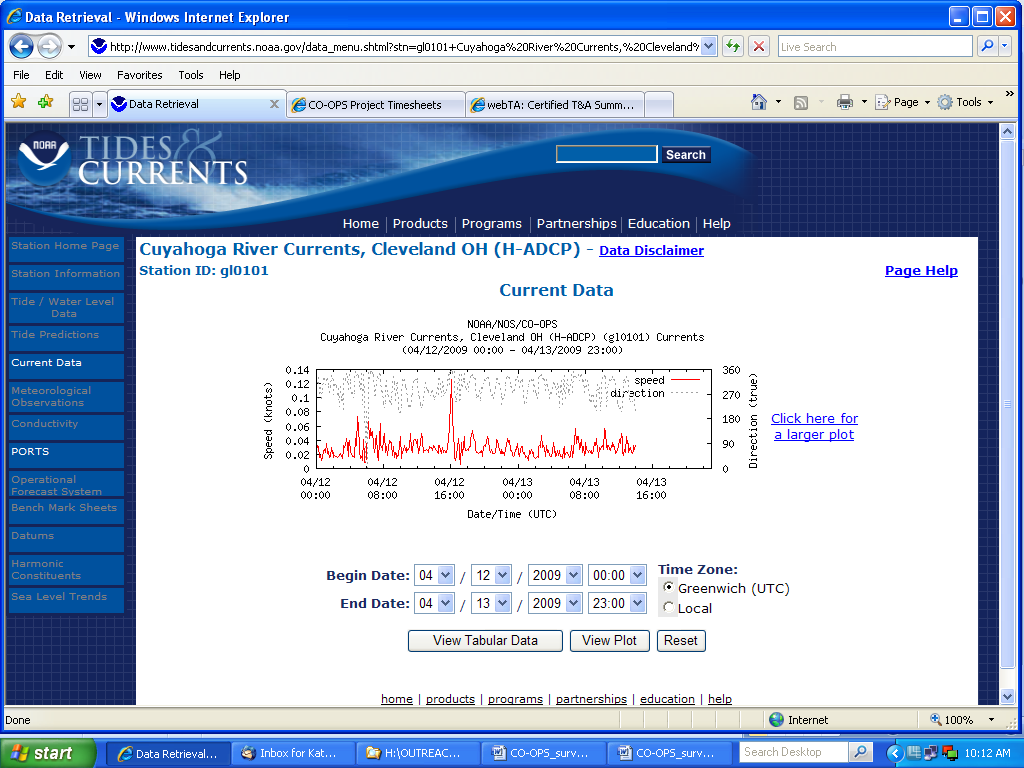
G3c) If Usage Indicated in G1c) The graph above shows preliminary near real-time currents for the Cuyahoga River, Cleveland OH. Using a 10-point scale where 1 means Poor and 10 means Excellent, please rate the graph on the following:
Visual appeal
Ease of understanding
Tells me what I need to know about near real-time currents
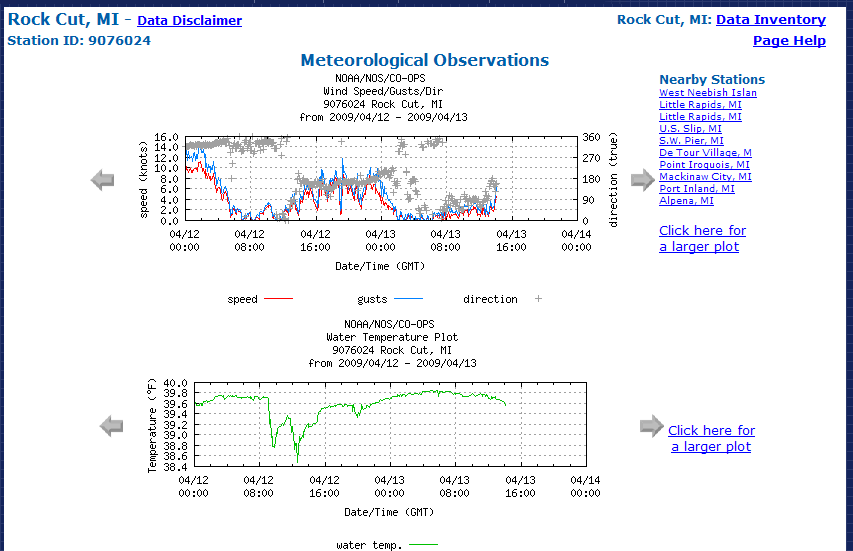
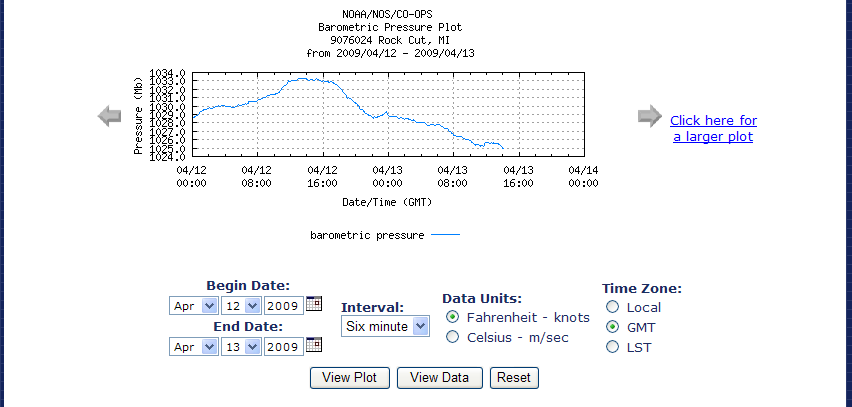
G1d) During the last 12 months, please indicate the frequency with which you have used CO-OPS near Real-time Meteorological (includes wind, air/water temperature, barometric observations) (Graphic or Data Listing) products.
At least once per day
Once per week
Once per month
Seasonally
Do not use
Not familiar with this information
G2d) If Usage Indicated in G1d) Referring specifically to CO-OPS near Real-time wind, air/water temperature, barometric observation products, on a 10-point scale, where 1 means Poor and 10 means Excellent, please rate the quality of the information on the following:
Clarity
Timeliness
Accuracy
Organization of information
Meets my needs
G3d) If Usage Indicated in G1d) The graph above shows preliminary near real-time meteorological data for Rock Cut, MI. Using a 10-point scale where 1 means Poor and 10 means Excellent, please rate the graph on the following:
Visual appeal
Ease of understanding
Tells me what I need to know about near real-time meteorological data
G1e) During the last 12 months, please indicate the frequency with which you have used CO-OPS Historical Water Level (Graphic or Data Listing) products.
At least once per day
Once per week
Once per month
Seasonally
Do not use
Not familiar with this information
G2e) If Usage Indicated in G1e) Referring specifically to CO-OPS Historical Water Level products, on a 10-point scale, where 1 means Poor and 10 means Excellent, please rate the quality of the information on the following:
Clarity
Timeliness
Accuracy
Organization of information
Meets my needs
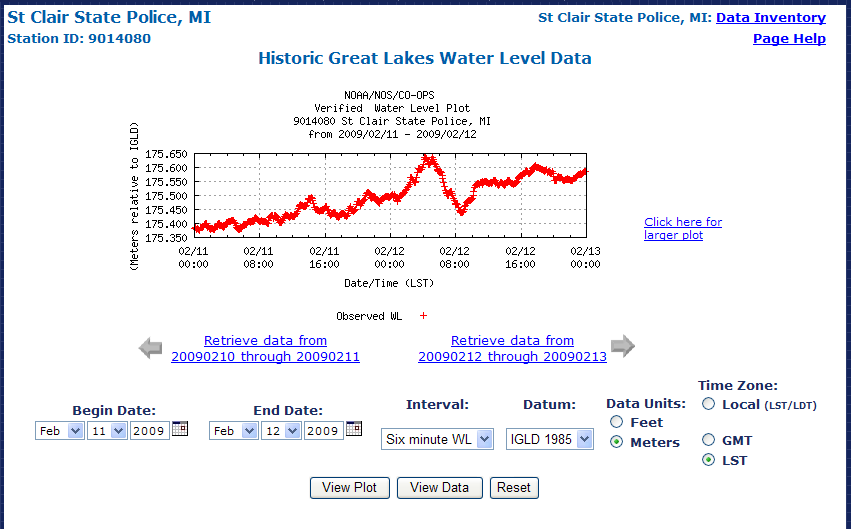
G3e) If Usage Indicated in G1e) The graph above shows historical water levels for St. Clair, MI. Using a 10-point scale where 1 means Poor and 10 means Excellent, please rate the graph on the following:
Visual appeal
Ease of understanding
Tells me what I need to know about historical water levels
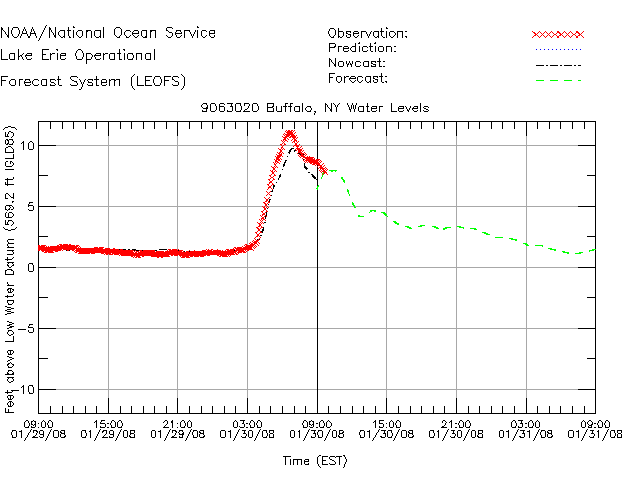
G1f) During the last 12 months, please indicate the frequency with which you have used these CO-OPS forecast products shown above provided by CO-OPS.
At least once per day
Once per week
Once per month
Seasonally
Do not use
Not familiar with this information
G2f) If Usage Indicated in G1f) Referring specifically to these CO-OPS forecast products, on a 10-point scale, where 1 means Poor and 10 means Excellent, please rate the quality of the information on the following:
Clarity
Timeliness
Accuracy
Organization of information
Meets my needs
G3f) If Usage Indicated in G1f) The graph above shows a CO-OPS forecast water level product for Buffalo, NY in Lake Erie. Using a 10-point scale where 1 means Poor and 10 means Excellent, please rate the graph on the following:
Visual appeal
Ease of understanding
Tells me what I need to know about forecast water levels
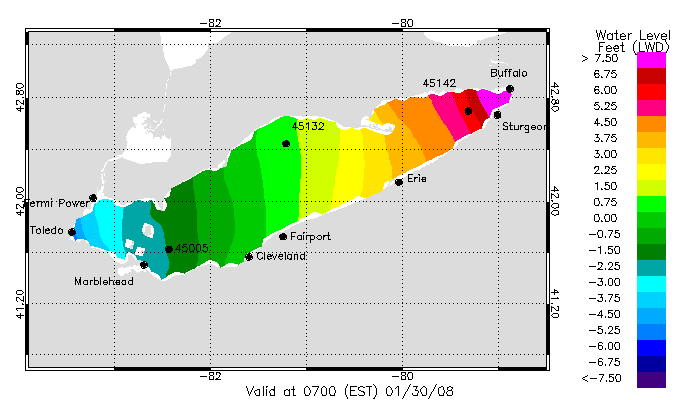
G4f) The graph above shows a CO-OPS forecast water level product for Lake Erie. Using a 10-point scale where 1 means Poor and 10 means Excellent, please rate the graph on the following:
Visual appeal
Ease of understanding
Tells me what I need to know about forecast water levels
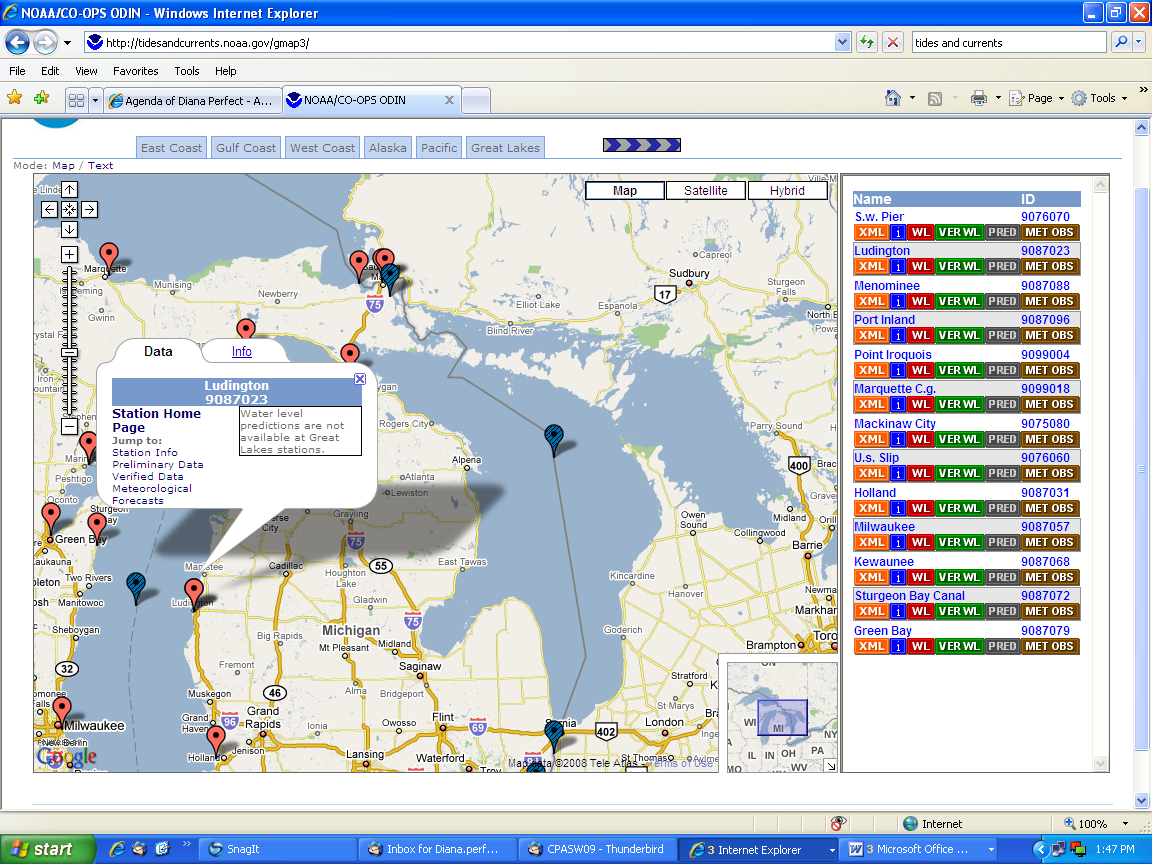
G5) Above is a map showing what information is available for some local stations in the Great Lakes regions. Using a 10-point scale where 1 means Poor and 10 means Excellent, please rate the map on the following:
Visual appeal
Ease of understanding
Ease of use
Allows me to locate the information that I need
Questions for Marine and Coastal Product Users
M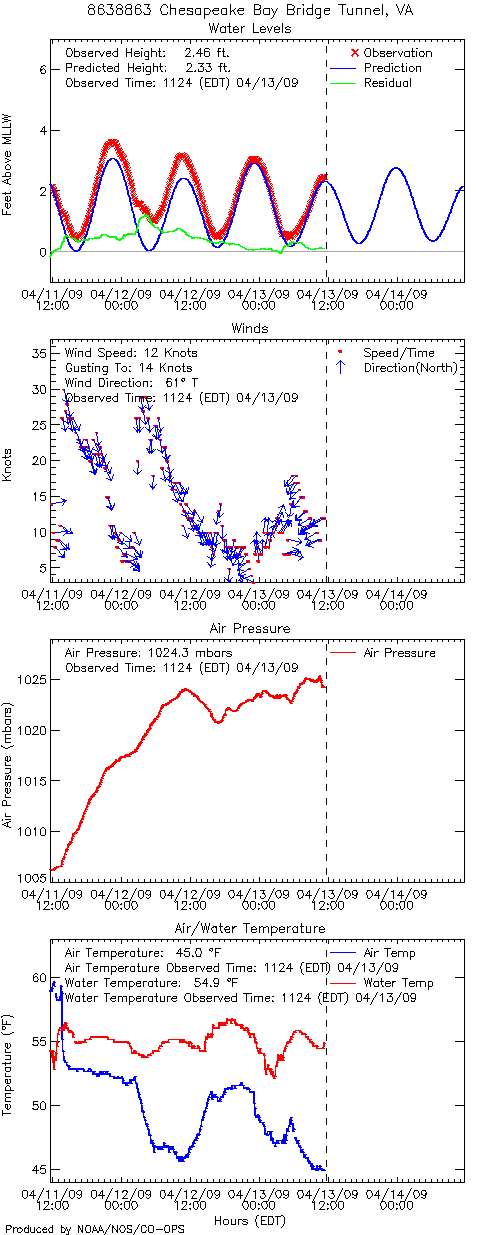 1a)
During the last 12 months, please indicate the frequency with which
you have used CO-OPS Tides Online products.
At least once per day
Once per week
Once per month
Seasonally
Do not use
Not familiar with this information
M2a) If Usage Indicated in M1a) Referring specifically to CO-OPS Tides Online products, on a 10-point scale, where 1 means Poor and 10 means Excellent, please rate the quality of the information on the following:
Clarity
Timeliness
Accuracy
Organization of information
Meets my needs
M3a) If Usage Indicated in M1a) The graph above shows near real-time water levels and meteorological data at the Chesapeake Bay Bridge Tunnel, VA. Using a 10-point scale where 1 means Poor and 10 means Excellent, please rate the graph on the following:
Visual appeal
Ease of understanding
Tells me what I need to know about near real-time water level and meteorological data
M1b) During the last 12 months, please indicate the frequency with which you have used CO-OPS Physical Oceanographic Real-Time System (PORTS®)- Currents products.
At least once per day
Once per week
Once per month
Seasonally
Do not use
Not familiar with this information
M2b) If Usage Indicated in M1b) Referring specifically to CO-OPS PORTS® Currents products, on a 10-point scale, where 1 means Poor and 10 means Excellent, please rate the quality of the information on the following:
Clarity
Timeliness
Accuracy
Organization of information
Meets my needs
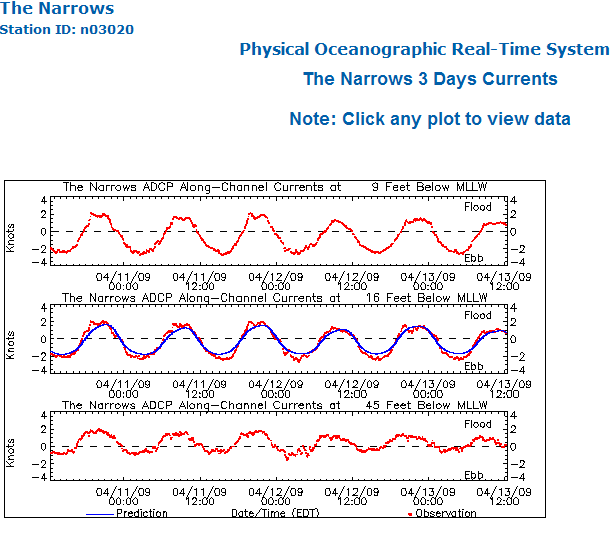
M3b) If Usage Indicated in M1b) The graph above shows near real-time currents at the Narrows in New York Harbor. Using a 10-point scale where 1 means Poor and 10 means Excellent, please rate the graph on the following:
Visual appeal
Ease of understanding
Tells me what I need to know about near real-time currents
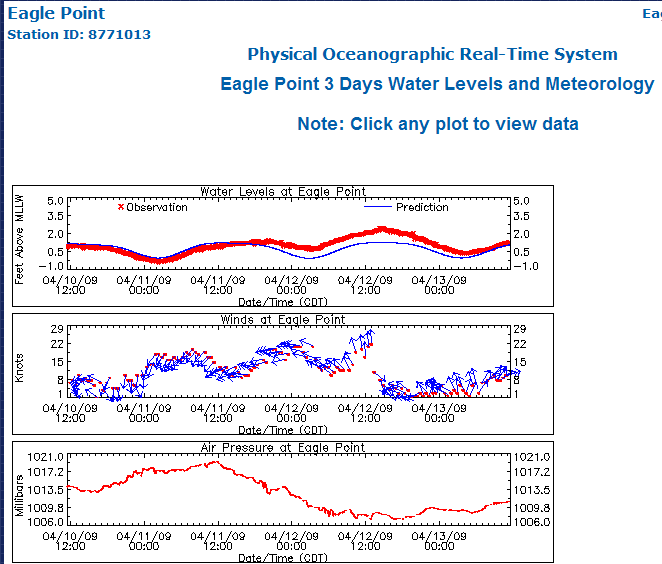
M1c) During the last 12 months, please indicate the frequency with which you have used CO-OPS Physical Oceanographic Real-Time System (PORTS®) – Water Level and Meteorological products.
At least once per day
Once per week
Once per month
Seasonally
Do not use
Not familiar with this information
M2c) If Usage Indicated in M1c) Referring specifically to this CO-OPS PORTS®) product, on a 10-point scale, where 1 means Poor and 10 means Excellent, please rate the quality of the information on the following:
Clarity
Timeliness
Accuracy
Organization of information
Meets my needs
M3c) If Usage Indicated in M1c) The graph above shows water level and meteorological observations for Eagle Point, TX. Using a 10-point scale where 1 means Poor and 10 means Excellent, please rate the graph on the following:
Visual appeal
Ease of understanding
T
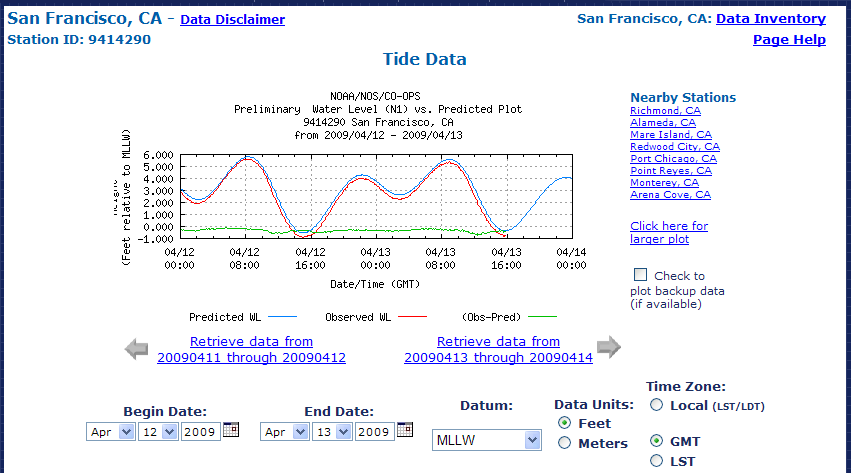
ells me what I need to know about near real-time tides and winds and pressure
M1d) During the last 12 months, please indicate the frequency with which you have used CO-OPS near Real-time Water Level (Graphic or Data Listing) products.
At least once per day
Once per week
Once per month
Seasonally
Do not use
Not familiar with this information
M2d) If Usage Indicated in M1d) Referring specifically to CO-OPS near Real-time Water Level products, on a 10-point scale, where 1 means Poor and 10 means Excellent, please rate the quality of the information on the following:
Clarity
Timeliness
Accuracy
Organization of information
Meets my needs
M3d) If Usage Indicated in M1d) The graph above shows preliminary near real-time water levels for San Francisco, CA. Using a 10-point scale where 1 means Poor and 10 means Excellent, please rate the graph on the following:
Visual appeal
Ease of understanding
Tells me what I need to know about near real-time water levels
M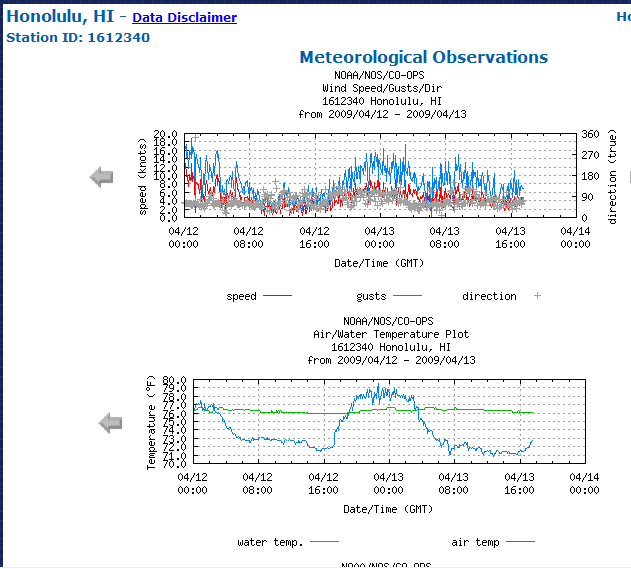 1e)
During the last 12 months, please indicate the frequency with which
you have used CO-OPS near Real-time Meteorological (including
wind, air/water temperature, barometric observations) (Graphic or
Data Listing) products.
At least once per day
Once per week
Once per month
Seasonally
Do not use
Not familiar with this information
M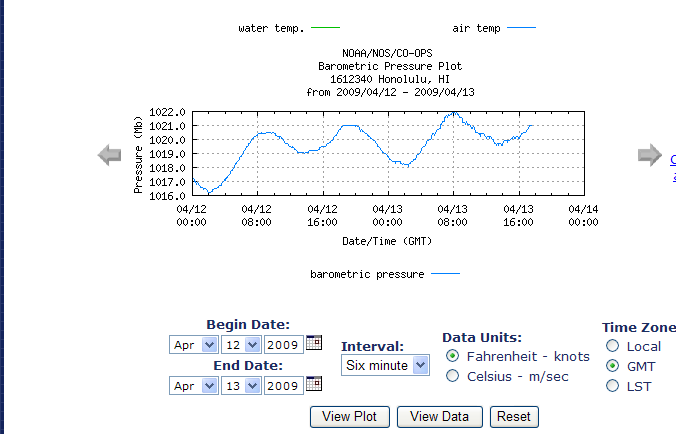 2e)
If Usage Indicated
in M1e) Referring
specifically to CO-OPS near Real-time
wind, air/water temperature, barometric observations
products, on a 10-point scale, where 1 means Poor and 10 means
Excellent, please rate the quality of the information on the
following:
Clarity
Timeliness
Accuracy
Organization of information
Meets my needs
M3e) If Usage Indicated in M1e) The graph above shows preliminary near real-time meteorological data for Honolulu, HI. Using a 10-point scale where 1 means Poor and 10 means Excellent, please rate the graph on the following:
Visual appeal
Ease of understanding
Tells me what I need to know about near real-time meteorology
M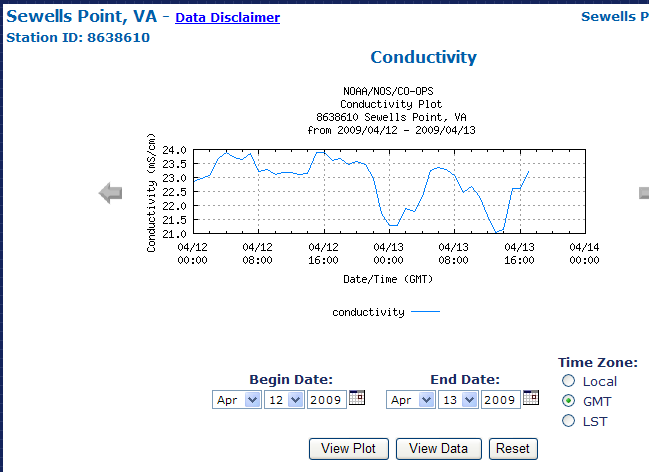
1f)
During the last 12 months, please indicate the frequency with which
you have used CO-OPS near Real-time Water Conductivity (Graphic
or Data Listing) products.
At least once per day
Once per week
Once per month
Seasonally
Do not use
Not familiar with this information
M2f) If Usage Indicated in M1f) Referring specifically to CO-OPS near Real-time Water Conductivity products, on a 10-point scale, where 1 means Poor and 10 means Excellent, please rate the quality of the information on the following:
Clarity
Timeliness
Accuracy
Organization of information
Meets my needs
M3f) If Usage Indicated in M1f) The graph above shows preliminary near real-time water conductivity data for Sewells Point, VA. Using a 10-point scale where 1 means Poor and 10 means Excellent, please rate the graph on the following:
Visual appeal
Ease of understanding
Tells me what I need to know about near real-time water conductivity information
M1g) During the last 12 months, please indicate the frequency with which you have used CO-OPS Predicted Water Levels products.
At least once per day
Once per week
Once per month
Seasonally
Do not use
Not familiar with this information
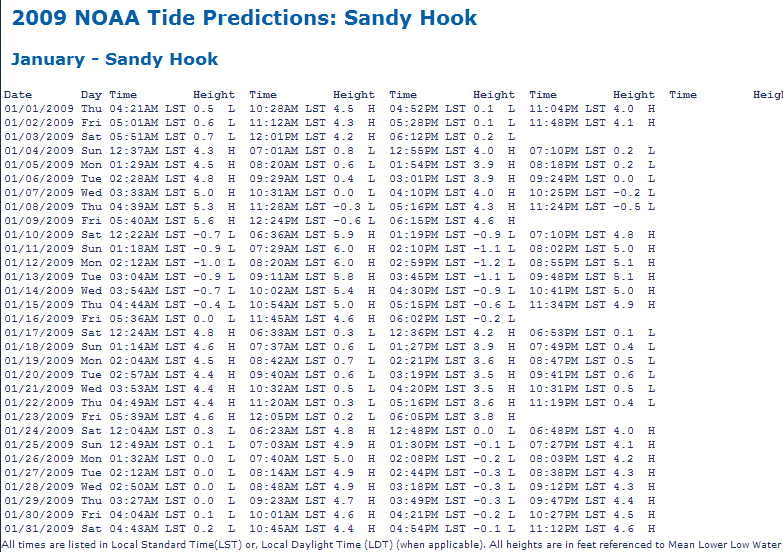
M2g) If Usage Indicated in M1g) The above table lists to CO-OPS Tidal Predictions for Sandy Hook, NJ. Using a 10-point scale where 1 means Poor and 10 means Excellent, please rate the graph on the following:
Organization of the information
Ease of understanding
Tells me what I need to know about ides
M1h) During the last 12 months, please indicate the frequency with which you have used CO-OPS Current Predictions products.
At least once per day
Once per week
Once per month
Seasonally
Do not use
Not familiar with this information
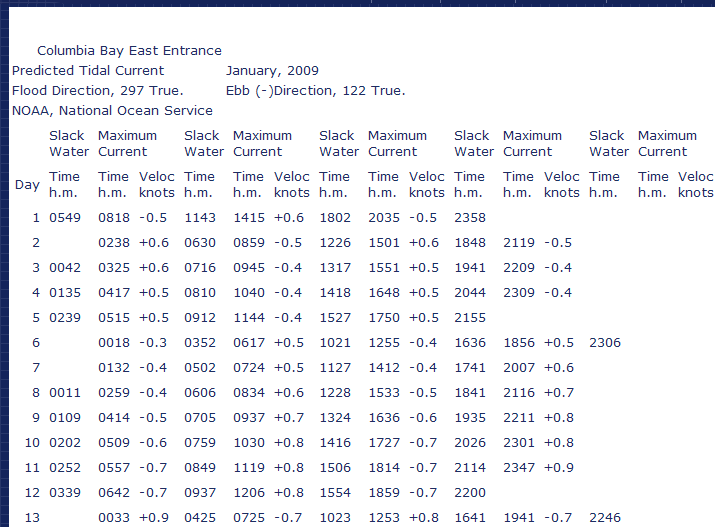
M2h) If Usage Indicated in M1h) The above table lists tidal current predictions for Columbia Bay, AK. Using a 10-point scale where 1 means Poor and 10 means Excellent, please rate the graph on the following:
Organization of information
Ease of understanding
Tells me what I need to know about tidal currents
M1i) During the last 12 months, please indicate the frequency with which you have used CO-OPS Historical Water Levels (Graphic or Data Listing) products.
At least once per day
Once per week
Once per month
Seasonally
Do not use
Not familiar with this information
M2i) If Usage Indicated in M1i) Referring specifically to CO-OPS Historical Water Level products, on a 10-point scale, where 1 means Poor and 10 means Excellent, please rate the quality of the information on the following:
Clarity
Timeliness
Accuracy
Organization of information
Meets my needs
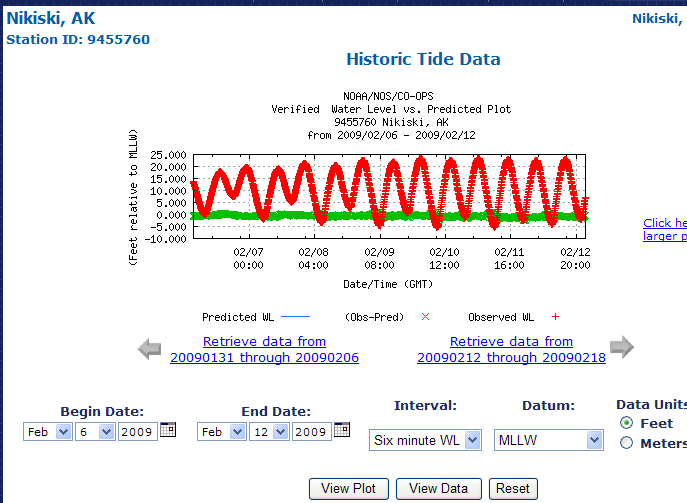
M3i) If Usage Indicated in M1i) The graph above shows historical water level for Nikiski, AK. Using a 10-point scale where 1 means Poor and 10 means Excellent, please rate the graph on the following:
Visual appeal
Ease of understanding
Tells me what I need to know about historical water levels
M1j) During the last 12 months, please indicate the frequency with which you have used CO-OPS Water Level Forecast products.
At least once per day
Once per week
Once per month
Seasonally
Do not use
Not familiar with this information
M2j) If Usage Indicated in M1j) Referring specifically to these CO-OPS forecast products, on a 10-point scale, where 1 means Poor and 10 means Excellent, please rate the quality of the information on the following:
Clarity
Timeliness
Accuracy
Organization of information
Meets my needs
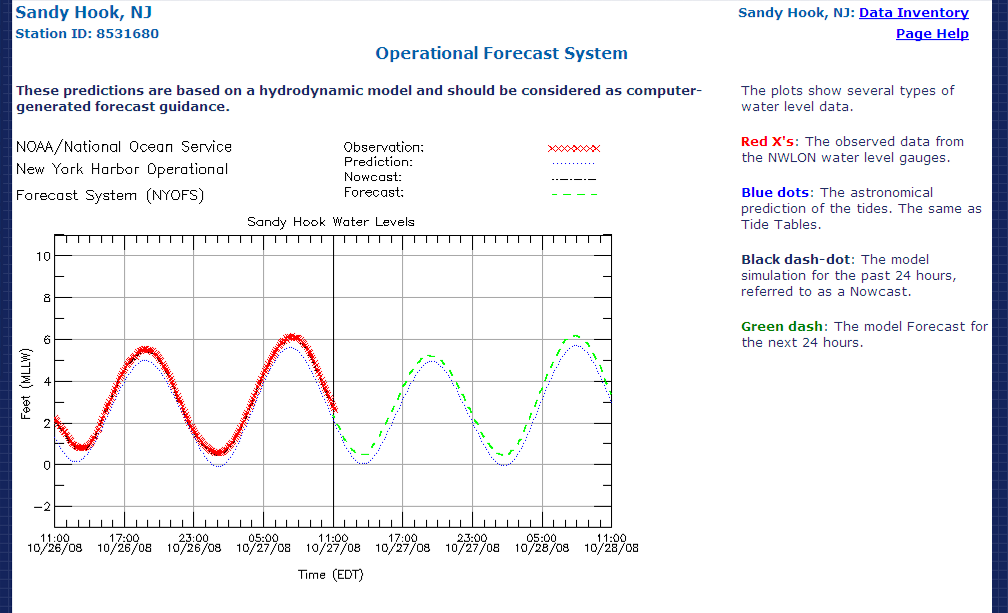
M3j) If Usage Indicated in M1j) The graph above from a CO-OPS Operational Forecast System shows observed, predicted, and forecast water level for Sandy Hook, NJ. Using a 10-point scale where 1 means Poor and 10 means Excellent, please rate the graph on the following:
Visual appeal
Ease of understanding
Tells me what I need to know about forecast water levels
M1k) During the last 12 months, please indicate the frequency with which you have used CO-OPS Current Forecast products.
At least once per day
Once per week
Once per month
Seasonally
Do not use
Not familiar with this information
M2k) If Usage Indicated in M1k) Referring specifically to these CO-OPS forecast products, on a 10-point scale, where 1 means Poor and 10 means Excellent, please rate the quality of the information on the following:
Clarity
Timeliness
Accuracy
Organization of information
Meets my needs
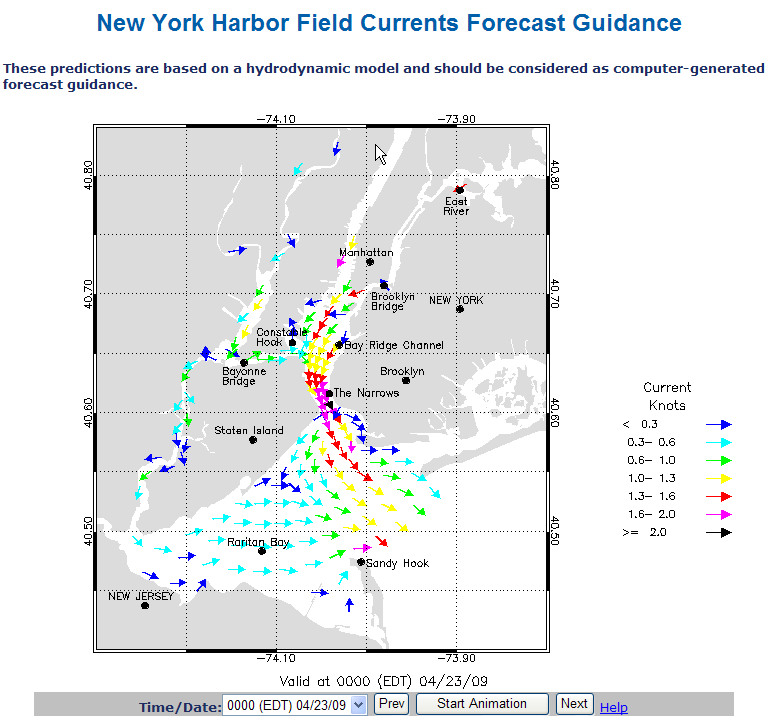
M3k) If Usage Indicated in M1k) The above map is a still image from a CO-OPS Operational Forecast System animation showing Field Currents Forecast Guidance for New York Harbor. Using a 10-point scale where 1 means Poor and 10 means Excellent, please rate the graph on the following:
Visual appeal
Ease of understanding
Tells me what I need to know about forecast currents
M1l) During the last 12 months, please indicate the frequency with which you have used CO-OPS Animated Water Level Nowcast products.
At least once per day
Once per week
Once per month
Seasonally
Do not use
Not familiar with this information
M2l) If Usage Indicated in M1l) Referring specifically to these CO-OPS nowcast products, on a 10-point scale, where 1 means Poor and 10 means Excellent, please rate the quality of the information on the following:
Clarity
Timeliness
Accuracy
Organization of information
Meets my needs
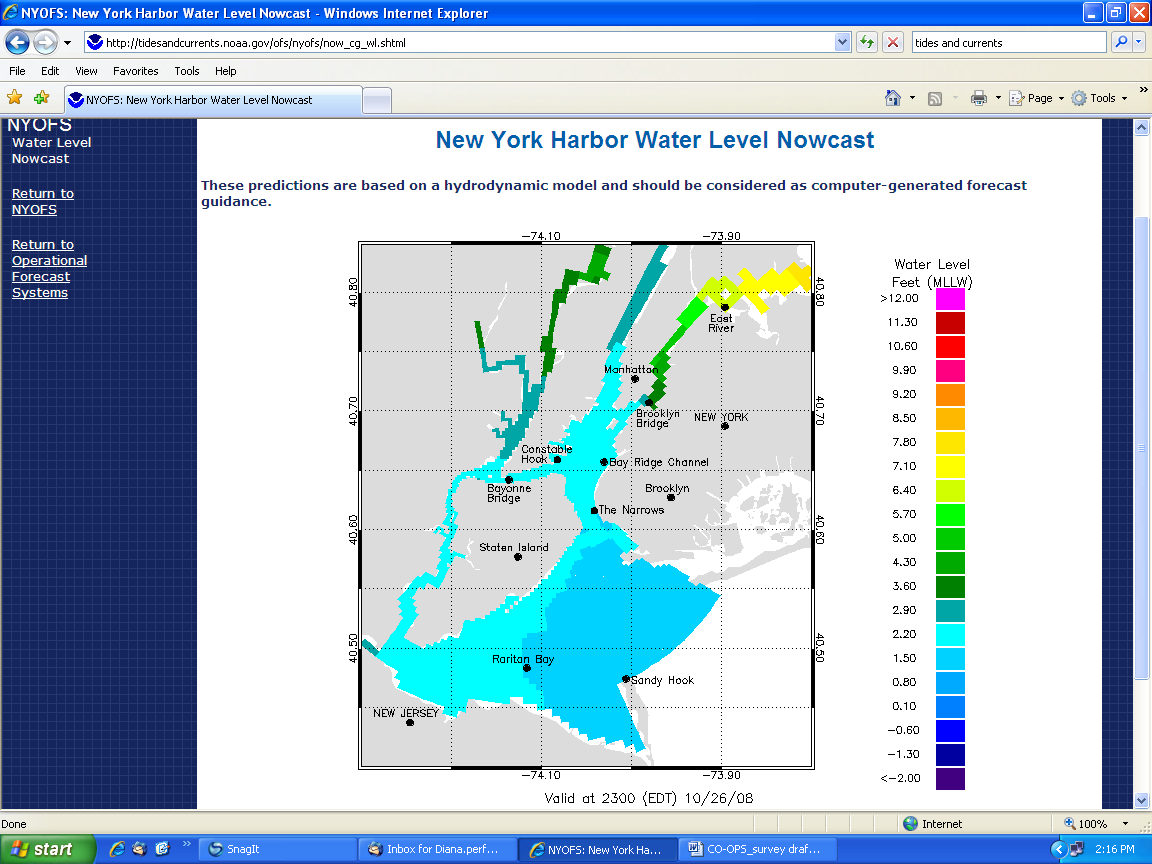
M3l) If Usage Indicated in M1l) The above map is a still image from a CO-OPS Operational Forecast System (OFS) animation showing a Water Level Nowcast for New York Harbor. Using a 10-point scale where 1 means Poor and 10 means Excellent, please rate the graph on the following:
Visual appeal
Ease of understanding
Tells me what I need to know about nowcast water levels
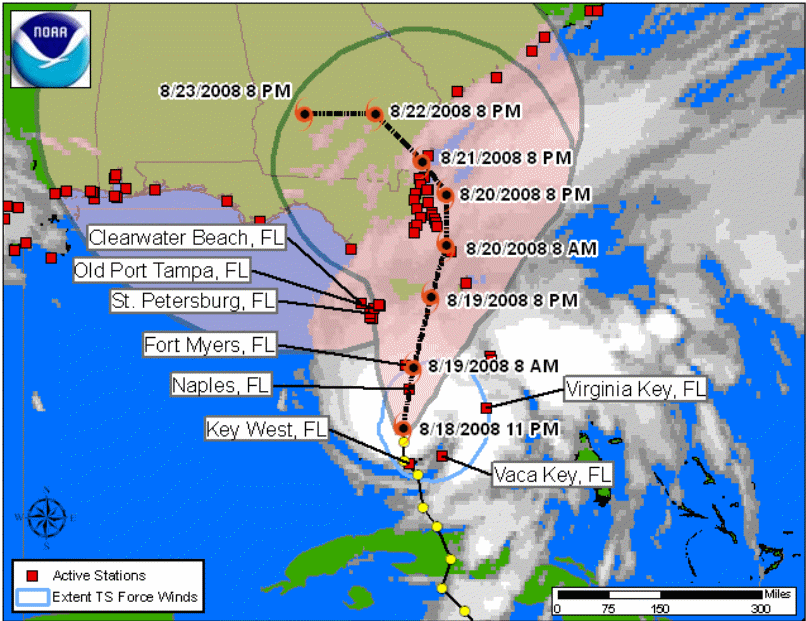
M4) Above is an example of the CO-OPS Storm QuickLook, which is initiated when a National Weather Service storm center issues a tropical storm warning for the U.S. or its island possessions. Using a 10-point scale where 1 means Poor and 10 means Excellent, please rate the map on the following:
a. Visual appeal
b. Ease of understanding
c. Ease of use
d. Allows me to find the information that I need
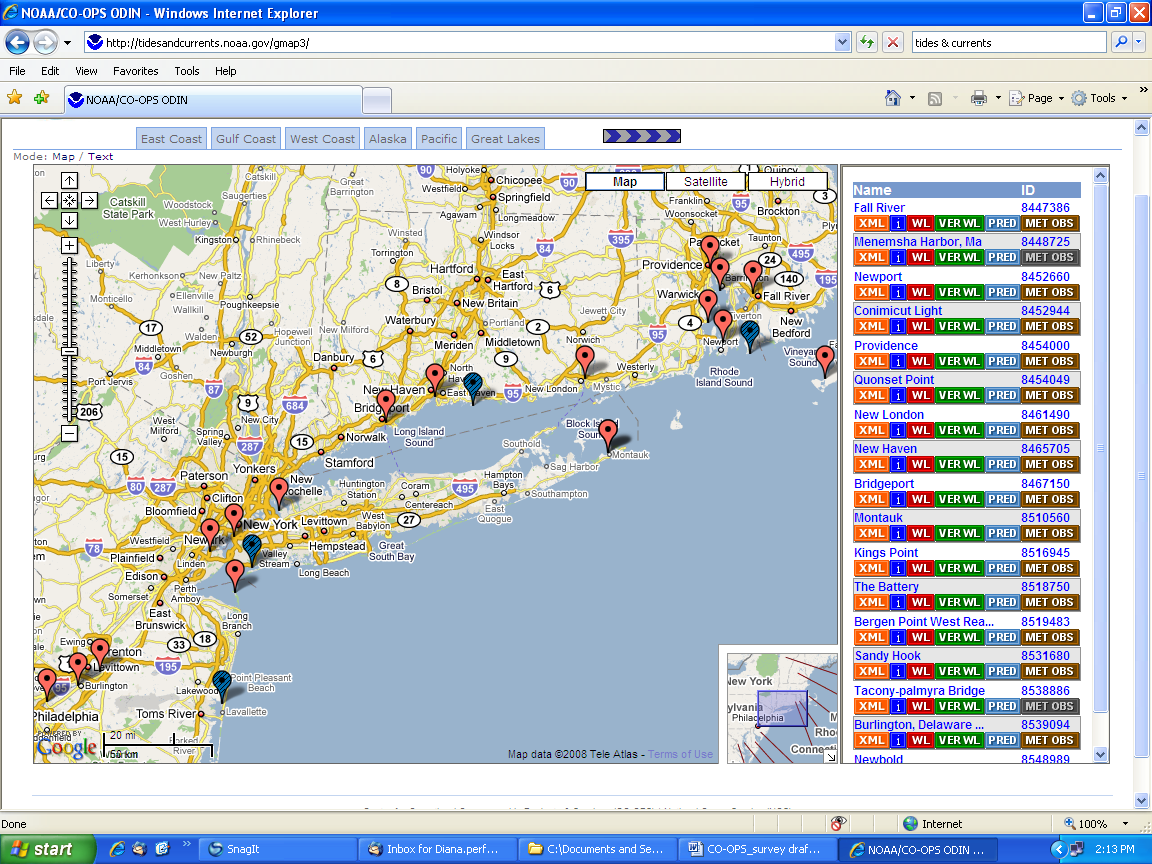
M5) Above is a clickable map showing what information is available for some local stations over a portion of the East Coast. Using a 10-point scale where 1 means Poor and 10 means Excellent, please rate the map on the following:
Visual appeal
Ease of understanding
Ease of use
Allows me to locate the information that I need
CO-OPS provides oceanographic data and information in the following general categories:
Tidal Predictions: The times and strength of the tide and tidal currents at a given location determined by a mathematical process which accounts for the gravitational effect of the Moon and Sun.
Observational data: Reports of the measured water level, current or other variable at a specific time for a given location.
Forecast Model Guidance: Information based on hydrodynamic models that use real-time observational data and weather forecast inputs to produce nowcast and forecast guidance of water levels and currents.
M6) Are the meanings of these categories of oceanographic information and data clear?
a) yes
b) no
M6a) (If NO to QM14) Please explain which definitions are not clear in the space provided below.
Customer Satisfaction Index
Now, please think about your overall satisfaction with the CO-OPS Program.
15) First, please consider all of your experiences with CO-OPS. Using a 10-point scale on which 1 means Very Dissatisfied and 10 means Very Satisfied, how satisfied are you with CO-OPS?
16) To what extent has CO-OPS met your expectations? Using a 10-point scale on which 1 now means Falls Short of your Expectations and 10 means Exceeds your Expectations, to what extent has CO-OPS fallen short of, or exceeded your expectations?
17) Forget CO-OPS for a moment. Now, imagine an ideal oceanographic products and services center. How well do you think that CO-OPS compares with that ideal center you just imagined? Please use a 10-point scale on which 1 means Not Very Close to the Ideal, and 10 means Very Close to the Ideal.
Desired Outcomes
18) Using a 10-point scale where 1 means Not at all Likely and 10 means Very Likely, how likely would you be to take action based on the information you receive from CO-OPS?
19) Using a 10-point scale, on which 1 means Not at all Confident and 10 means Very Confident, how confident are you that CO-OPS will do a good job of providing products and services in the future?
20) If you have any additional comments you would like to provide to the Center for Operational Oceanographic Products and Services (CO-OPS) at this time, please do so below. For example, can you suggest a specific product improvement?
Thank you for your time. CO-OPS appreciates your input and will use this feedback to better serve its customers.
![]()
| File Type | application/msword |
| File Title | Introduction |
| Author | Isoken Ogbeide |
| Last Modified By | bjinnohara |
| File Modified | 2009-05-26 |
| File Created | 2009-05-18 |
© 2026 OMB.report | Privacy Policy